Summary:
- Thermo Fisher Scientific is recommended as a buy for long-term investors due to its history of strong growth and improving margins.
- The company operates within multiple segments of healthcare and offers stability during times of uncertainty.
- TMO scores high on quality measures, with persistent and improving Cash Flow Returns On Investment, but is unlikely to offer a bargain.
JHVEPhoto
We initiate Thermo Fisher Scientific (NYSE:TMO) with a buy rating. TMO has a history of strong growth and improving margins, all done efficiently. This is not a value play for the short-term trader. This is a quality stock that offers stability during times of uncertainty and is most suitable for the long-term investor in our view.
Warren Buffett:
It’s far better to buy a wonderful company at a fair price than a fair company at a wonderful price.
We will demonstrate why TMO can serve as an anchor and add quality to any portfolio.
TMO scores high on multiple quality measures. Cash Flow Returns on Investment have been persistent and improving year after year. We see a slight dip in returns over the short term as the post-Covid bounce stabilizes, but these are expected to be back on track going forward. Quality and growth will always command a premium, and this company is unlikely to offer up a bargain.
The Company
The company is a $200bn market cap behemoth operating within multiple segments of health care, including providing life science solutions, analytical instruments, specialty diagnostics, laboratory products, and biopharma services.
THO Segment Revenue Breakdown (Thermo Fisher Scientific) Thermo Fisher Scientific Inc.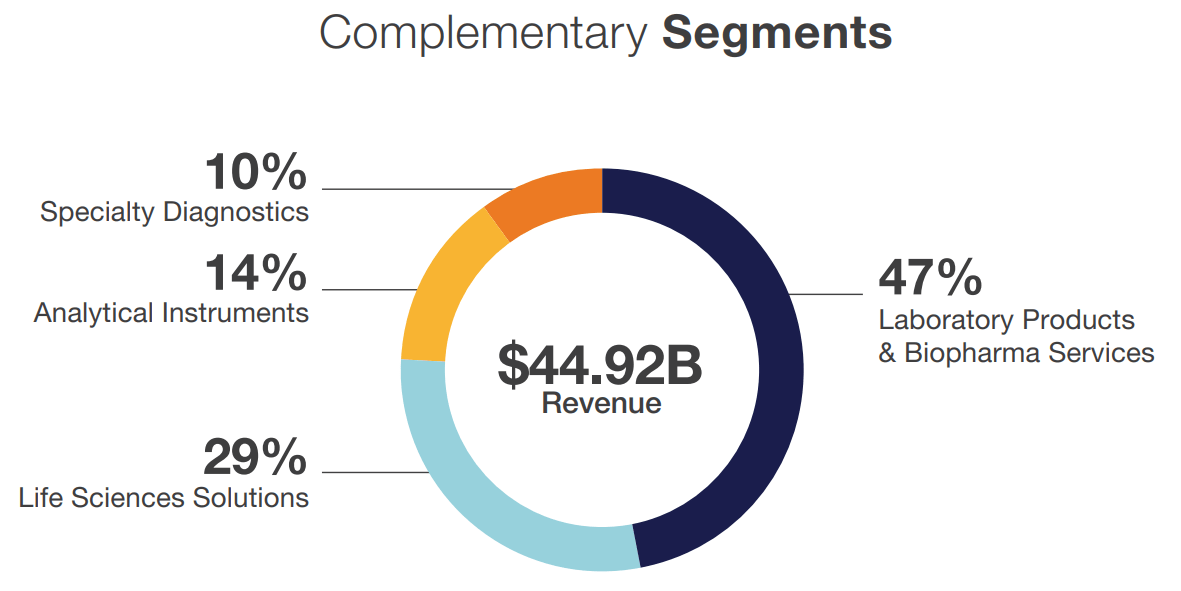
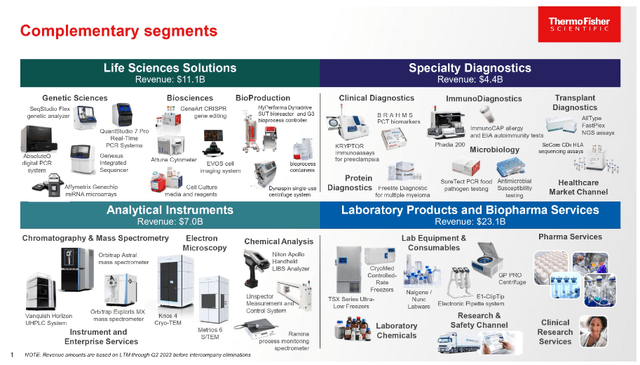
THO is one of the largest suppliers of healthcare products and is well-positioned to take advantage of an aging population.
Financials
FY23 revenues are expected to contract as the post covid revenge buying subsides. The macroeconomic environment remains challenging, with most businesses remaining cautious and unwilling to spend until they have more clarity.
Marc Casper, chairman, president, and chief executive officer of Thermo Fisher Scientific said:
The macroeconomic environment became more challenging in the second quarter. Economic activity in China slowed, and across the economy more broadly, businesses became more cautious in their spend. The team is leveraging our PPI Business System to effectively manage through this dynamic environment.
Approximately 45% of the revenues were generated outside of North America, and TMO faces foreign exchange risk, but we think this can only be transitory, can go both ways and will not affect the long-term prospects. The company also faces challenges with the supply of raw materials, labor costs, and components used in its products. This is evident in their Q2 results where we see the costs of revenue and general SG&A increase in proportion to revenues. Along with H1 revenues slowing from $22.8bn in FY22 H1 to $21.4bn in FY23 H1, these have a knock-on effect in lowering the bottom line.
THO Q2 Results (Thermo Fisher)
Given the double-barreled situation of high inflation and a challenging macroeconomic environment, management has reduced guidance for FY23. Revenues are now expected to be in the range of $43.4bn to $44.0bn, down from the previous estimate of $45.3bn, and adjusted EPS of $22.28 to $22.72, down from $23.7.
Looking at the balance sheet’s strengths and weaknesses, we see high net debt as of Q2, of $30.9bn, and FY23 net debt to EBITDA, at 2.24x, though a little lower than the 10-yr average. This could ideally be lower, but a comfortable interest cover for FY23 of 15.1x helps ease any debt related concerns.
THO Net Debt to EBITDA (ROCGA Research)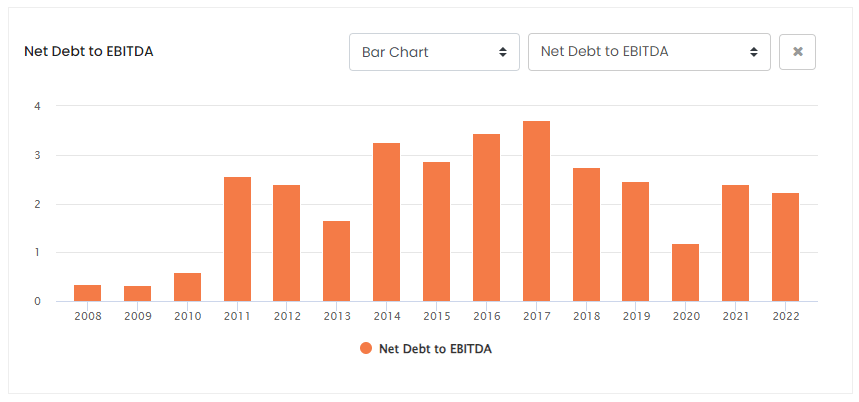
Talking cash and debt management, the company has returned over $3.25bn during the first half of FY23 to its shareholders via share repurchases and dividends.
The Value Drivers
We will now try and identify the value drivers, similar to a DuPont-like breakdown.
Return on Equity = Net Income / Stockholders Equity
This can be broken down further:
ROE = (profit margins) X (asset turnover) X (equity multiplier)
ROE = (net income / revenue) X (revenue / assets) X (Assets / Equity)
However, we will go one step further and add growth to this mix of returns calculation to show how these interact to create value.
TMO Revenue Per Share (ROCGA Research)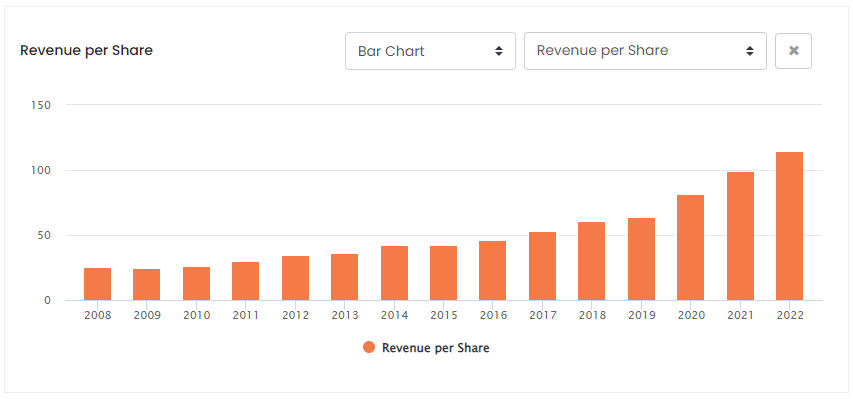
Revenue per share has grown from $25.1 in 2008 to $114.58 in 2022, a 356% increase, or over 10.5% compound annual growth rate. To maintain efficiency, growth should not be “at any cost”. Total asset over the same period has increased by roughly the same rate of 10.7% CAGR.
TMO Asset Turnover (ROCGA Research)
This leads us to the asset turnover, which has remained steady at around 0.4x. We have now seen that growth has been strong and efficiency has been stable, a positive indicator so far.
Revenue / Equity may not be a conventional ratio to look at, but just for comparison, this has increased from 0.70 to 1.02 over 15 years. This can be seen as another measure of improvement in efficiency. The company is driving more revenues per book value.
The next component we need to look at is the margins, this can either be Net Income or EBITDA.
TMO EBITDA Margins (ROCGA Research)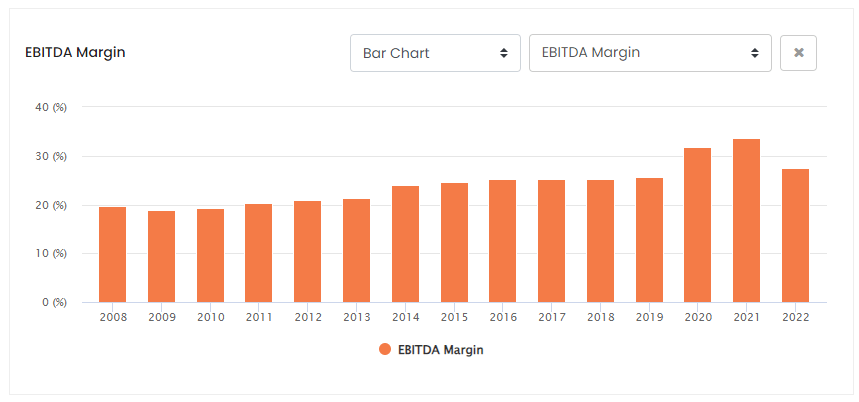
We can see EBITDA margins have gradually improved over the years. Another way to look at this, the 5-yr average EBITDA margin was higher at 28.7%, compared to the 15-yr average of 24.2%.
When we combine these together, we can calculate the Returns On Cash Generating Assets (ROCGA), an equivalent measure of Cash Flow Returns on Investments (CFROI).
TMO Returns on Cash Generating Assets (ROCGA Research)
For TMO, high top-line growth, increasing assets, stable asset turnover, and improving margins all translate to higher ROCGA. The diagram above also includes the estimated ROCGA for the forecast years, derived using consensus earnings. Though these are slightly lower, they are stable and comfortably above the long-term average.
More information on how ROCGA is calculated including gross assets, gross cash, and Cash Flow Returns on Investments can be found on Bartley Madden’s paper “The CFROI Life Cycle“. Bartley Madden has been a significant contributor to the Cash Flow Returns on Investment methodology.
Conventional Valuation
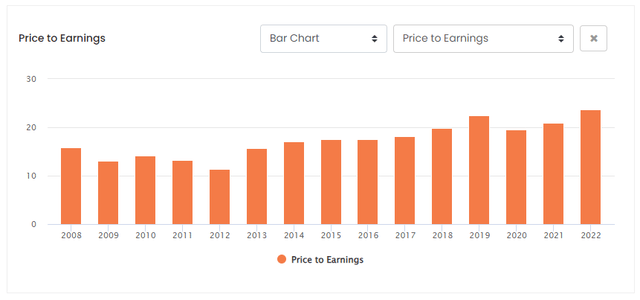
The PE ratio has been increasing gradually, and this can be easily explained by its increasing growth rate.
It is not just the PE ratio, TMO is trading on a higher multiple on most valuation ratios.
THO Valuation Ratios (ROCGA Research)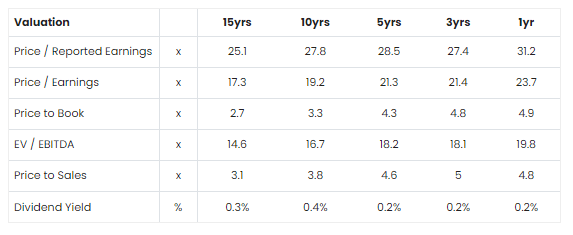
All the short-term ratios are higher than the long-term ratios.
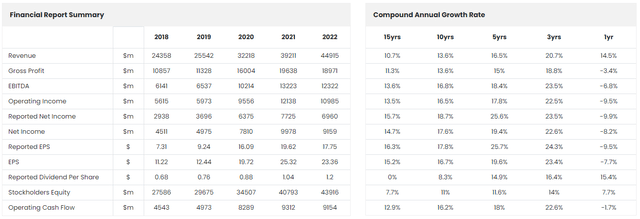
If we look at the short-term averages in CAGR above, apart from the 1yr (2022), all the short-term growth is greater than the longer-term numbers. This indicates that the rate of growth has increased. This explains why THO commands a higher valuation ratio.
The consensus EPS for FY23 of $22.42 translates to a PE ratio of 24.26x. This is a little higher than the medium-term average, but as growth returns in FY24, the PE ratio of 21.67x look more respectable.
Similarly, the price-to-sales ratio for FY23 of 4.84x is in line with the medium-term average.
The sector average median PE is 20.3x, lower than TMO’s. Similarly, the sector average PS is also lower. TMO has demonstrated higher growth, and we have the peer CAGR below for comparison.
THO Peers – Danaher, IQVIA, Agilent & West Pharmaceutical (ROCGA Research)
Higher growth is baked into the higher valuation for TMO and would be very sensitive if the medium-term outlook changed.
Cash Flow Returns On Investments Valuation
To value a company, we use our affiliate ROCGA Research’s quantitative and systematic Cash Flow Returns On Investments based DCF valuation and modeling tools. The first step involves modeling the company, back-testing the valuation for correlation with the historical share prices, and using that same model to forecast forward.
Default ROCGA Valuation (Valuation chart created by the author using ROCGA Research platform)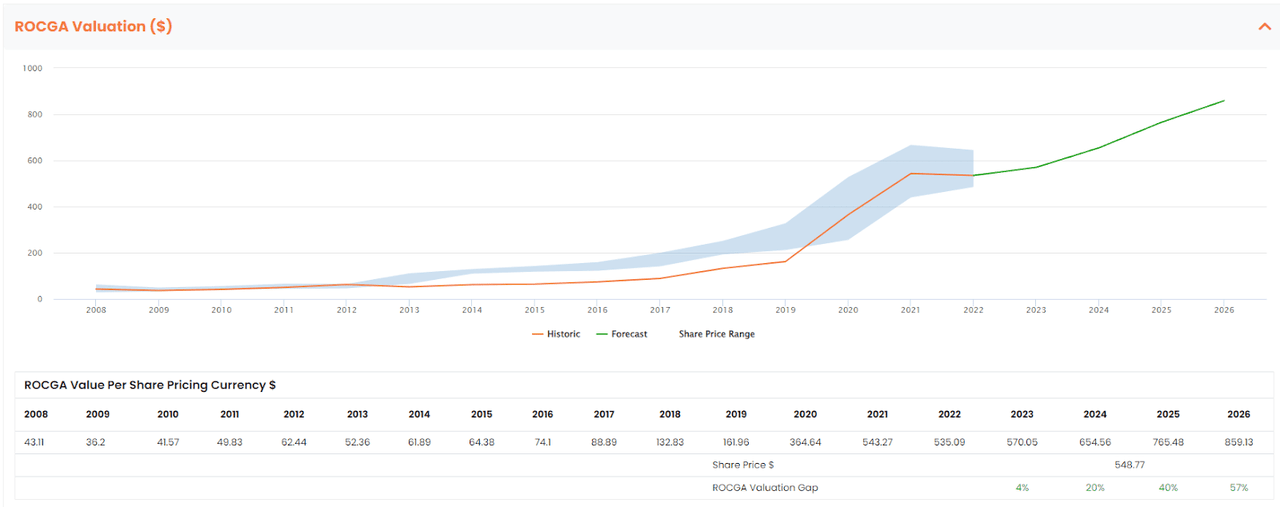
Value is a function of returns and growth in cash-generating assets. The total value of the company takes into account the present value of existing assets and the present value of growth. The blue band above represents the share price highs and lows for the year, and the orange line is the DCF model-driven historic valuation. The green line is the forecast warranted value derived using the same model along with consensus earnings and default self-sustainable organic growth.
For only half of the 15-yr period, we are getting a good correlation between the share price range and the model-generated valuation. For the remainder of the years (between 2003 to 2019), the company seemed overvalued. Over the last 10-yrs, the company has either been overvalued or at fair value. For FY23, THO is showing a 4% upside (undervalued), increasing significantly as we project further out. As mentioned earlier, this is not a value play, but you will be buying into quality and adding stability to your portfolio. In the worst-case scenario, you are buying a quality company at fair value, with the added bonus of potentially superior returns going forwards. The risks to the downside are limited.
If you look closely above, you will see the pattern in how the margins, returns, and asset growth contribute to the value creation of this company.
However, as mentioned earlier, higher growth is baked into the higher valuation THO commands, and if growth stalls beyond FY23, we will need to revisit our valuation methodology and expect the share prices to adjust accordingly.
To stress test, we modeled for a systematic reduction in long-term growth by 2%. This would bring it closer to the sector average rate and a reduction in our outlook. It would remain a high-quality company, but we would expect the fair value to be lower.
Risk Adjusted Valuation (Valuation chart created by the author using ROCGA Research platform)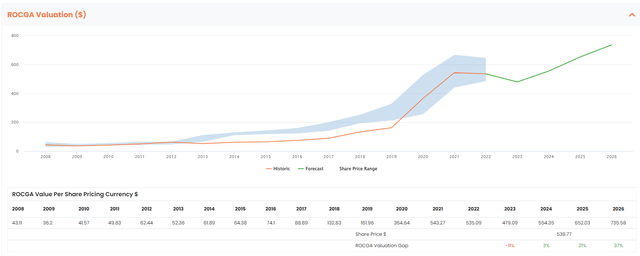
Conclusion
This is not a value play, but you will be buying into company a that has a proven history of value creation. In the worst-case scenario, you are buying a quality company at fair value, with the added bonus of potentially superior returns going forwards. The risks to the downside are limited.
We initiate Thermo Fisher Scientific (TMO) with a BUY rating.
Analyst’s Disclosure: I/we have no stock, option or similar derivative position in any of the companies mentioned, and no plans to initiate any such positions within the next 72 hours. I wrote this article myself, and it expresses my own opinions. I am not receiving compensation for it (other than from Seeking Alpha). I have no business relationship with any company whose stock is mentioned in this article.
Seeking Alpha’s Disclosure: Past performance is no guarantee of future results. No recommendation or advice is being given as to whether any investment is suitable for a particular investor. Any views or opinions expressed above may not reflect those of Seeking Alpha as a whole. Seeking Alpha is not a licensed securities dealer, broker or US investment adviser or investment bank. Our analysts are third party authors that include both professional investors and individual investors who may not be licensed or certified by any institute or regulatory body.

