Summary:
- Microsoft has shown consistent growth in its AI-related endeavors in 2023, particularly in its Server Products and Office Products segments.
- The partnership with OpenAI has allowed Microsoft to integrate GPT-4 models into most of its products and services, giving it a competitive edge.
- We believe Microsoft leads the Software and Cloud industries with its broader and more developed AI solutions across most verticals compared to its nearest competitors.
lcva2
In our prior assessment, we determined that Microsoft Corporation (NASDAQ:MSFT) has been consistently showcasing a rising trajectory in its AI-related endeavors throughout 2023 in terms of its product launches, partnerships, integrations, and acquisitions. Notably, the Server Products and Office Products segments emerged as focal points of significant advancement which we attributed to their substantial scale and user base. In the context of Microsoft’s Server Products, we foresee that their strides in AI are poised to bolster the competitive edge of their cloud business and drive revenue expansion. Likewise, within the Office Products domain, we believed its enhancements are anticipated to offer avenues for upselling new products and fortify Microsoft’s dominant stance in the software productivity market.
In this analysis, we thoroughly examined the company’s advancements in AI to ascertain its potential as a leading player in the Software & Services Industry Group for AI. Our approach involved multiple steps. Initially, we delved into the company’s collaboration with OpenAI, critically evaluating the impact of this partnership. A pivotal aspect of our assessment was a detailed comparison between the company’s Large Language Models (LLMs) and those of its competitors. Notably, we emphasized how Microsoft gains a competitive edge by seamlessly integrating GPT-4 models into its array of products and services.
Furthermore, we meticulously examined the broader landscape of the company’s AI innovations within the Software industry, comparing the company’s AI solutions based on the breakdown of the software market by Enterprise Software, Application Development Software, System Infrastructure Software and Productivity Software against the top 10 software companies by revenue. Moreover, for the IT Services industry, our analysis focuses on the cloud market where we compared the company’s Azure AI solutions with the top 9 cloud companies. Based on our analysis, we determined the best AI company in both Software and IT Services industries. Finally, we revised our valuation of the company based on a DCF analysis.
Microsoft OpenAI Partnership Strength
In our previous analysis, we highlighted Microsoft’s partnership with OpenAI since 2019 as the company developed AI models like GitHub Copilot, Dall-E, and ChatGPT.
Microsoft announced an extended partnership with OpenAI and was reported with plans for investments worth $10 bln in the company in a structured deal where Microsoft would receive 75% of profits until it recovers its investments and would have a 49% stake in the company after that while OpenAI’s non-profit entity will have a 2% stake to retain control.
We believe this deal signifies Microsoft’s strong focus on AI and presents opportunities across various segments of the company, including integrating AI into Bing, Microsoft 365, and the new Azure OpenAI service. Moreover, Microsoft would be the exclusive cloud provider to OpenAI as part of the deal.
We further examined the advantage that the partnership with OpenAI brings to Microsoft. In March 2023, OpenAI launched its GPT4 LLM. We analyzed the company’s LLM and compared it with 17 other LLMs below based on organizations, launch year, parameter count, and performance on the Multi-Task Language Understanding (MMLU) benchmark.
The benchmark covers 57 subjects across STEM, the humanities, the social sciences, and more. It ranges in difficulty from an elementary level to an advanced professional level, and it tests both world knowledge and problem solving ability.
|
Model |
Organization |
Year Launched |
Parameter Count |
MMLU Benchmark Average Score |
|
GPT-4 |
OpenAI |
2023 |
~1,800 bln parameters |
86.4 |
|
Switch |
2022 |
1,600 bln parameters |
N/A |
|
|
Megatron-Tuning |
NVIDIA (NVDA) |
2022 |
530 bln parameters |
N/A |
|
PaLM2 |
|
2023 (2022 PaLM) |
340 bln parameters |
78.3 |
|
ERNIE 3.0 TITAN |
Baidu (BIDU) |
2021 |
260 bln parameters |
N/A |
|
OPT |
Meta AI (META) |
2022 |
175 bln parameters |
N/A |
|
GPT-3 |
OpenAI |
2020 |
175 bln parameters |
43.9 |
|
LaMDA |
|
2020 |
137 bln parameters |
N/A |
|
GLM |
Tsinghua University |
2022 |
130 bln parameters |
44.8 |
|
Galactica |
Meta AI |
2022 |
120 bln parameters |
52.6 |
|
Chinchilla |
Google DeepMind |
2022 |
70 bln parameters |
67.5 |
|
LLaMA |
Meta AI |
2023 |
65 bln parameters |
68.9 |
|
UL2 |
|
2022 |
20 bln parameters |
N/A |
|
GPT-NeoX |
EleutherAI |
2022 |
20 bln parameters |
35.95 |
|
Flan-T5 |
|
2022 |
11 bln parameters |
55.1 |
|
H3 |
Stanford University |
2022 |
2.7 bln parameters |
N/A |
|
CTRL |
Salesforce (CRM) |
2019 |
1.63 bln parameters |
N/A |
|
RoBERTa |
Meta AI |
2019 |
0.345 bln parameters |
27.9 |
Source: Company Data, Research Reports, Khaveen Investments
Based on the table above, OpenAI’s GPT-4 model launched in 2023 boasts an impressive parameter count of 1,800 bln parameters which is the highest among the compared LLMs. Furthermore, GPT-4 has exceptional performance on the MMLU benchmark, where it secured the top position with an average score of 86.4. In comparison, this is a significant growth to OpenAI’s GPT-3, introduced in 2020, which has 175 bln parameters and an average MMLU score of only 43.9.
Furthermore, Google trails OpenAI’s GPT-4 with its Switch model having 1.6 tln parameters while its PaLM2 has the second highest MMLU benchmark score of 78.3. Impressively, although it does not have the highest parameters and MMLU benchmark, Google has 6 out of the 18 LLMs in the table above, this includes Switch (1,600 bln parameters), PaLM2 (340 bln parameters), and LaMDA (137 bln parameters), Chinchilla (70 bln parameters and MMLU average score of 67.5), UL2 (20 bln parameters), Flan-T5 with 11 bln parameters and an MMLU average score of 55.1.
Other organizations with LLMs include NVIDIA’s Megatron-Tuning, introduced in 2022 with 530 bln parameters, and Baidu’s ERNIE 3.0 TITAN, launched in 2021 with 260 bln parameters. Meta AI’s RoBERTa was launched in 2019 with 0.345 bln parameters with an MMLU average score of 27.9. Whereas Stanford University’s H3 (2.7 bln parameters) and Salesforce’s CTRL (1.63 bln parameters) both launched in 2022 and 2019.
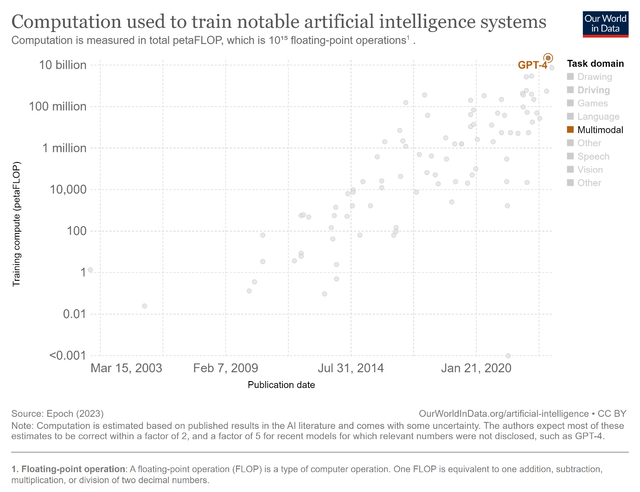
In relation, according to Our World in Data, GPT-4 has the highest training compute with 21 tln petaFLOPs as seen in the chart above. Based on the trend, AI models’ computing power had been rising over the past 2 decades.
In terms of training LLMs, parameters refer to the values that are learned by the model during training. Training compute refers to the number of computational resources required to train an LLM encompassing processing power, memory, and storage for performing calculations and storing training data.
Microsoft effectively leverages OpenAI’s GPT models across various products and services. For example, Office Products integrate Copilot, a natural language assistant powered by GPT-4. Dynamics 365 and Power Platform utilize GPT-4 to enhance AI models and reasoning capabilities.
Additionally, Azure OpenAI Service which leverages GPT technologies is integrated into Microsoft Power Apps, enabling users to build applications efficiently using conversational language. Bing Chat facilitates chat interactions with GPT-4 on Microsoft Edge. Moreover, Microsoft offers Azure OpenAI Service, a cloud platform granting access to GPT-4 and other large language models.
Based on its latest earnings briefing, Microsoft’s Azure OpenAI Service has been adopted by over 11,000 organizations across various industries.
All in all, we believe that Microsoft could leverage its partnership with OpenAI through its multibillion-dollar investment in the company to reap benefits as the company highlighted its focus to integrate AI across its products and services. Specially, we believe that Microsoft not only benefits as “Azure powers all of OpenAI’s workloads” being OpenAI’s exclusive cloud provider according to its annual report, but also stand to benefit from the advantage of OpenAI’s LLMs such as its GPT-4 model which is the largest in terms of parameters over a tln parameters and training compute and which we believe underlines the immensely powerful capabilities of the AI model as reflected with it having the highest MMLU benchmark scores indicating its strong numerical and factual capabilities. We believe Microsoft could continue to leverage GPT-4’s strengths as the company integrates the model across a variety of products and services in software and cloud and support the company’s competitiveness in software and cloud markets.
The Best AI Company in Software
Company Data, Statista, Khaveen Investments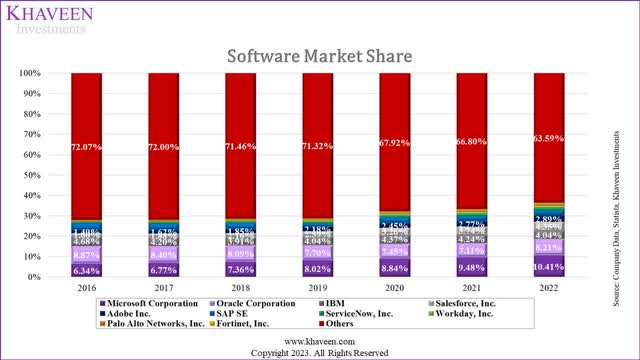
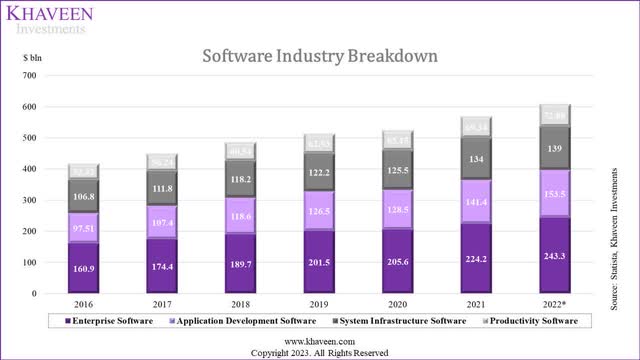
Based on the chart above of the Software market share, Microsoft remained the Software market leader in 2022 with a market share of 10.4% of the Software companies. The company overtook Oracle (ORCL) as the market leader in 2019 as seen in the chart above.
To determine whether Microsoft is the best AI company in the Software Industry, we examined each of the top 10 companies’ (and Google’s) AI developments and compiled the number of AI developments each company has in the table below. Besides that, we identified whether Microsoft’s competitors integrate LLMs in their software products.
|
Company |
Productivity Software |
Enterprise Software |
System Infrastructure Software |
Application Development Software |
Total |
LLM Integration in Products |
|
Microsoft |
4 |
3 |
2 |
4 |
13 |
GPT-4 |
|
Oracle |
1 |
1 |
1 |
3 |
Cohere |
|
|
IBM (IBM) |
1 |
2 |
10 |
1 |
14 |
N/A |
|
Salesforce |
2 |
1 |
3 |
CodeT5 |
||
|
Adobe (ADBE) |
1 |
1 |
FLAN-T5, Adobe Firefly |
|||
|
SAP (SAP) |
1 |
2 |
3 |
N/A |
||
|
ServiceNow (NOW) |
1 |
1 |
LaMDA |
|||
|
Workday (WORK) |
1 |
1 |
N/A |
|||
|
Palo Alto Networks (PANW) |
5 |
5 |
N/A |
|||
|
Fortinet |
5 |
5 |
N/A |
|||
|
Google (FTNT) |
3 |
3 |
PaLM2 |
Source: Company Data, Oracle, Markettech, TechCrunch, ServiceNow, Khaveen Investments
Productivity Software
One of the examples of Microsoft’s 12 AI integration into its software products includes its AI-powered writing assistance tool, Editor, launched in 2020 with support for over 20 languages benefiting over 200 mln Microsoft Office users. Zapier listed Microsoft Editor as one of the best AI grammar checkers. In comparison, we identified a similar AI feature in Google Workspace. We believe this increases the competitiveness of Microsoft and Google’s productivity software against competitors.
Furthermore, Copilot is an integrated tool in Microsoft 365 apps (Word, Excel, PowerPoint, Outlook) that boosts creativity, productivity, and collaboration. It generates drafts, summaries, suggestions and automates tasks via natural language prompts and data analysis. Google introduced Duet AI for Google Workspace, offering similar AI-powered features. According to Startups, Microsoft Excel’s Copilot and Google Sheets’ Duet offer AI-powered data analysis and organization features, while Google Docs’ Duet and Microsoft Word’s Copilot assist with writing tasks. Copilot is notable in Microsoft Teams for collaborative meeting tasks, including scheduling, data retrieval, and summaries.
In creativity software, Microsoft launched its AI-powered creativity tool called Microsoft Designer in 2023 which integrates with OpenAI’s DALL-E2 AI model. It competes against Adobe Express which has its own Adobe Firefly AI engine. Furthermore, Adobe Firefly stands out by offering a diverse range of generative AI tools beyond image generation. According to SourceForge comparison, Adobe Firely’s advantage over DALL-E is its ability AI Video and Photo Editors which DALL-E2 does not have. In contrast, Microsoft provides a more limited selection of applications, including AI Art Generators, AI Design, AI Image Generators, AI Tools, Graphic Design, and Social Media Graphics.
For virtual assistants, Microsoft has Microsoft Cortana with integration with productivity applications like Microsoft Teams and Outlook. Cortana enhances collaboration in Microsoft Teams by aiding in meeting management and providing AI-powered information retrieval for meetings. In comparison, Google Assistant is integrated with Google Workspace, aiding users in managing tasks while mobile or remote. Microsoft’s Cortana surpasses Google Assistant due to broader integration across email, video calls, and Office apps, offering greater benefits. Additionally, companies like Oracle, IBM, and SAP have introduced their own AI chatbots and conversational AI software.
Overall, we believe these AI-powered solutions could enhance the competitiveness of Microsoft, Google, Adobe, Oracle, IBM and SAP. Though, we believe Microsoft stands out among competitors in the Productivity Software segment as the company has the highest number of AI solutions with a total of 4 including Editor, Copilot, Designer and Cortona. Moreover, we believe a strength that Microsoft has is its integration of GPT-4 in Copilot which we determined from the previous point is the most powerful LLM currently.
Enterprise Software
In ERP and CRM software, Microsoft has introduced its Dynamics 365 Copilot which offers six impactful use cases such as sales, customer service, customer insights, marketing, product listings and supply chain management. In comparison, we identified competitors as Oracle and Workday. Moreover, Salesforce has introduced Einstein GPT, a Generative AI aimed at enhancing CRM capabilities. Finally, SAP’s Business AI integrated into its ERP software encompasses 4 key areas.
In Business Intelligence software, Microsoft Fabric unifies tools such as Azure Data Factory, Azure Synapse Analytics, and Power BI, enabling data and business experts to optimize data usage and prepare for AI progress. Other companies such as IBM compete against Microsoft with its IBM Business Analytic and Knowledge Catalog solutions.
In RPA, Microsoft Power Automate is a cloud-focused RPA platform built on Azure. Salesforce (MuleSoft) integrates RPA with Anypoint and Salesforce Platform, renaming it MuleSoft RPA after acquiring Servicetrace. Additionally, SAP and IBM also have RPA solutions with several AI integrations. However, Microsoft is the only company among its top competitors that is categorized by Gartner in the Leader quadrant for RPA. In comparison, the company competes against SAP and Salesforce which are categorized lower than Microsoft as Visionaries.
Overall, we believe these AI developments support Microsoft, Oracle, Workday, Salesforce, IBM, and SAP’s competitiveness in Enterprise Software. Though, we believe Microsoft stands out with the most AI solutions (3) for its range of enterprise software products from Dynamics 365 to Microsoft Fabrics to Power Automate which leverages OpenAI’s superior AI models.
System Infrastructure Software
In IT management software, Microsoft introduced its AIOps solution called AiDice. Microsoft’s AIOps solution focuses on infusing AI into cloud computing systems to improve its availability, reliability, performance, efficiency and security. In comparison, IBM has several AI integrations for IT management software including AIOps Insights, Turbonomic and Instana Observability. Furthermore, ServiceNow has its Now Intelligence solution which powers its Now Platform for IT management operations with a range of features such as chatbots, predictive analytics and AI-powered search tools.
In Cybersecurity, Microsoft has introduced Copilot for Security, designed for various use cases including incident response, threat hunting, and security reporting. In contrast, IBM offers a suite of seven AI solutions for cybersecurity with capabilities such as threat detection, response automation, vulnerabilities discovery and incident analytics, encompassing products such as IBM Security QRadar EDR, IBM Security QRadar Suite, IBM Security QRadar SOAR, IBM Security QRadar SIEM, IBM MaaS360 Advisor with Watson, IBM Security Verify Access Management, and IBM Security QRadar Log Insights. Additionally, Palo Alto provides AI-powered security products like Cortex XDR, Prisma Cloud, AutoFocus, PAN-OS, and Cortex Data Lake. Lastly, Fortinet offers several AI security solutions, including FortiGuard Labs Threat Intelligence, FortiGate Next-Generation Firewall, FortiSIEM, FortiWeb, FortiNAC, and Fortinet Automated Security Operations.
Overall, we believe these AI enhancements support the competitiveness of Microsoft, IBM ServiceNow, Fortinet and Palo Alto in System Infrastructure Software. Furthermore, we believe IBM stands out among competitors for this software market segment with the most AI solutions across IT management software and cybersecurity with a total of 10 solutions.
Application Development Software
Additionally, Microsoft also offers Power Apps which leverage GPT technology through Azure OpenAI Service, enabling users to add natural language use cases in their apps such as…
… to interactively fill in forms or questionnaires, generate reports and summaries from a dataset, create automated chatbot conversations, and more.
Not to mention, Microsoft Power Apps is part of its Power Platform package which features other complimentary software such as Power Pages and Power Virtual Agents. For GitHub, Microsoft has integrated Copilot which significantly enhances productivity for developers, with 88% reporting increased productivity, 74% able to engage in more fulfilling tasks, and 77% spending less time searching for information or examples.
In comparison, competitors such as Oracle have its low-code application solution called Oracle APEX which incorporates business process automation AI features. Furthermore, the Salesforce Lightning Platform features the company’s Einstein Platform services for app development. IBM has its IBM Watson Assistant chatbot which competes against Microsoft’s Power Agents.
Overall, we believe these AI solutions enhance the competitiveness of Microsoft, Oracle, Salesforce and IBM in Application Development Software. Though, we believe that Microsoft edges out its competitors here by enabling a wide range of use cases through its application development platform that is integrated with its Azure OpenAI Service powered by its superior GPT technology enabling various natural language applications from generative AI to chatbots embedded in applications. Also, Microsoft had been ranked as one of the top leaders in low-code application platforms ahead of its top competitors in 2022 according to Gartner.
Summary
|
Software Segment |
Breakdown % |
Best Company |
|
Enterprise Software |
40.0% |
Microsoft |
|
Application Development Software |
25.2% |
Microsoft |
|
System Infrastructure Software |
22.8% |
IBM |
|
Productivity Software |
12.0% |
Microsoft |
Source: Statista, Khaveen Investments
As discussed, we believe Microsoft has the best AI breakthroughs in 3 software market segments which are Enterprise Software, Application Development Software, and Productivity Software which accounts for 77.2% of the total software industry. Whereas we believe IBM only leads in System Infrastructure Software (22.8% of the total software market) as it has the most AI solutions spanning across IT operations management software to cybersecurity. The reason we see Microsoft’s leadership in the other 3 segments is due to its wide breadth of AI solutions such as AI virtual assistants, designer and grammar tools in Productivity Software and Application Development Software to AI solutions for ERP, CRM, RPA and BI software in Enterprise Software. These solutions commonly leverage OpenAI’s AI models such as GPT-4 which we determined is the superior LLM currently which reflects positively on Microsoft’s AI capabilities compared to other companies such as IBM which does not highlight their LLMs. Moreover, we see Microsoft’s unique strength is its integration of AI-powered solutions across its wide ecosystem of products.
The Best AI Company in IT Services
In this section, we determined whether Microsoft could be the best AI company in IT Services. According to Gartner, IT Services was valued at $1,306 bln in 2022. The IT Services are broken down into cloud (consisting of IaaS, PaaS and SaaS), IT consulting & Implementation, IT Outsourcing and other IT Services. According to Statista, the total cloud market was $415 bln in 2022 which is 32% of the total IT Services market. This is followed by IT Outsourcing which was $412 bln or 31.5% of the total industry, IT Consulting & Implementation at $63 bln (5%) and other IT Services at $322 bln (25%). Thus, as the largest market within IT Services, we focused on the cloud market.
|
IT Services Industry Breakdown |
Market Value ($ bln) |
Breakdown % |
|
Cloud Market |
415 |
32% |
|
IT Outsourcing |
412 |
31.5% |
|
IT Consulting & Implementation |
63 |
5% |
|
Other IT Services |
322 |
25% |
Source: Statista, Gartner, Khaveen Investments
Synergy Research, Khaveen Investments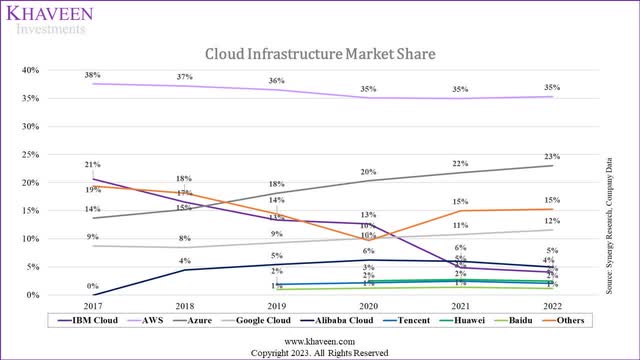
AWS maintained its dominant position in the cloud market with a steady 35% share from 2020 to 2022, while Microsoft Azure showed significant growth, rising from 0% in 2016 to 23% in 2022, challenging AWS’s dominance. Google Cloud also demonstrated steady growth, reaching a 12% share in 2022. Chinese cloud providers Alibaba Cloud (BABA) and Tencent (OTCPK:TCEHY) captured 5% and 2% of the market share in 2022. However, IBM Cloud’s share declined from 25% in 2016 to 4% in 2022.
In the table below, we compared the company’s number of cloud AI solutions based on 3 AI technologies which are NLP, Data Science & Machine Learning Platforms and Computer Vision from their websites.
|
Number of Cloud AI Solutions |
NLP |
Data Science & Machine Learning Platforms |
Computer Vision |
Total |
|
AWS |
9 |
12 |
3 |
24 |
|
Microsoft Azure |
15 |
8 |
4 |
27 |
|
Google Cloud |
9 |
4 |
2 |
15 |
|
Alibaba |
9 |
1 |
3 |
13 |
|
Tencent |
4 |
1 |
2 |
7 |
|
Huawei |
6 |
3 |
1 |
10 |
|
Baidu |
8 |
1 |
2 |
11 |
|
IBM |
9 |
3 |
0 |
12 |
|
Oracle Cloud |
3 |
5 |
1 |
9 |
Source: Company Data, Khaveen Investments
NLP
Firstly, AWS provides Amazon Lex for chatbots, Amazon Transcribe for speech recognition, Amazon Polly for text-to-speech, Amazon Kendra for information retrieval, Amazon Personalize for personalization, Amazon Translate for language translation, and Amazon Textract for text extraction.
However, Microsoft Azure has the highest number of cloud AI solutions for NLP at 15 solutions which include Azure AI Bot Service, Azure AI Immersive Reader, and Azure Cognitive Search. Whereas Google Cloud features its Cloud Natural Language, Dialogflow, and Translation AI for NLP.
Alibaba Cloud offers Intelligent Speech Interaction, Speech Synthesis, and Machine Translation. Tencent’s solutions include Text to Speech, Automatic Speech Recognition, and Short Sentence Recognition. Huawei Cloud provides Question Answering Bot, Content Moderation and Graph Engine Service.
Baidu Cloud offers Speech-to-Text, Call Center Solution and Image Search. IBM Cloud’s solutions include Watson Assistant, Text-to-Speech, and Knowledge Studio. Finally, Oracle Cloud offers services like OCI Language, OCI Document Understanding, and OCI Intelligent Recommendation.
Overall, we believe these cloud AI solutions encompassing NLP could enhance the competitiveness of the 9 cloud companies, but we believe that Microsoft has an advantage with the greatest number of cloud AI solutions for NLP.
Data Science & Machine Learning Platforms
AWS offers the highest number of AI solutions for Data Science & Machine Learning Platforms with a total of 12 including SageMaker which allows users to leverage AI models such as GPT-J which has 6 bln parameters, Amazon Bedrock, Amazon HealthLake, Amazon Comprehend Medical, Amazon Lookout for Equipment, Amazon Monitron, Amazon LookOut for Metrics, Fraud Detector, Amazon Forecast, DevOps Guru, CodeGuru Reviewer, and CodeGuru Profiler.
On the other hand, Microsoft Azure provides Azure Machine Learning, Azure Open Datasets, Azure AI services, Azure OpenAI Service which is integrated with GPT-4, Microsoft Genomics, Health Bot, AI Anomaly Detector, and Azure AI Metrics Advisor. Furthermore, Google Cloud features Vertex AI allowing users to leverage its latest PaLM2 model, Vertex AI Workbench, AutoML, and Timeseries Insights API.
Alibaba Cloud has its Machine Learning Platform for AI where Huawei Cloud provides ModelArts, Huawei HiLens, and EIHealth. Tencent Cloud offers its AI Platform Service and Baidu Cloud provides Machine Learning (BML). IBM Cloud’s solutions encompass Watson Studio, Watson Machine Learning, Watson OpenScale, and Oracle Cloud features Oracle Modern Data Platform, OCI Anomaly Detection, OCI Data Labeling, OCI Data Science, and OCI Forecasting.
Overall, we believe these cloud AI solutions encompassing Data Science & Machine Learning Platforms could enhance the competitiveness of the 9 cloud companies, but we believe that despite AWS having the highest number of AI solutions in this field, we believe Microsoft has an advantage with its GPT-4 integration which is superior compared to AWS’s GPT-J model integration.
Computer Vision
Finally, for Computer Vision cloud AI solutions, AWS provides Amazon Rekognition for image and video analysis, Amazon Lookout for Vision to detect defects and automate inspections and AWS Panorama for computer vision at the edge.
Microsoft Azure offers Azure AI Video Indexer for video analysis, Azure AI Custom Vision for custom image recognition, and Azure Kinect DK for depth sensing. Moreover, Google Cloud features Video AI and Vision AI for video and image analysis.
Alibaba Cloud provides an Image Recognition and Analysis Platform for Pneumonia CT Images. Tencent Cloud’s solutions include its Face Recognition and Content Review services. Huawei Cloud’s services include Image Recognition and Content Moderation. Oracle Cloud offers OCI Vision for image recognition and analysis, while Baidu’s offerings encompass Face Recognition. IBM Cloud includes Visual Recognition as part of its services.
Overall, we believe these cloud AI solutions encompassing Computer Vision could enhance the competitiveness of the 9 cloud companies excluding IBM, though we believe Microsoft edges out all cloud companies due to it having the highest number of cloud AI solutions for Computer Vision.
Summary
In summary, we believe these cloud AI solutions could enhance the competitiveness of all 9 major cloud service companies. Within the cloud market, we believe Microsoft edges out all its competitors with the most cloud AI services in NLP and Computer Vision. Moreover, we believe the company’s integration of OpenAI’s GPT-4 LLM in its cloud services such as Azure OpenAI Service benefits the company as the superior AI model enabling greater capabilities for its AI solutions. In relation, we believe Microsoft’s integration of GPT-4 highlights its strength against the top players such as AWS which had integrated third-party LLMs for its cloud services and Google Cloud’s Vertex AI which is powered by PaLM2 but is only ranked as the fourth largest LLM by parameter count and second highest in terms of the MMLU benchmark. Moreover, as mentioned, Microsoft had extended its partnership with OpenAI as the exclusive cloud provider for the company’s AI workloads. Therefore, based on these factors, we believe Microsoft is the best cloud company positioned to benefit from AI.
Risk: Competition from Other LLM Developments
One of the risks is the development of AI LLMs by key competitors. For example, Meta announced the launch of Llama 2, an open-source language model set to compete with OpenAI’s GPT-4 and is available for free to researchers and commercial use. Notwithstanding, we believe one of the key advantages of OpenAI’s GPT-4 is its larger scale in terms of parameters and compute power compared to Meta’s new LLM. Furthermore, in our previous analysis of Google, we highlighted the company’s continuous developments in LLMs. As mentioned above, the company has 6 of the 18 compared language models but its most powerful PaLM2 is still behind GPT-4 in terms of parameter count and benchmark score. However, Google had announced that it was developing its new Gemini AI model which could compete against GPT-4. That said, OpenAI had filed for a patent application for “GPT-5” according to Search Engine Journal, which we believe highlights OpenAI’s commitment to improving its AI models which could support its competitiveness and benefit Microsoft as the exclusive cloud provider to OpenAI.
Valuation
|
Revenue Projections ($ mln) |
2022 |
2023 |
2024F |
2025F |
2026F |
|
Office Products |
44,862 |
48,728 |
54,404 |
60,741 |
67,817 |
|
Office Products Growth % |
12.5% |
8.6% |
11.6% |
11.6% |
11.6% |
|
|
13,816 |
15,145 |
17,015 |
18,776 |
20,344 |
|
LinkedIn Growth % |
34.3% |
9.6% |
12.3% |
10.3% |
8.3% |
|
Dynamics |
4,686 |
5,437 |
6,415 |
7,440 |
8,481 |
|
Dynamics Growth % |
24.8% |
16.0% |
18.0% |
16.0% |
14.0% |
|
Server Products |
67,321 |
79,970 |
107,584 |
144,567 |
192,801 |
|
Server Products Growth % |
28.0% |
18.8% |
34.5% |
34.4% |
33.4% |
|
Windows Revenues (excluding Search and News Advertising) |
24,761 |
21,507 |
21,896 |
22,293 |
22,696 |
|
Windows Revenues Growth % |
10.1% |
-13.1% |
1.8% |
1.8% |
1.8% |
|
Total Search and News Advertising |
11,591 |
12,208 |
17,870 |
21,276 |
24,645 |
|
Search and News Advertising Growth % |
25.1% |
5.3% |
46.4% |
19.1% |
15.8% |
|
Other Segments |
31,233 |
28,920 |
30,094 |
31,784 |
33,972 |
|
Other Segments Growth % |
4.7% |
-7.4% |
4.1% |
5.6% |
6.9% |
|
Total Revenues (Excluding Activision) |
198,270 |
211,915 |
255,278 |
306,878 |
370,756 |
|
Total Revenues Growth % |
18.0% |
6.9% |
20.5% |
20.2% |
20.8% |
|
Total Activision (Including Synergies) |
11,578 |
12,561 |
14,465 |
||
|
Total Revenue |
198,270 |
211,915 |
266,856 |
319,438 |
385,222 |
|
Growth % |
18.0% |
6.9% |
25.9% |
19.7% |
20.6% |
Source: Company Data, Khaveen Investments
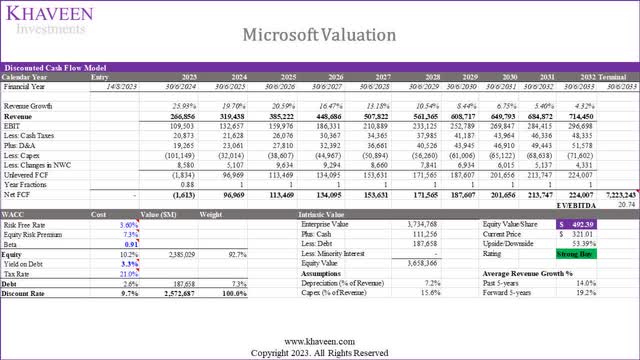
Following the release of its full-year results, we updated our revenue projections for the company by segments based on our previous analysis. With our revised projections, we forecasted the company to have a 5-year average forward growth rate of 19.2% driven by the company’s cloud growth which we believe could be supported by its AI developments. Furthermore, we continued to factor in the company’s planned acquisition of Activision which we see contributing 5.4% incremental revenue growth for FY2024.
Based on a discount rate of 9.7% (company’s WACC) and terminal value based on the company’s 5-year average EV/EBITDA of 20.74x, our DCF model shows its shares are undervalued by 54%.
Verdict
In conclusion, we believe Microsoft is well-positioned to harness its partnership with OpenAI as it stands to benefit from being OpenAI’s exclusive cloud provider, powering OpenAI’s workloads through Azure, and utilizing the potential of OpenAI’s GPT-4 model by incorporating it across its vast products and services. GPT-4’s impressive scale and capabilities, evident in its top MMLU benchmark scores, can greatly enhance Microsoft’s software and cloud offerings.
We believe Microsoft leads in Enterprise Software, Application Development Software, and Productivity Software, making up 77.2% of the market due to its diverse AI solutions ranging from virtual assistants to advanced tools as well as its integration with OpenAI’s AI models, particularly the superior GPT-4, setting it apart from rivals like IBM. Moreover, we see Microsoft’s strength in seamlessly integrating AI-powered solutions throughout its extensive product ecosystem.
Moreover, we also Microsoft stands out as a frontrunner in the cloud market, offering comprehensive cloud AI services, notably in NLP and Computer Vision. We believe integrating OpenAI’s GPT-4 into Azure OpenAI Service further enhances Microsoft’s AI capabilities, reinforcing its edge over competitors like AWS and Google Cloud’s Vertex AI. In relation, we see the extended Microsoft-OpenAI partnership, with Microsoft as the exclusive cloud provider for OpenAI’s AI workloads, solidifying Microsoft’s dominance in the AI cloud sector.
Overall, we maintain our Strong Buy rating based on our updated DCF valuation with a price target of $492.39 which is in line with our previous price target, as we see the company capitalizing on its solid position in both Software and IT Services industries with its robust AI developments enhancing its competitiveness and growth outlook.
Editor’s Note: This article was submitted as part of Seeking Alpha’s Best AI Ideas investment competition, which runs through August 15. With cash prizes, this competition — open to all contributors — is one you don’t want to miss. If you are interested in becoming a contributor and taking part in the competition, click here to find out more and submit your article today!
Analyst’s Disclosure: I/we have a beneficial long position in the shares of MSFT either through stock ownership, options, or other derivatives. I wrote this article myself, and it expresses my own opinions. I am not receiving compensation for it (other than from Seeking Alpha). I have no business relationship with any company whose stock is mentioned in this article.
No information in this publication is intended as investment, tax, accounting, or legal advice, or as an offer/solicitation to sell or buy. Material provided in this publication is for educational purposes only, and was prepared from sources and data believed to be reliable, but we do not guarantee its accuracy or completeness.
Seeking Alpha’s Disclosure: Past performance is no guarantee of future results. No recommendation or advice is being given as to whether any investment is suitable for a particular investor. Any views or opinions expressed above may not reflect those of Seeking Alpha as a whole. Seeking Alpha is not a licensed securities dealer, broker or US investment adviser or investment bank. Our analysts are third party authors that include both professional investors and individual investors who may not be licensed or certified by any institute or regulatory body.

