Summary:
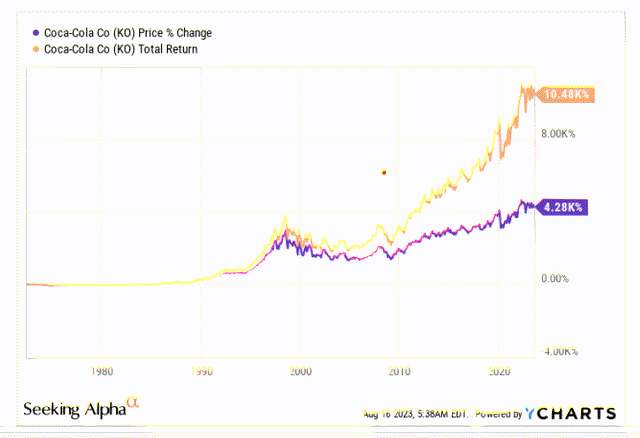
- Coca-Cola has been consistently distributing quarterly dividends for over six decades, resulting in a 2.44x variance between its total return and price return.
- As far as KO’s capital allocation priorities go, the dividend takes precedence over M&A and share buybacks.
- Compared to its largest peers, KO’s dividend profile comes across as fair.
- Despite some unfavorable cash developments, Coca-Cola is expected to generate ample free cash flow to cover its dividends this year.
- Given the degree of consistent operating leverage and expanding earnings growth on offer, the stock looks cheap.
Mark Dymchenko/iStock via Getty Images
Over the years, Coca-Cola’s stock (NYSE:KO) has been a boon for income-oriented investors; this is a company that has been distributing quarterly dividends relentlessly for over six decades, and that facet has been very instrumental in ensuring a 2.44x variance between the stock’s total return and price return over time.
Dividend Profile – Coca-Cola Versus Its Largest Peers
Rating KO’s dividend credentials would feel incomplete unless one juxtaposes some of those dividend sub-plots against other key options in this space. Thus, we’ve compared KO to the other top-4 largest (by market-cap) consumer staple stocks, namely Walmart (WMT), Procter & Gamble (PG), PepsiCo (PEP), and Costco Wholesale (COST). These stocks are gauged under four broad umbrellas-
Yields (Stocks with superior current yields, and a superior variance versus their respective 4-year yield averages garner higher scores)
Coverage (Stocks with superior dividend covers and bigger cash payouts receive higher scores)
Growth (Stocks that have grown their dividends by a larger percentage over the short, medium, and long-term receive higher scores)
Consistency (Stocks with a longer track record of paying and growing their dividends garner higher scores)
Where KO really comes out on top is the yield angle; at over 3%, KO’s offering is the best amongst the cohort, and almost a good 100bps better than its largest peers. Interestingly enough, KO’s current yield is bang in line with what you’d normally get (the 4-year average). Almost similar dynamics are seen with the likes of PG and PEP; whereas an entry in the likes of WMT and COST wouldn’t be too conducive at this point, considering how sub-par current yield looks relative to the historical average.
On the coverage front, KO’S trailing dividend cover isn’t the most dazzling (only PEP has a lower cover) but it’s worth bearing in mind that earnings can often be skewed by one-off items and non-cash charges. To assuage the foibles of the dividend cover, we’ve also looked at the cash dividend payout ratio which sheds some light on how much of free cash was distributed as cash dividends. On this front, KO has a fairly respectable figure of 65%, although it is nothing close to what PEP has done; issuing debt and paying out a dividend sum beyond normal free cash flow as dividends.
Another area where KO does very well is the longevity aspect of these dividends; it has been paying and growing its dividends for 61 years, something which only PG has managed to trump.
Finally, one also ought to consider at what pace KO has been growing its dividends across various time breaks within the last decade. Unfortunately, this is an area where it hasn’t been too generous, with its growth rates (be it over 3 years, 5 years or 10 years) all underperforming the peer set average.
All things considered, it’s fair to say that whilst KO may not necessarily have the most consummate dividend profile (that honor goes to its close peer- PEP), it still finishes a respectable third in the overall table.
Dividend Policy And Cash Flow Outlook
A lot of companies follow an arbitrary capital allocation policy which in turn is largely centered around the particular company’s performance in any particular year. With KO, things are a lot more clear-cut with the first priority going towards organic investments in the business, followed by the dividend; M&A priorities and share buyback plans only come up much later.
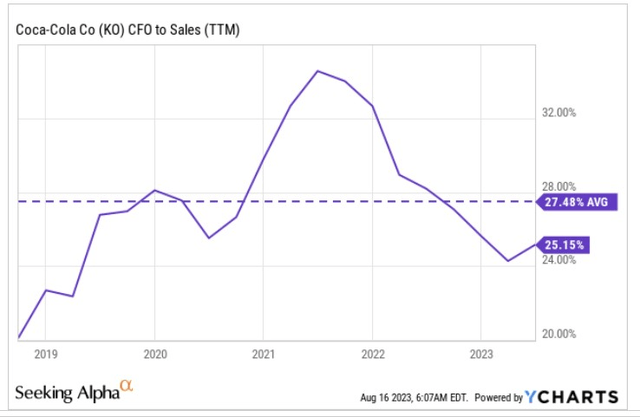
Thus, as a foundation, for KO to be generous with its dividends, it is going to have to convert a larger amount of sales to operating cash flow, followed by modest CAPEX allocations. On the Sales to CFO conversion, we can see that after a stellar post-pandemic improvement, things have eased off in recent periods dropping below the 5-year average. Since management has guided to CFO of $11.4bn for the year, and taking consensus revenue estimates of $45bn for the year, it looks like we won’t see a reversion to the sales to CFO mean of 27.5% by this year, but rather a continuation at around the 25% levels.
Management also noted that organic CAPEX commitments this year will step up quite a bit this year; after growing at only 12% p.a. on average for the last two years, this year’s CAPEX is poised to hit $1900m, implying YoY growth of 28%!
Company filings and transcripts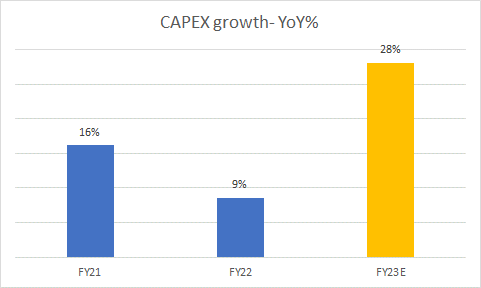
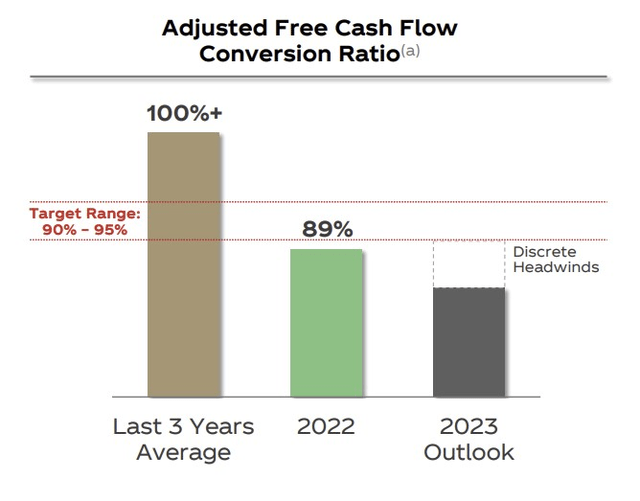
Besides that, management also expects a few cash headwinds related to transition tax payments and M&A transaction payments (aggregate impact of $700m) that could impact the usual FCF conversion (FCF as a function of adjusted net income) and bring it below the target range of 90-95%.
Despite all these unfavorable cash developments, investors should note that KO will still generate ample FCF to cover its dividends this year. A $0.46 quarterly dividend will likely translate to a dividend cash bill of $7.96bn (assuming a similar share outstanding figure at the end of H1-23). Yet KO looks poised to generate $9.5bn of FCF, providing a dividend coverage of 1.2x
Closing Thoughts – Valuation and Technical Considerations
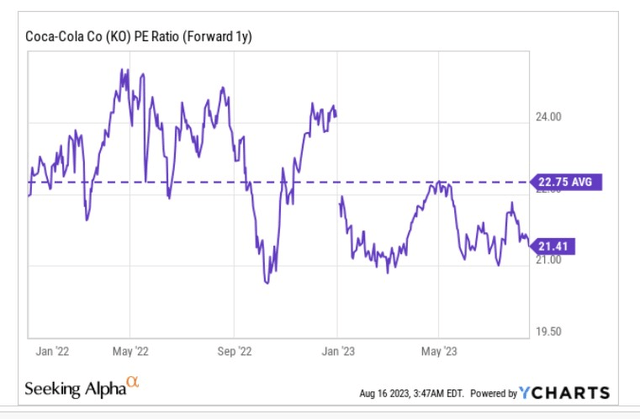
Notwithstanding the decent dividend theme, we also see merit in KO stock on account of the valuation and technical narratives. We recognize that some investors may be hesitant to shed out forward P/E multiples of over 20x for a boring, steady business such as Coke, but we’d urge you to consider two key facets that not all businesses can provide.
Firstly, this is a business that has the requisite levers (be it pricing actions, local sourcing, or supply chain synergies), to ensure you get a decent degree of operating leverage over time.
Coca-Cola Financial Strategy Page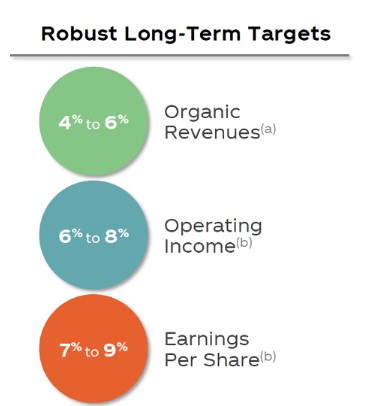
On a constant currency basis, EPS over time will likely grow at 1.6x the level of organic sales. To get a better idea, let’s consider the trajectory of consensus estimates of KO over the next three years.
YCharts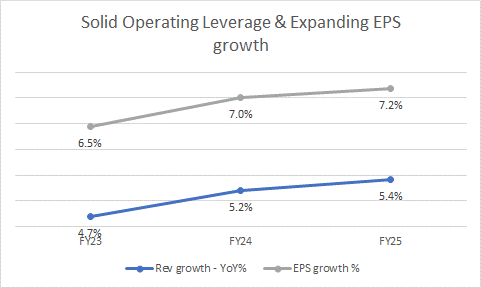
Basically, what we can glean is that, not only will KO deliver consistent solid operating leverage (with YoY EPS growth poised to exceed YoY revenue growth by 1.33-1.38x over the next three years), but the degree of earnings growth provided every year will only expand over time.
We think qualities of this sort, exhibited over a period of time deserve some degree of premium valuation. Also, crucially, even though KO is priced at over 21x (based on the FY24 EPS), it still represents a ~6% discount to the stock’s 5-year average multiple.
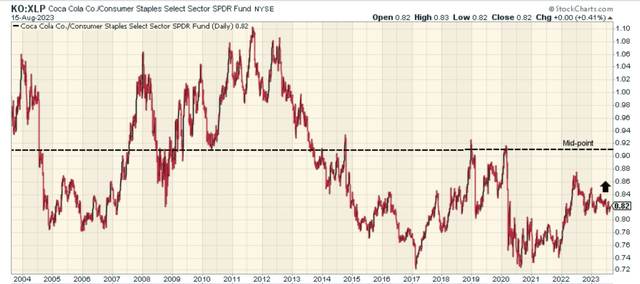
The chart below gives you a sense of how KO’s stock is positioned relative to other staple stocks in the S&P500. This can be useful in identifying rotational opportunities within the large-cap staple universe. What we can see is that the ratio is still around 10% off the mid-point of its long-term range, boosting the prospects of rotational interest in KO stock.
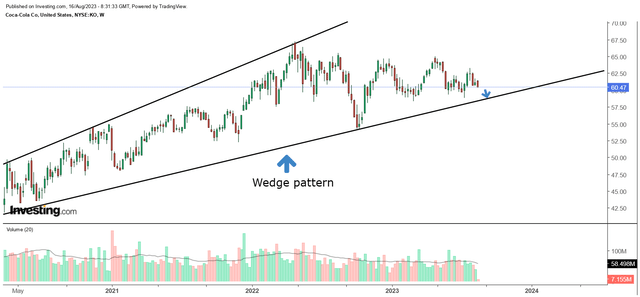
On KO’s standalone weekly chart, we can see that after hitting highs of $67, the price action appears to have flattened out, with the stock chopping along the sub $65 levels. Also note that since the pandemic lows in March 2020, the stock has been trending up in the shape of a wedge pattern. We think a pullback to the lower boundary of the wedge (currently at the $59 levels) would represent a suitable opportunity to get on board.
Analyst’s Disclosure: I/we have no stock, option or similar derivative position in any of the companies mentioned, and no plans to initiate any such positions within the next 72 hours. I wrote this article myself, and it expresses my own opinions. I am not receiving compensation for it (other than from Seeking Alpha). I have no business relationship with any company whose stock is mentioned in this article.
Seeking Alpha’s Disclosure: Past performance is no guarantee of future results. No recommendation or advice is being given as to whether any investment is suitable for a particular investor. Any views or opinions expressed above may not reflect those of Seeking Alpha as a whole. Seeking Alpha is not a licensed securities dealer, broker or US investment adviser or investment bank. Our analysts are third party authors that include both professional investors and individual investors who may not be licensed or certified by any institute or regulatory body.

