piranka
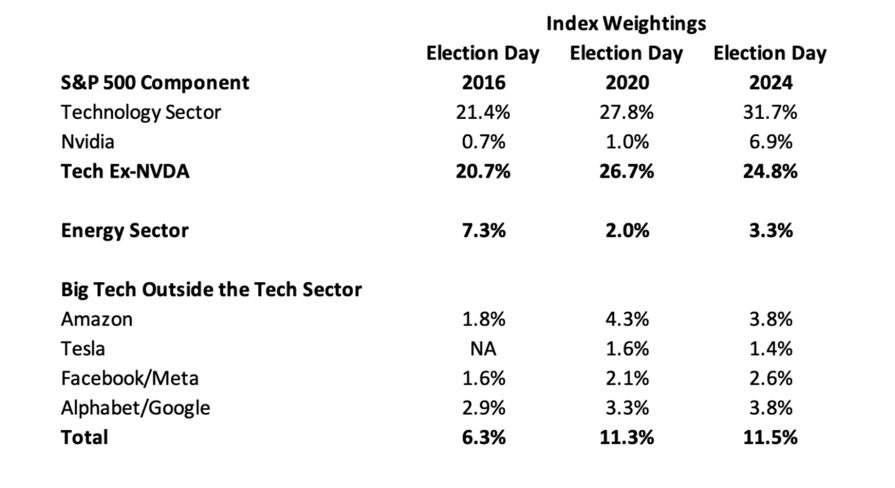
Technology (NYSEARCA:XLK) drives the S&P much more than it did in 2016 and 2020, according to a Morning Briefing report by DataTrek.
The broad technology sector (XLK), (IYW), (VGT) is now 43.2% of the S&P 500 (SP500). On election day in 2020, it was 39.1%, and in 2016 it was 27.7%.
Nvidia (NVDA), with 40.0x forward year earnings, is worth 6.2 percentage points of the broad tech sector’s gain of 15.5 percentage points from 2016 to 2024, or 40%.
Energy (XLE), which currently trades for 13.6x forward earnings, lost 4 points of index weighting since 2016, although it is up 1.3 points from 2020.

Credits to DataTrek.
Also, technology (XLK) has seen the largest increase in multiples at 28.4x today, up 7.3 points (or 35%) from their 10-year average of 21.1x.
“Perhaps, even more notable is that they are 3.5 points above their five-year average, which was an already healthy 24.9x,” wrote Nicholas Colas, DataTrek co-founder. “Common wisdom has, at various points, said that Tech sector (XLK) valuations would decline in the face of higher rates.”
“Not only has that proved wrong, but Tech in fact has seen the greatest multiple expansion of any S&P group relative to its longer-run average.”
The Technology Select Sector SPDR Fund ETF (XLK) is up today 1.41%, and up 17.88% year-to-date.
