Summary:
- The telecommunication services sector currently is the most attractive sector based on dividend yield Z-score.
- In particular, market sentiment has pushed the sector leader, AT&T, to absurdity.
- Its PE is about the same as its dividend yield (both around 6%).
- AT&T certainly faces restructuring uncertainties ahead.
- However, its recovery potential and wide margin of safety here offer outsized return projections even under conservative assumptions.
Ronald Martinez
Thesis
Readers familiar with our writing know about our market sector dashboard as shown below (available for download at this link Market Sector Dashboard). This is the first thing we look to get an overview of the market conditions. And as you can see now, currently, the telecommunication services sector (represented by XLC or VOX) is the most attractively valued sector on the basis of dividend yield Z-Score. Its dividend Z-score is a positive 0.98, indicating that its current yield is almost 1x whole sigma above its historical mean.
Of course, these sector funds are all indexed by market cap and therefore top heavy. And their valuation sometimes can be hugely biased by a few stocks that have disproportionate weightings in the index.
But you will see immediately in the next section that it is not the case here. I will examine AT&T (NYSE:T) closely together with a few of its peers in the telecommunication sector here. The main thesis is that the whole sector is quite attractive. And in particular, the extreme market sentiment has pushed the valuation of T to an absurdity.
Source: Author based on Seeking Alpha data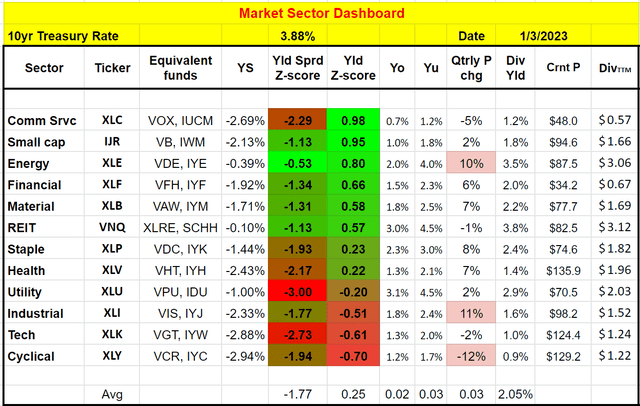
T’s absurdity
The way I see things, the current market sentiment is near its fear extreme toward the telecommunication sector as a whole, and especially toward T as seen in the chart below. T’s PE of 6.39x is so compressed that it is almost on par with its dividend yield (6.03% FW or 6.13% TTM).
To better contextualize the situation, the chart below also compares T against its two other sector leaders: Verizon (VZ) and Comcast Corporation (CMCSA). As you can see from this comparison, all three leaders are trading at extremely compressed valuations both in absolute terms and also relative to their historical track records. To wit, VZ’s current TTM dividend yield of 6.53% is above its 4-year average yield of 4.66% by almost 200 basis points (or a whole 40% in relative terms). CMCSA’s dividend yield of 3.03% is above its 4-year average yield of 2.08% by almost 100 basis points (or 46% in relative terms). Do not be misled by the fact that T’s current TTM yield is below its historical average (by about 10%). The reason is the WarnerMedia spinoff, and we will revisit this point in a later section.
Hence, as aforementioned, the attractive valuation of the telecommunication sector is not due to a few stocks. The overall sector is that has disproportionate weightings in the index. All the leading stocks in the sector are trading at attractive valuations.
Now, let’s examine T more closely. The T thesis definitely entails more uncertainties than VZ or CMCSA for a few good reasons. First, T has higher leverage than VZ and CMCSA. Although the use of a leverage-adjusted valuation metric shows very attractive valuations too. For example, its EV/EBITDA ratio currently sits at 5.79x, about a 43% discount from the sector average and about 22% discount from its own 5-year average.
Besides its higher leverage, T also faces some operational uncertainties after the WarnerMedia spinoff as I will detail next. However, my argument is that these uncertainties are overblown, offering a wide margin of safety here.
Source: author based on Seeking Alpha data.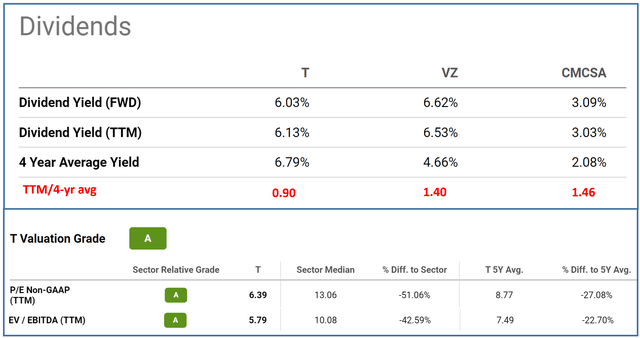
T’s Operation Challenges
Besides the debt issue, T also faces some restructuring and operation uncertainties ahead as it renormalizes its business after the WarnerMedia spinoff. These uncertainly are quite clearly illustrated by the data int eh the chart below. The implications of these data have been detailed in an early article and a few highlights are quoted here:
- The top panel shows the inventory on a quarterly basis in absolute dollar amounts. As seen, the inventory is at a peak level of $3.93B since Jan 2021. It is above its average of $3.43B by a large amount (about 17% in relative terms).
- In terms of the days of inventory outstanding on a quarterly basis (as shown in the bottom panel), the picture is even more concerning. Its inventory currently stands at 26.83 days, not only also at a peak level since Jan 2021, but also about 50% (45% to be more exact) above its average level of 18.46 days.
- Maintaining a large inventory is not only expensive but also invites balance sheet risks, especially considering the CAPEX required for its 5G and fiber capabilities.
Source: author based on Seeking Alpha data.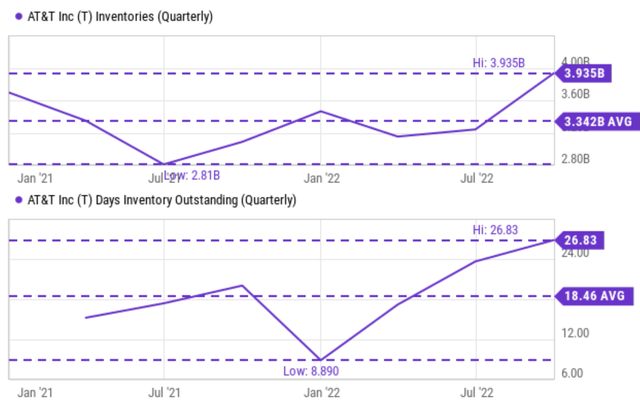
T’s return projections
The market has certainly taken note of the above challenges and is projecting an EPS decline next year: from $2.61 in 2022 to $2.57 in 2023. However, overall, the consensus estimates are forecasting a slow growth rate of 2.6% CAGR between 2022 and 2026 as seen.
Source: author based on Seeking Alpha data.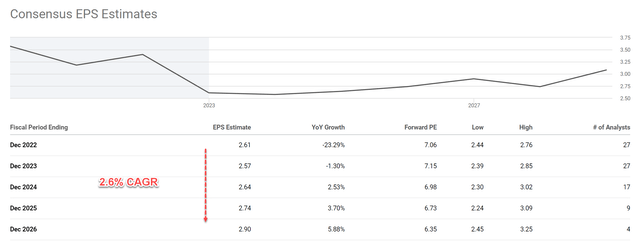
The 2.6% CAGR seems a bit pessimistic to me. T’s ROCE (return on capital employed) is about 30%. Assuming an average investment rate (“RR”) of 10%, the organic growth rate would be 3.0% (growth rate = ROCE * RR = 30% * 10%). Moreover, given the long-term pricing power that T has demonstrated, adding a 2% of inflation escalator would lead to a growth rate in the 5% range.
But even assuming a conservative 2.6% annual growth rate, the current valuation compression is so extreme that a large return can still be expected as shown in the chart below. As aforementioned, T is substantially undervalued both by PE and also EV/EBITDA.
The chart below also shows its valuation in terms of dividend yield and its price/cash flow ratio. As seen, the valuation discount is about 11% in terms of dividend yield compared to its historical average. Note that I have adjusted its historical average to 5.50%, instead of the 6.79% taken from SA earlier. The adjustment involved taking the dividend contributed from the Warner segment prior to the spinoff. In terms of price/cashflow ratio, its current ratio of 3.5x is discounted by 36% compared to its historical average of 5.5x.
With such sizable valuation discounts, a skewed return profile can be expected even with a conservative growth projection of 2.6%. As you can see from the chart below, for the next ~5 years, the total return is projected to be in a range of 10.8% to about 74%, translating into an annual return of 2.6% to 14.9%.
Source: author based on Seeking Alpha data.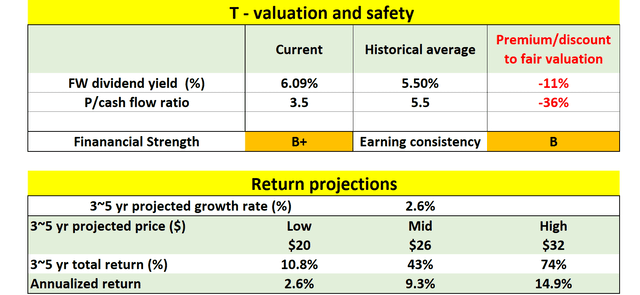
Final thoughts and risks
Besides the risks mentioned above (higher leverage and operation challenges relative to its peers like VZ and CMCSA), T has also suffered larger/larger price volatility. As you can see from the following chart, T’s beta has been about twice higher as VZ both in the past 24 months (0.51 vs 0.25) and also in the past 60 months (0.72 vs 0.36). Finally, T’s overall financial strength is also much weaker than both VZ and CMCSA as reflected in its much lower Altman Z-score. As seen, T’s Altman Z-score is at 0.91x, compared to VZ’s 1.29x and CMCSA’s 1.75.
All told, I see the current market sentiment nears its fear extreme toward T in a sector that is already deeply compressed. The sentiment is so negative that it is almost absurd: T’s PE is so compressed that it is almost on par with its dividend yield. Admittedly, an investment in T entails more uncertainties than VZ or CMCSA for good reasons such as leverage or operation uncertainties associated with the Warner Spinoff. However, the market has overreacted to these uncertainties in my view, creating an investment opportunity with a highly favorable return profile.
Disclosure: I/we have a beneficial long position in the shares of VZ either through stock ownership, options, or other derivatives. I wrote this article myself, and it expresses my own opinions. I am not receiving compensation for it (other than from Seeking Alpha). I have no business relationship with any company whose stock is mentioned in this article.
Join Envision Early Retirement to navigate such a turbulent market.
- Receive our best ideas, actionable and unambiguous, across multiple assets.
- Access our real-money portfolios, trade alerts, and transparent performance reporting.
- Use our proprietary allocation strategies to isolate and control risks.
We have helped our members beat S&P 500 with LOWER drawdowns despite the extreme volatilities in both the equity AND bond market.
Join for a 100% Risk-Free trial and see if our proven method can help you too. You do not need to pay for the costly lessons from the market itself.


