
Summary:
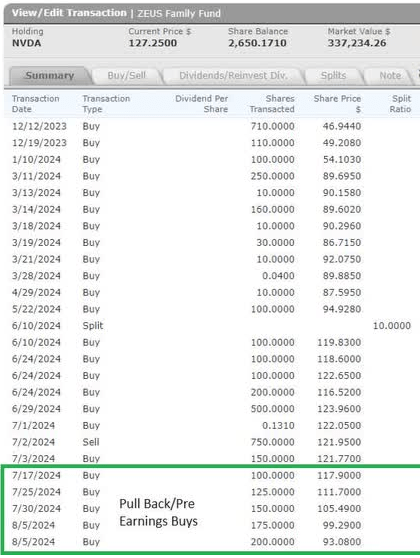
- NVDA was down as much as 35% in the recent market pullback. I was able to be greedy when others were fearful, acquiring 650 more shares.
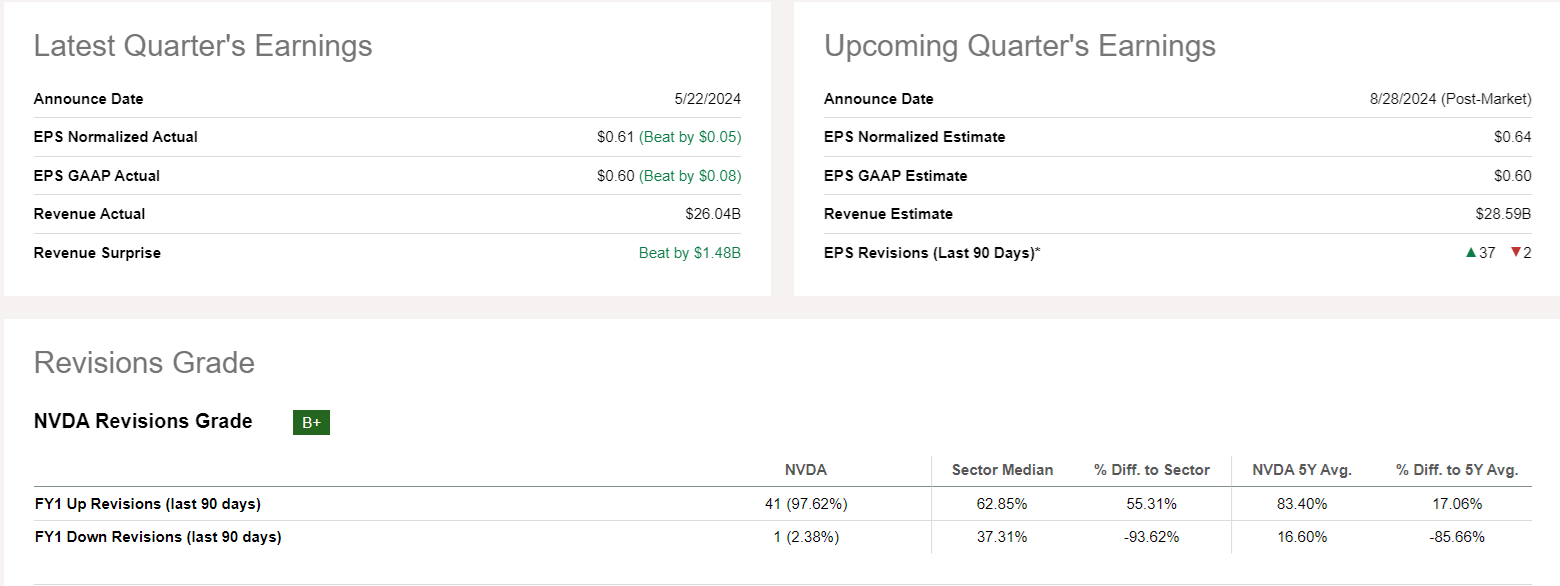
- NVDA is likely to beat and raise this earnings report by 15% to 20%, unveil a $30 to $50 billion buyback, and potentially raise the dividend again.
- Market options are pricing in an 8.7% single-day swing after earnings, and 5% to 15% is likely, given channel checks and 2024 fundamentals.
- Morgan Stanley and KeyBank expect over $225 billion in sales in 2025, and NVDA has the potential to beat FCF estimates by 50% next year.
- NVDA’s current estimates justify a 16% rally by year-end, 39% by the end of 2025, and potentially as much as 140% by the end of next year.
- The current consensus total return potential is 23% to 28% annually through 2029, about 300% total return potential, roughly 4X more than the S&P.

Deagreez
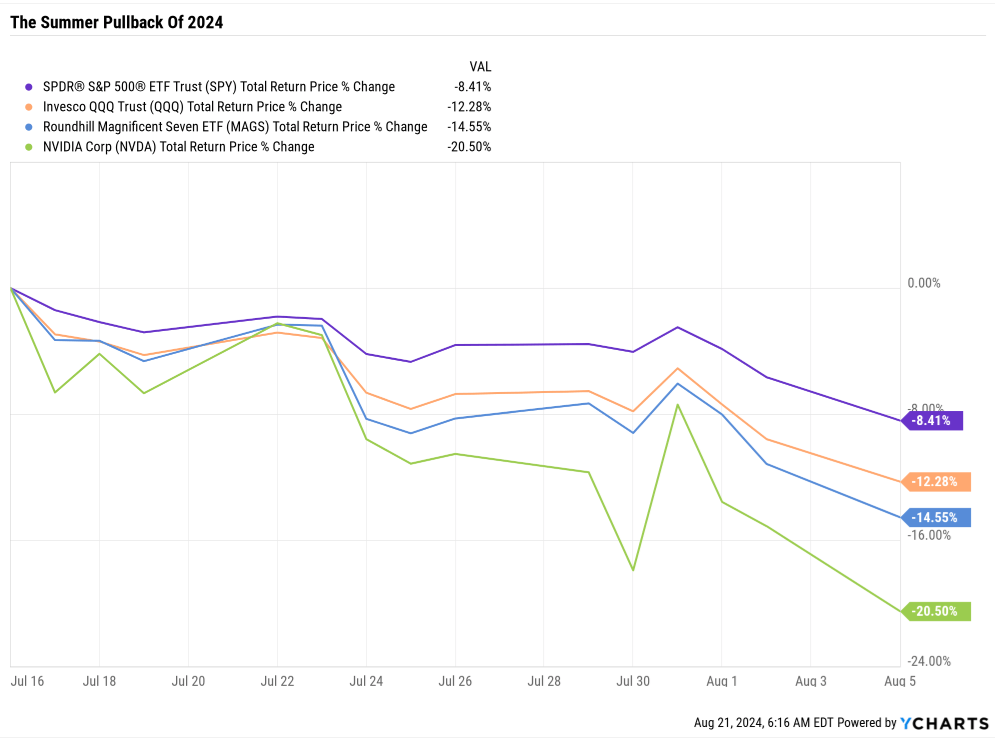
For Nvidia (NASDAQ:NVDA) investors, it’s been a volatile few weeks.
Ycharts
Ycharts
From its record high of $140, NVDA fell to an intraday low of $90 on Aug. 5, during the Yen Carry Trade unwind.
That’s a 35% peak decline in a matter of weeks.
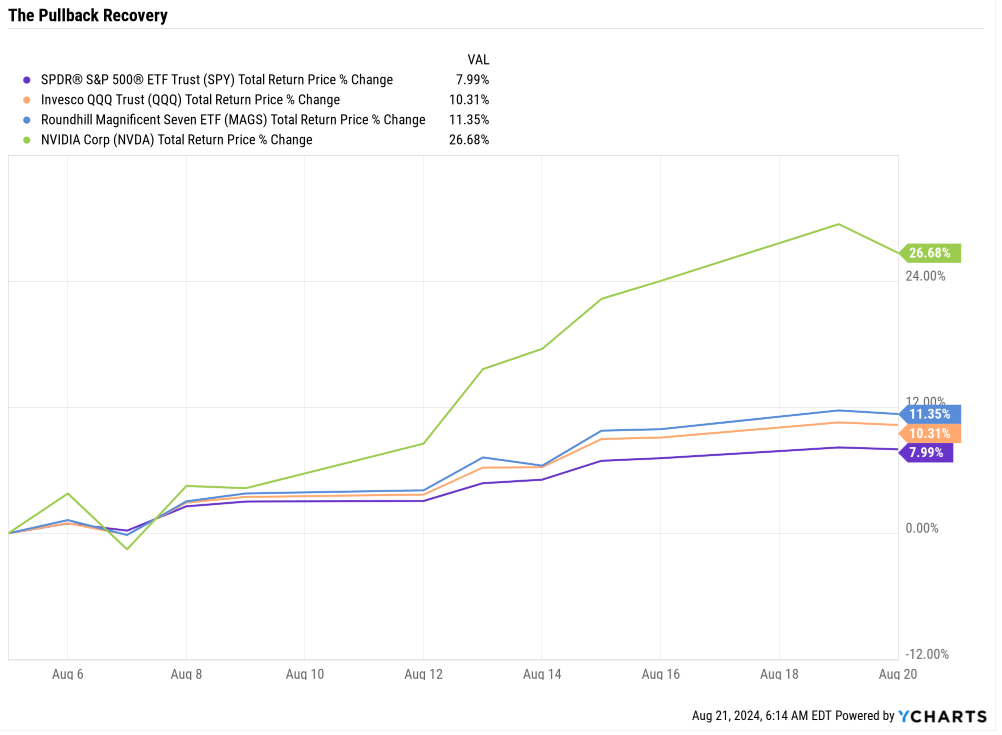
And then, from those lows, that panic-selling bottom NVDA soared 45% to $130 before pulling back a bit on Tuesday.
I Was “Greedy When Others Were Fearful” During The Recent Market Pullback
Morningstar
I use limit orders to keep the target allocation for each stock steady during corrections. Thanks to NVDA’s normal volatility, which fell 2.35X as much as the S&P in this pullback (and 3.5X peak intraday decline), I could buy 650 shares of NVDA going into earnings.
I didn’t nail the bottom, just over $90 on Aug. 5, but I got close.
Was I worried as these limits filled? Not at all because I was tracking NVDA’s fundamentals each day and could see that, despite the market panic triggered by hedge fund margin calls and algo trades, NVDA’s future was brighter than ever.
So let me share the three reasons I bought so much NVDA in recent weeks, going into earnings. More importantly, these three reasons explain why it’s still a potentially good idea for long-term dividend growth investors to buy NVDA even after its strong 40% recovery from its recent lows.
Reason 1: Big Beat And Raise Likely During Aug. 28 Earnings
Seeking Alpha
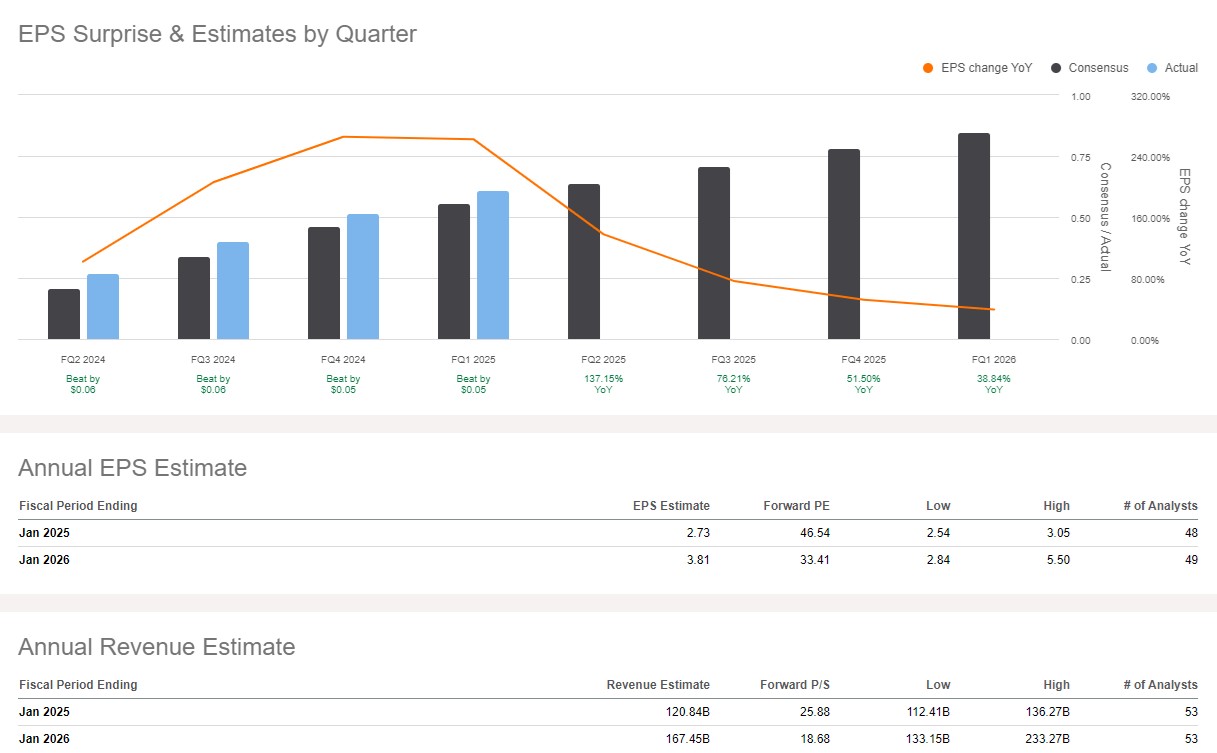
NVDA reports on Wed, Aug. 28, after the close.
As usual, earnings estimates have steadily risen by the week, with 37 upward revisions this quarter.
Seeking Alpha
Seeking Alpha
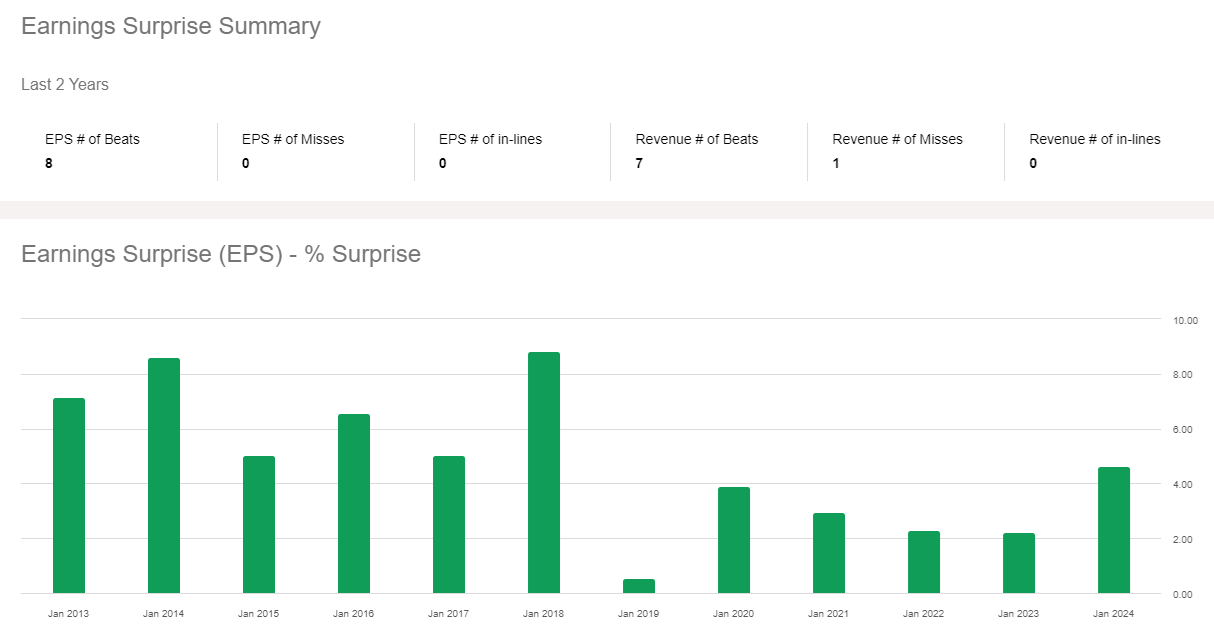
NVDA’s track record for beating earnings is perfect over the last two quarters since the company is supply constrained.
According to Bloomberg, the average sales beat and raise over the last six quarters is 12.5%.
Taiwan Semi (TSM) says it’s increasing wafer production by 150% in 2024 and 100% in 2025, but thinks that NVDA will remain supply constrained through the end of 2025.
Regarding its No. 1 supplier, TSM announced 45% sales growth courtesy of insatiable AI chip demand.
Goldman Sachs: Analysts at Goldman Sachs are confident that Nvidia will surpass Street consensus for revenue and earnings per share, driven by robust Data Center revenues and operational leverage. They maintain a “buy” recommendation, highlighting Nvidia’s competitive edge in AI and accelerated computing.
Jefferies: Analysts at Jefferies expect Nvidia to continue delivering earnings beats, although the magnitude of these surprises may be smaller than in previous quarters. They anticipate a strong earnings report for July, with guidance into October expected to exceed expectations by about $1 billion.
Wedbush Securities: Wedbush maintains confidence in Nvidia’s ability to report a strong quarter, citing robust AI spending as a critical driver. They expect Nvidia’s earnings to be bolstered by increased investment from significant customers in AI infrastructure.
Morningstar and Morgan Stanley estimate 15% to 17% sales beats and raises, and KeyBank is similarly bullish, especially for 2025.
All of the hyperscalers, the tech giants driving 50% of sales for NVDA right now, including Microsoft (MSFT), Alphabet (GOOG), Meta (META), and Amazon (AMZN), have announced they are increasing AI capex this year and next year.
That likely means that NVDA could sell 100% of production at full prices and record margins.
2025 Outlook Is Soaring
In terms of figures, Team Green is expected to ship 60,000 to 70,000 units of Nvidia’s GB200 AI servers, and given that one server is reported to cost around $2 million to $3 million per unit, this means that Team Green will bag in around a whopping $210 billion from just Blackwell servers along, that too in a year.” – Morgan Stanley
KeyBank has similar estimates of “at least $210 billion” in Blackwell sales alone in 2025.
Now that NVDA has announced a delay in Blackwell shipments (which were supposed to start shipping in Q4), 2024 Blackwell shipments may be pushed into 2025.
As I explained in my last pre-earnings update, NVDA’s potential sales in 2025, per TSMC’s supply ramp, is up to $265 billion.
KeyBank and Morgan Stanley now estimate $210-plus billion in Blackwell sales alone. Remember that Hopper isn’t going away; it will be a lower-cost option.
$265 billion is the maximum theoretical revenue that NVDA could achieve if TSM’s ramp is successful and they can sell 100% of capacity at full price.
Before the Blackwell delay announcement, Morgan and KeyBank estimated $210 billion in Blackwell sales, not including other chips, auxiliary hardware, or NIMS (software).
- Management is guiding for 110% annual software sales through 2030.
- To $60 billion in annual sales by 2030.
FactSet
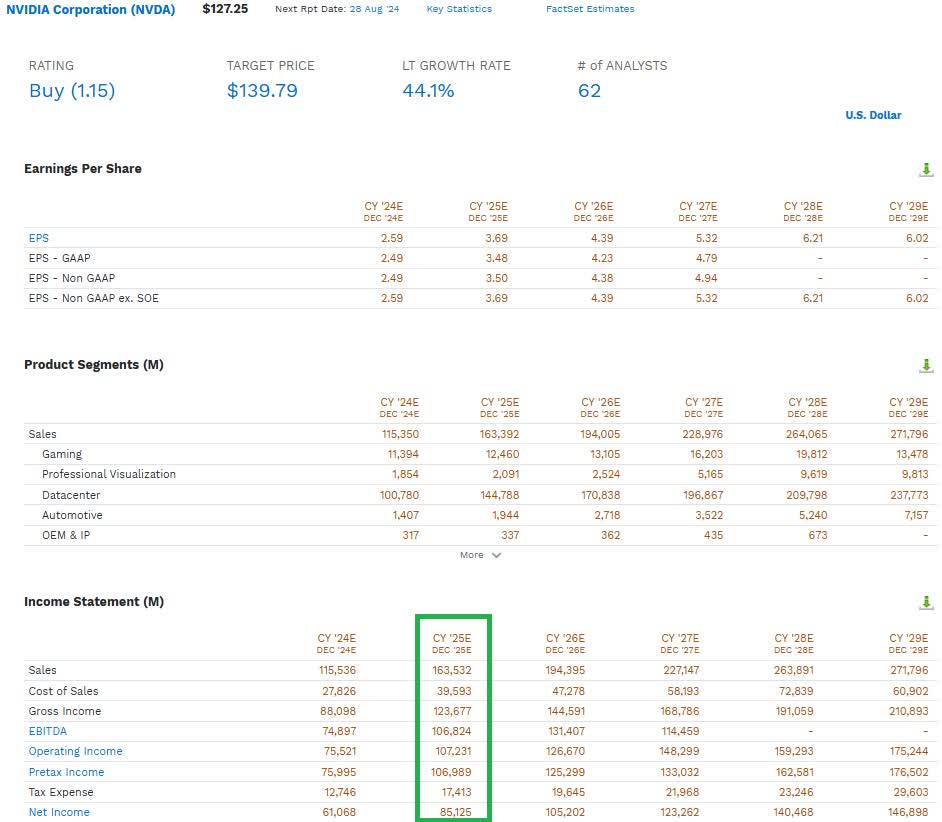
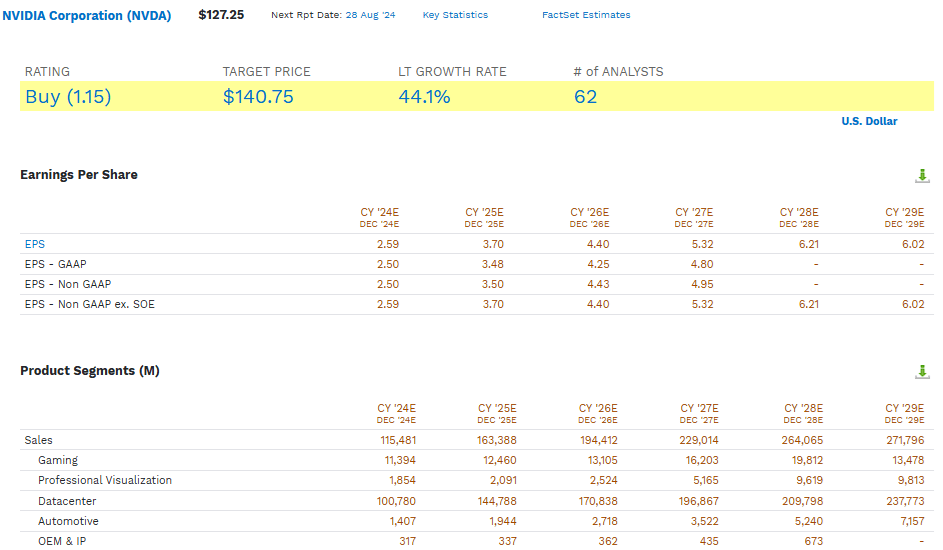
The current consensus is $164 billion in 2025 sales, up from $160 billion a few weeks ago and $150 billion at the start of the year.
NVDA can theoretically sell up to $265 billion next year, and Morgan Stanley and KeyBank expect around $230 billion.
What does that mean for potential free cash flow, beating expectations?
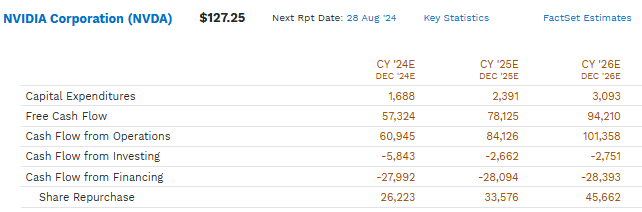
FactSet
Assuming stable 49% free cash flow margins (analysts expect this), potentially representing $65 to $70 billion in sales beat and $114 billion in free cash flow next year.
The current consensus is $78 billion, representing a 46% free cash flow beat next year. $114 billion in FCF would be 13% higher than the $101 billion in 2026 FCF analysts currently expect.
Nvidia Fair Value Profile
- Aug. 21: $132.83 (4.4% upside)
- Year-end 2024 (current consensus): $148.12 (16% upside)
- Year-end 2025 (current consensus): (39% upside)
- Mid 2025 (Morgan Stanley/KeyBank scenario): $250 to $275 (106% upside)
- Year-end 2026: $307.24 (Morgan Stanley/KeyBank scenario:) 141% upside
The current analyst base case is that NVDA will have almost 40% upside by the end of next year. If NVDA achieves the maximum growth numbers that Morgan Stanley and KeyBank expect, there is as much as 141% upside return potential, which is justified by fundamentals.
Goldman Sachs thinks AI will start to affect GDP growth in 2027 and corporate profits potentially in 2026.
In other words, 2024 and 2025 are about supply constraints, with hyper-scalers seemingly willing to buy 100% of NVDA capacity (as well as some AMD and INTC AI chips).
In 2026 and 2027, the years of Rubin and Rubin Ultra chip platforms, NVDA expects hyperscalers to be a minor part of its business as other companies and governments (sovereign AI) continue buying the best chips (for cost efficiency).
Reason 2: Long-Term Outlook Keeps Getting Stronger
FactSet
The median growth consensus for NVDA is 44.1%, up from 40% a few weeks ago and 33% three months ago.
Long-term EPS growth estimates range from 10% to 54%, with 44.1% being the median.
Here’s what that looks like in the medium term.
Nvidia Medium-Term Growth Consensus Forecast
| Year | Sales | Free Cash Flow | EBITDA | EBIT (Operating Income) | Net Income |
| 2023 | $58,039 | $25,051 | $33,240 | $34,748 | $27,603 |
| 2024 | $115,536 | $57,624 | $74,897 | $75,564 | $61,025 |
| 2025 | $163,532 | $78,290 | $106,824 | $107,248 | $85,132 |
| 2026 | $194,395 | $94,500 | $131,407 | $126,724 | $105,058 |
| 2027 | $227,147 | $114,526 | NA | $147,514 | $121,372 |
| 2028 | $263,891 | NA | NA | $159,219 | $140,294 |
| 2029 | $271,796 | NA | NA | $175,244 | $146,898 |
| Annualized Growth 2024-2029 | 29.3% | 46.2% | 58.1% | 31.0% | 32.1% |
| Cumulative 2024-2029 | $1,236,297 | $344,940 | $313,128 | $791,513 | $659,779 |
(Source: FactSet)
Free cash flow is growing at almost 50% per year.
And remember, this is the current consensus. If NVDA achieves $114 billion in FCF next year, as Morgan Stanley thinks is possible, then NVDA will have achieved 2027 results in 2025.
- NVDA is currently pricing in -2 or -3 years of potential growth if it achieves what Morgan Stanley and KeyBank do next year.
Nvidia Margin Consensus Forecast
| Year | FCF Margin | EBITDA Margin | EBIT (Operating) Margin | Net Margin |
| 2023 | 43.2% | 57.3% | 59.9% | 47.6% |
| 2024 | 49.9% | 64.8% | 65.4% | 52.8% |
| 2025 | 47.9% | 65.3% | 65.6% | 52.1% |
| 2026 | 48.6% | 67.6% | 65.2% | 54.0% |
| 2027 | 50.4% | NA | 64.9% | 53.4% |
| 2028 | NA | NA | 60.3% | 53.2% |
| 2029 | NA | NA | 64.5% | 54.0% |
| Annualized Growth | 4.0% | 5.7% | 1.2% | 2.2% |
(Source: FactSet)
“Nvidia’s margins can’t possibly be maintained for long.”
Not according to the median consensus of 62 analysts who cover it for a living and have access to channel checks and data that YouTube prognosticators can’t even dream of.
Why is that plausible? Because Nvidia’s value proposition to customers is long-term overall operating costs.
Microsoft is one of the largest GPUs, AI, and cloud computing infrastructure buyers.
Do you think MSFT minds paying $35K to $40K for the world’s most advanced AI chips if it means that long-term operating costs per token are 50% to 75% lower than what cheaper but less advanced chips can achieve?
The world’s wealthiest companies can easily afford to take the long-term view, and Nvidia is guiding for at least 50% reductions in cost/token computing costs each year after 2025.
In other words, NVDA is already the low-cost leader in long-term AI operating costs. For example, Blackwell is 4X better at training and 30X at inference (operating AI models) than Hopper.
Hopper replaced the Ampere generation of AI chips and was 9X better at training and 30X better at inference than Ampere.
In other words, between the A100 chips and B200 chips, NVDA has improved training capacity by 36X and inference by 900X.
And here’s why that matters. Most companies don’t need to do 900X faster inferencing. At some point, speed isn’t as important as energy and cost.
For a company like MSFT or OpenAI, it might be optimal to try to have the best LMM, such as Project Stargate (a 10 million GPU model in 2028 costing over $100 billion), 1 million times faster for the same cost and energy.
Today’s AI inference speed might be fine for others but at 1 million times lower cost (per token).
For some countries, the goal might be to achieve 1 million times lower energy (and cost) with the same speed as today.
Or, for most companies, 1000X faster AI computing for 1000X lower cost (and 1000X lower energy usage) might be the ideal sweet spot.
Ycharts
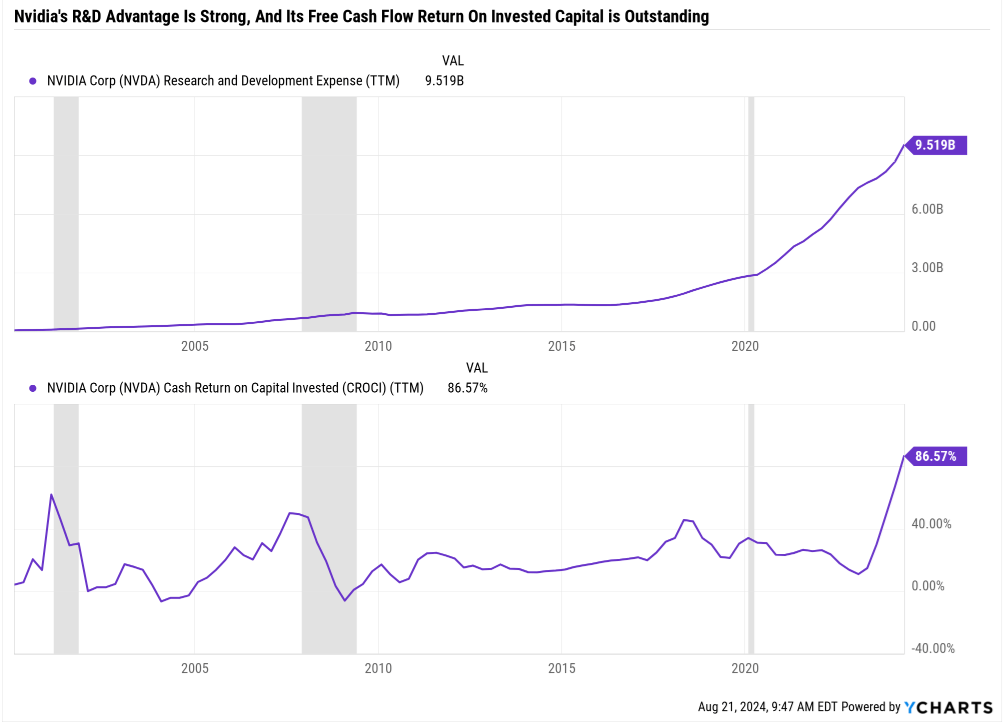
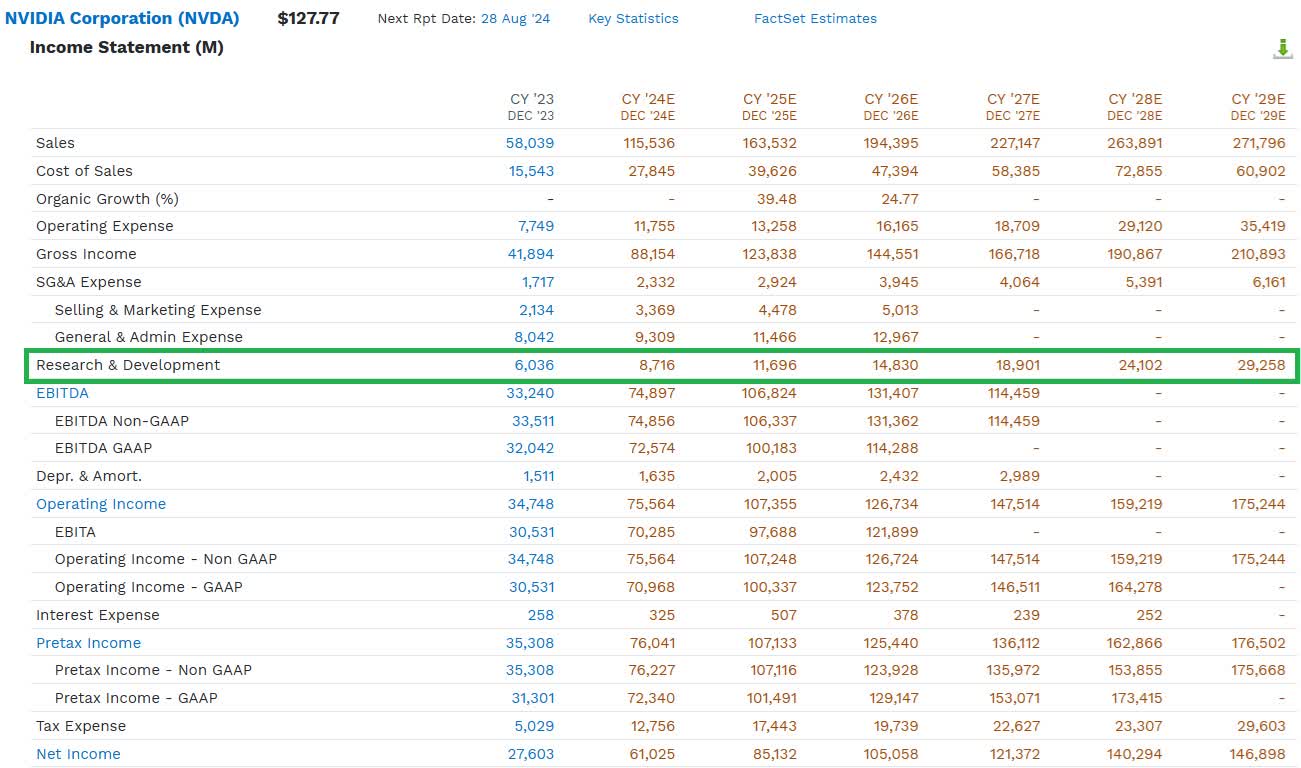
NVDA spends $10 billion annually on R&D, and that is expected to continue growing.
FactSet
NVDA’s R&D spending is expected to triple to $30 billion in 2029. The company’s historical median 20% to 25% free cash flow return on invested capital means its growth spending is highly efficient.
In the last year, the free cash flow return on invested capital reached 87%. That isn’t sustainable, but for now, the more Nvidia spends, the faster it grows.
The more you buy the more you save.” – Jensen Huang’s sales pitch at keynotes
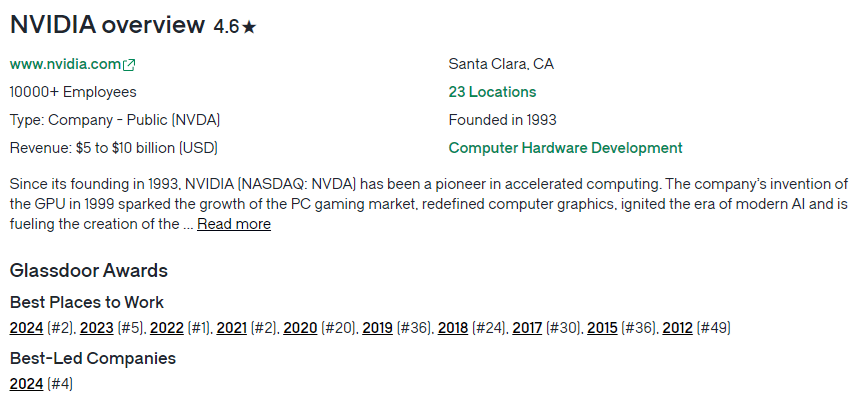
Glassdoor
Since 2022, NVDA has been rated among the top five companies to work for, and its workers consider Jensen Huang the fourth-best CEO.
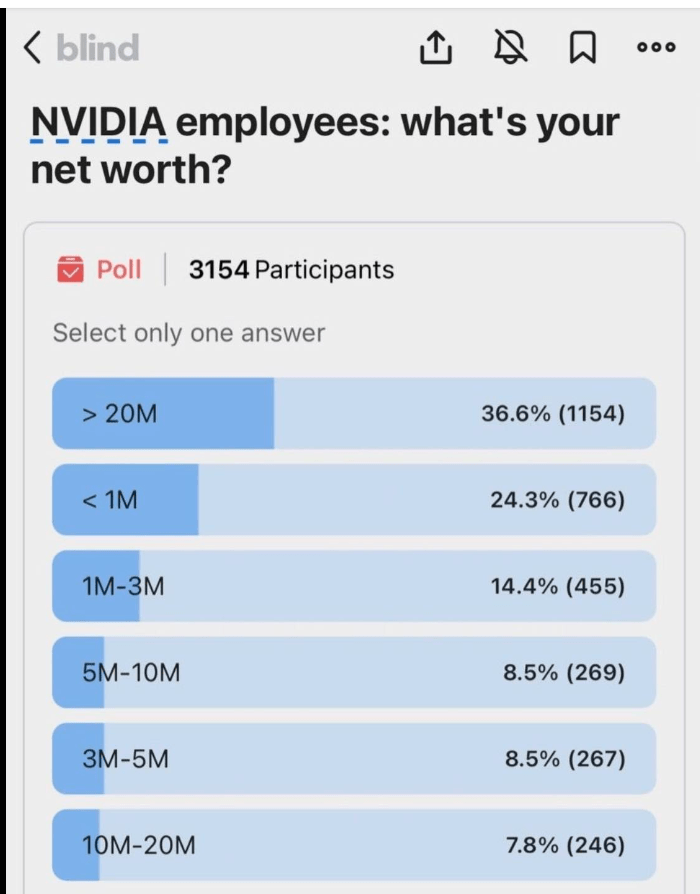
Blind
76% of NVDA employees are millionaires.
If you’re a world-class AI computer engineer, do you want to work for Intel? Or a thriving industry leader whose CEO is hailed as a genius?
Happy, productive employees who are getting richer than they ever dreamed of are another reason to ride strong with Jensen Huang.
Jensen Huang Owns 3.5% Of NVDA And Is The 12th Richest Person On Earth.
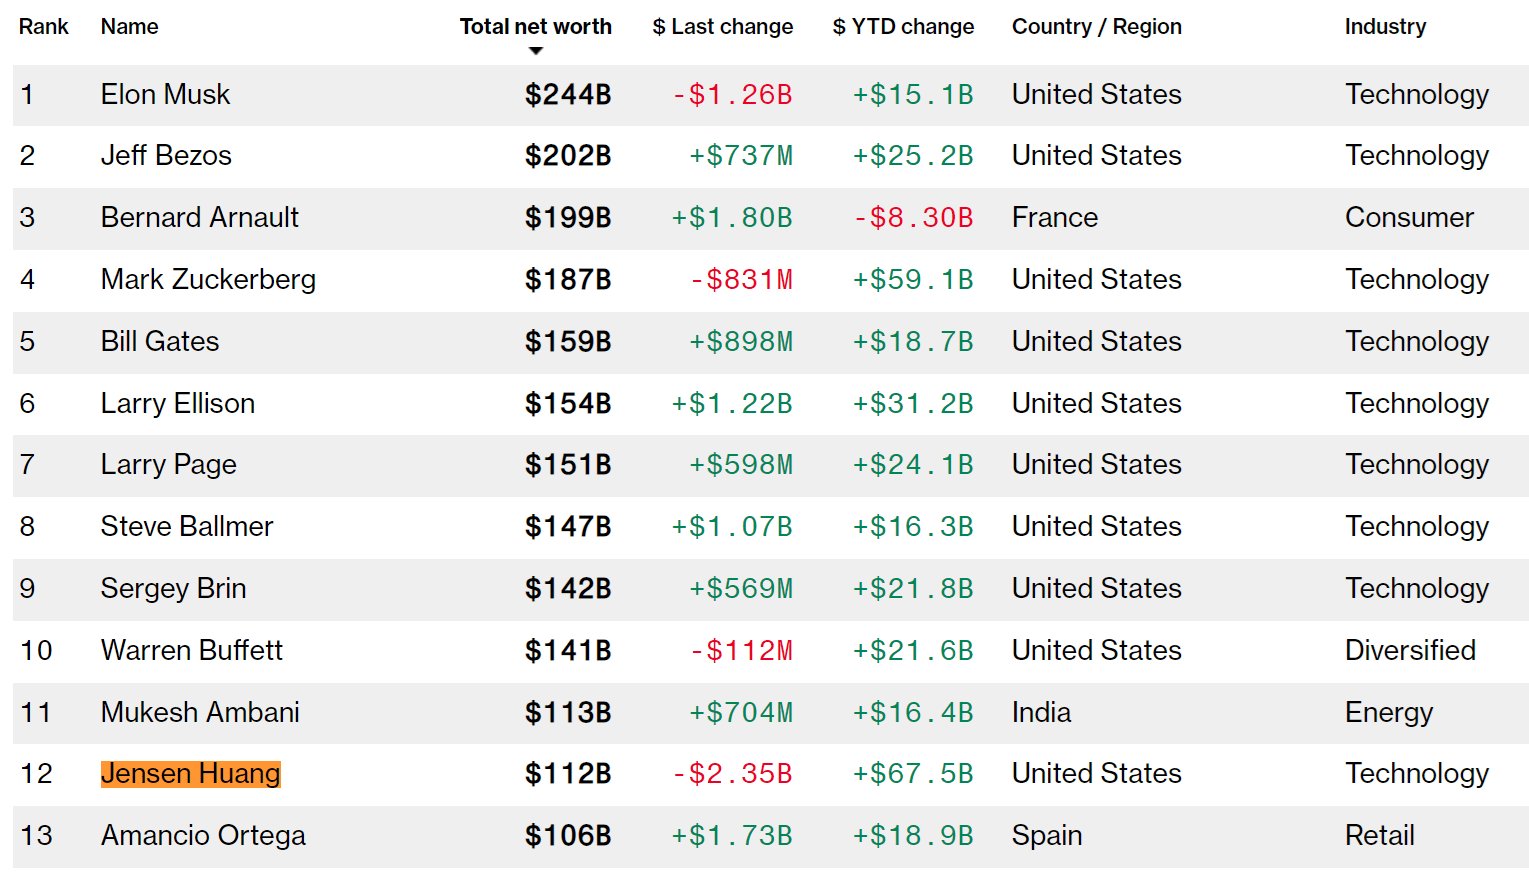
Bloomberg
Jensen Huang has been CEO for 30 years (he co-founded the company). He says he plans to remain CEO for 30 to 40 more years.
If he can keep his finger on the pulse of future tech as well as he has for the last 30 years, Huang would be a potential Buffett of tech.
Nvidia Is A Dividend Growth Dream Stock
| Metric | Nvidia | S&P | Nasdaq |
| Total Income | $4,097.79 | $925.85 | $447.31 |
| Inflation-Adjusted Income | $2,145.44 | $484.74 | $234.19 |
| Starting Yield | 0.00% | 1.18% | 0% |
| Yield On Cost | 89.2% | 8.2% | 5.96% |
| Inflation-Adjusted Yield On Cost | 46.68% | 4.28% | 3.12% |
| Annual Income Growth | 22.5% | 8.5% | 30.6% |
(Source: Portfolio Visualizer)
NVDA didn’t start paying a dividend until 2012. And the dividend was low and frozen for years. Yet, NVDA has delivered 4X as much inflation-adjusted income as the S&P and almost 10X more than the Nasdaq.
Income investors who have owned NVDA since the beginning now see an inflation-adjusted 47% yield on cost. Analysts say every $1000 invested at the IPO now pays $470 yearly in dividends, likely to grow 40% to 50% annually.
Reason 3: A Wonderful Company At A Reasonable Price
No one denies that Nvidia is an amazingly innovative or fast-growing company.
The major concern many investors have is whether it’s overvalued.
FactSet
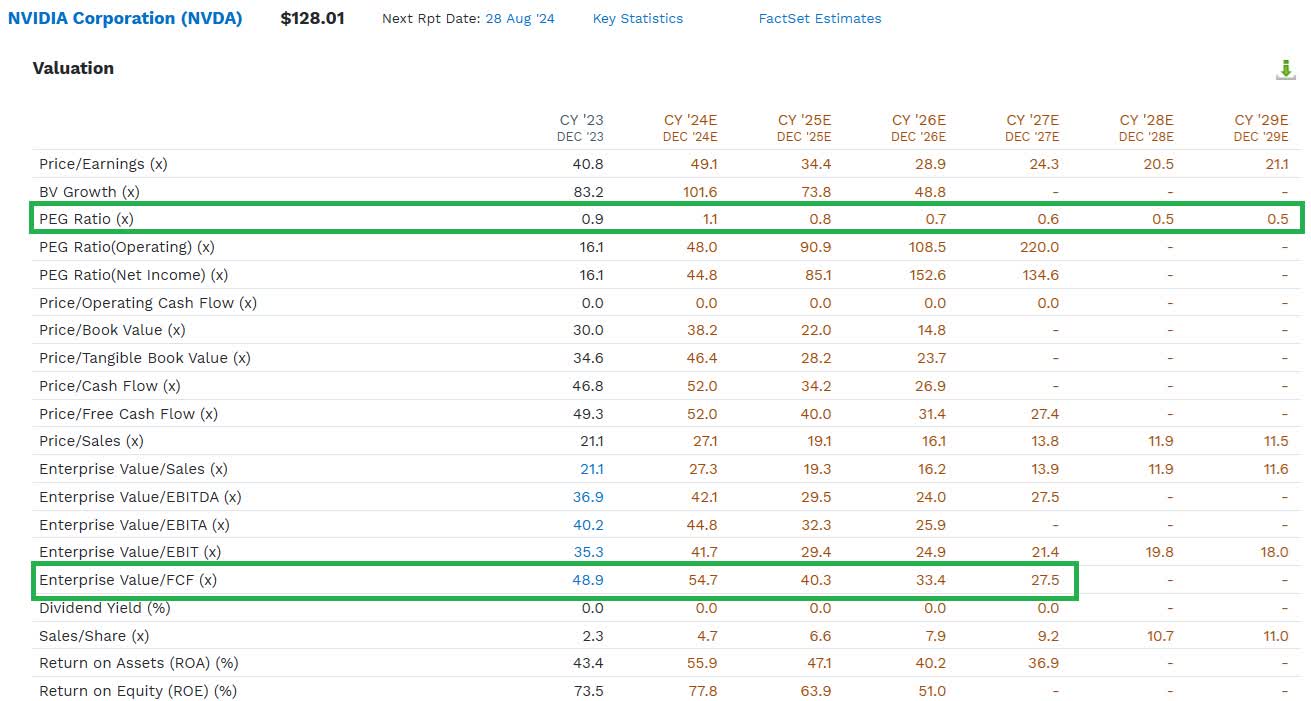
NVDA is trading at 38.87X forward earnings.
Its free cash flow yield (EV/FCF) is 40.3X next year’s estimates, representing a forward cash-adjusted PEG ratio of 0.91. Its current PEG ratio, which is measured the traditional way, is 0.95.
So Peter Lynch would say that as long as NVDA keeps growing as expected, it will grow at a reasonable price.
Nvidia Objective Market Determined Fair Value Profile
| Time Frame (Years) | Average PE | Average P/FCF | Annual EPS Growth | Annual FCF Growth | EPS PEG | FCF PEG |
| 20 | 35.71 | 34.94 | 34.25 | 32.78 | 1.04 | 1.07 |
| 19 | 34.82 | 34.94 | 34.34 | 36.19 | 1.01 | 0.97 |
| 18 | 34.5 | 33.23 | 28.44 | 26.08 | 1.21 | 1.27 |
| 17 | 35.02 | 33.95 | 26.14 | 26.93 | 1.34 | 1.26 |
| 16 | 35.99 | 34.44 | 25.55 | 22.06 | 1.41 | 1.56 |
| 15 | 37.27 | 36.03 | 42.91 | 39.79 | 0.87 | 0.91 |
| 14 | 37.65 | 36.03 | 45.98 | 33.66 | 0.82 | 1.07 |
| 13 | 35.91 | 37.31 | 40.05 | 33.82 | 0.90 | 1.10 |
| 12 | 35.83 | 38.49 | 39.68 | 34.38 | 0.90 | 1.12 |
| 11 | 37.84 | 41.14 | 44.57 | 40.55 | 0.85 | 1.01 |
| 10 | 40.14 | 44.18 | 52.96 | 46.15 | 0.76 | 0.96 |
| 9 | 42.5 | 47.69 | 53.13 | 46.54 | 0.80 | 1.02 |
| 8 | 45.48 | 52.31 | 62.24 | 47.7 | 0.73 | 1.10 |
| 7 | 48.54 | 56.27 | 53.62 | 52.08 | 0.91 | 1.08 |
| 6 | 49.75 | 58.05 | 49.7 | 45.33 | 1.00 | 1.28 |
| 5 | 48.85 | 59.21 | 50.89 | 53.85 | 0.96 | 1.10 |
| 4 | 51.53 | 67.54 | 72.98 | 58.24 | 0.71 | 1.16 |
| 3 | 53.27 | 82.81 | 73.13 | 79.72 | 0.73 | 1.04 |
| 2 | 53.71 | 87.25 | 70.91 | 83.85 | 0.76 | 1.04 |
| 1 | 52.98 | 92.71 | 288.38 | 614.24 | 0.18 | 0.15 |
| Average | 42.3645 | 50.426 | 59.4925 | 72.697 | 0.89 | 1.06 |
| Median | 38.99 | 42.66 | 47.84 | 42.94 | 0.88 | 1.08 |
| 2030 FCF Consensus | $154,421.06 | Current Market Cap | $2,420,000.00 | 2029 Fair Value |
Annualized Return Potential |
|
| Free Cash Flow Fair Value (Median) | $6,587,602.59 | Increase In Value (Median) | 172.21% | $350.09 | 22.25% | |
| Free Cash Flow Fair Value (Average) | $7,786,836.57 | Increase In Value (Average) | 221.77% | $412.86 | 26.35% |
(Source: FactSet)
A PEG of 1 is what NVDA has historically traded at for the last 20 years. That’s not opinion. It’s objective market fact. So, if NVDA trades at a PEG of 1, it’s objectively not overvalued.
The first 2030 sales estimates are $307 billion, or 17.8% annualized from 2024 to 2030.
That means a historical fair value of $6.6 trillion to $7.8 trillion or 172% to 222% consensus fundamentally justified fair value by the end of 2029.
That would translate into 22% to 27% annualized returns for the next 5.5 years.
Remember, these are the current consensus estimates, which rise with each quarterly beat and raise.
Risks To Consider: Why Nvidia Isn’t Right For Everyone
Options markets are currently pricing in an 8.7% single-day swing post earnings.
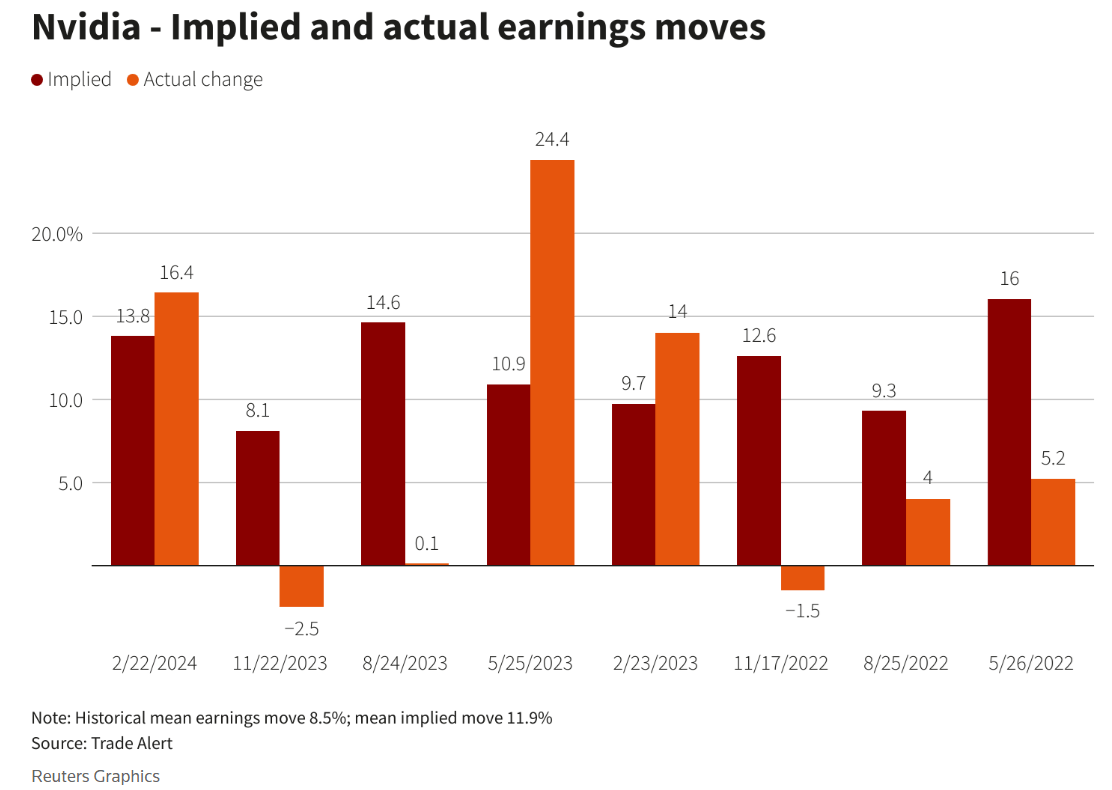
Reuters
But that doesn’t mean NVDA will go up or down 9%. I expect a 5% to 15% pop, but up to a 25% upward move might occur if NVDA pulls off a big enough beat and raise.
NVDA’s epic gains have been justified by record fundamental growth.
And the bear markets this year, which have been 25% and 35%, respectively, have not been justified by fundamentals.
It’s easy to be “greedy when others are fearful” when all the fundamentals are strong. But what happens when NVDA’s earnings decline?
| Years | EPS Growth | Peak Decline |
| 2009 | -82% | -78.9% |
| 2013 to 2014 | -22% | -22.1% |
| 2020 | -13% | -30.0% |
| 2023 | -25% | -62.8% |
| Average | -36% | -48.4% |
| Median | -24% | -46.4% |
(Source: Portfolio Visualizer, FAST Graphs, FactSet)
In the last 15 years, NVDA’s median EPS decline has resulted in a 24% earnings recession.
The market’s median reaction is a nearly 50% sell-off.
If smaller language models prove as effective as LMMs or specialized chips better than GPUs, it could disrupt NVDA’s current AI lead.
New types of chips are indeed being developed to outperform traditional GPUs specifically for AI tasks. These include specialized AI chips, such as Application-Specific Integrated Circuits (ASICs) and Tensor Processing Units (TPUs), designed to handle AI workloads more efficiently than general-purpose GPUs.
ASICs: These are custom-designed chips optimized for specific applications, including AI. They offer higher efficiency and performance for particular tasks compared to general-purpose GPUs. For example, Google’s TPU is an ASIC designed to accelerate machine learning workloads.
TPUs: Developed by Google, TPUs are specifically designed to accelerate machine learning tasks. They are optimized for TensorFlow, Google’s machine learning framework, and provide significant performance improvements for AI applications.
FPGAs: Field-Programmable Gate Arrays are another type of AI chip that can be configured for specific tasks. They offer flexibility and can be optimized for various AI workloads, although they may not always match the raw performance of ASICs or TPUs.
These specialized AI chips are designed to handle the massive parallel processing required for AI tasks more efficiently than GPUs. They achieve this by optimizing for lower precision arithmetic, which reduces the number of transistors needed and, thus, the energy consumption while maintaining the necessary performance for AI algorithms. This makes them particularly suitable for applications like large language models, edge AI, and autonomous vehicles, where efficiency and speed are critical.
NVDA must maintain its lead in AI tech. If it loses the ability to offer the lowest long-term cost option, then the bullish thesis will be thrown out the window.
Portfolio Visualizer
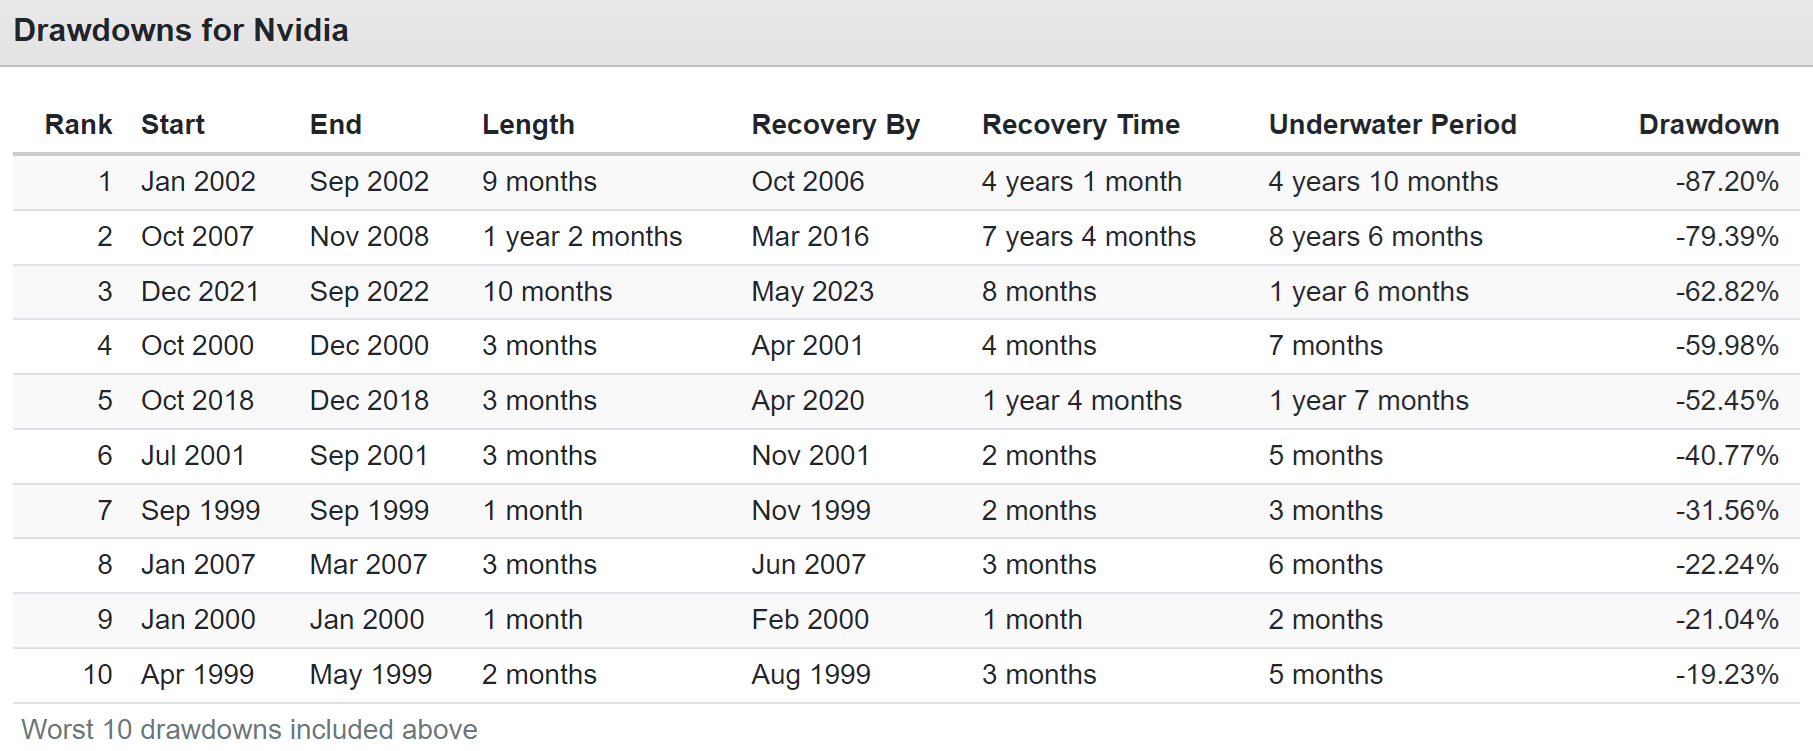
Here are the largest ten bear markets for NVDA.
And here’s how volatile this hyper-volatility, hyper-growth blue chip is.
10% Worst Monthly Returns
| Nvidia | Nasdaq | S&P 500 | ||
| Year | Month | Return | Return | Return |
| 2002 | 6 | -48.66% | -13.12% | -7.38% |
| 2008 | 7 | -38.89% | 0.64% | -0.90% |
| 2002 | 7 | -35.56% | -8.62% | -7.88% |
| 2001 | 9 | -35.14% | -20.88% | -8.16% |
| 2000 | 11 | -34.83% | -22.91% | -7.47% |
| 2002 | 12 | -32.81% | -12.09% | -5.66% |
| 2022 | 4 | -32.03% | -13.60% | -8.78% |
| 1999 | 9 | -31.56% | 0.84% | -2.24% |
| 2008 | 1 | -27.72% | -11.89% | -6.05% |
| 2019 | 5 | -25.07% | -8.23% | -6.38% |
| 2018 | 10 | -24.98% | -8.60% | -6.91% |
| 2004 | 7 | -24.67% | -7.55% | -3.22% |
| 2008 | 6 | -24.21% | -9.61% | -8.35% |
| 2000 | 10 | -24.10% | -7.94% | -0.47% |
| 2002 | 2 | -22.41% | -12.28% | -1.79% |
| 2018 | 11 | -22.40% | -0.26% | 1.85% |
| 2010 | 6 | -22.30% | -5.98% | -5.17% |
| 2004 | 4 | -22.27% | -2.99% | -1.89% |
| 2002 | 4 | -21.53% | -12.01% | -5.82% |
| 2006 | 5 | -21.36% | -7.24% | -3.01% |
| 2000 | 1 | -21.04% | -1.85% | -4.94% |
| 2011 | 6 | -20.46% | -2.02% | -1.69% |
| 2009 | 10 | -20.43% | -3.05% | -1.92% |
| 2022 | 9 | -19.55% | -10.54% | -9.24% |
| 2004 | 8 | -19.20% | -2.49% | 0.24% |
| 2000 | 12 | -19.10% | -7.32% | -0.52% |
| 2022 | 6 | -18.80% | -8.91% | -8.25% |
| 2011 | 3 | -18.53% | -0.45% | 0.01% |
| 2018 | 12 | -18.31% | -8.65% | -8.79% |
| 2008 | 10 | -18.21% | -15.47% | -16.52% |
| 2005 | 3 | -18.04% | -1.75% | -1.83% |
| Average | -25.30% | -7.96% | -4.81% | |
| Median | -22.40% | -8.23% | -5.17% |
(Source: Portfolio Visualizer)
In the last 25 years, NVDA has had 24 20%-plus monthly declines. It’s fallen by almost 50% in a single month.
It’s fallen as much as 40% in a month while the S&P and Nasdaq were flat!
If you can’t tolerate such volatility and harness it to buy more when sentiment is at its worst, you will miss out on gains like these.
10% Best Monthly Returns
| Nvidia | Nasdaq | S&P 500 | ||
| Year | Month | Return | Return | Return |
| 2003 | 5 | 82.62% | 8.52% | 5.48% |
| 2000 | 2 | 72.68% | 19.02% | -1.57% |
| 2001 | 1 | 57.56% | 10.15% | 4.45% |
| 1999 | 11 | 56.50% | 11.79% | 1.74% |
| 2001 | 10 | 56.02% | 16.98% | 1.30% |
| 2011 | 1 | 55.32% | 2.83% | 2.33% |
| 2001 | 3 | 45.28% | -17.49% | -5.60% |
| 2002 | 11 | 43.95% | 12.91% | 6.17% |
| 2009 | 12 | 43.03% | 5.20% | 1.91% |
| 1999 | 8 | 39.75% | 5.47% | -0.52% |
| 2002 | 10 | 39.02% | 18.48% | 8.23% |
| 2017 | 5 | 38.54% | 3.90% | 1.41% |
| 2023 | 5 | 36.34% | 7.88% | 0.46% |
| 1999 | 12 | 35.56% | 24.32% | 5.63% |
| 2023 | 1 | 33.69% | 10.64% | 6.29% |
| 2000 | 8 | 32.29% | 13.63% | 6.60% |
| 2004 | 11 | 32.20% | 6.02% | 4.45% |
| 2000 | 3 | 32.01% | 2.58% | 9.69% |
| 2016 | 5 | 31.83% | 4.37% | 1.70% |
| 2006 | 8 | 31.48% | 4.77% | 2.18% |
| 2016 | 11 | 29.76% | 0.44% | 3.68% |
| 2024 | 2 | 28.58% | 5.28% | 5.22% |
| 2001 | 4 | 28.31% | 17.88% | 7.04% |
| 2000 | 5 | 28.05% | -12.27% | -1.57% |
| 2021 | 11 | 27.81% | 2.00% | -0.80% |
| 2001 | 11 | 27.48% | 16.96% | 7.80% |
| 2018 | 1 | 27.03% | 8.76% | 5.64% |
| 2024 | 5 | 26.89% | 6.15% | 5.06% |
| 2005 | 2 | 26.48% | -0.48% | 2.09% |
| 2020 | 8 | 26.00% | 10.94% | 6.98% |
| 2022 | 11 | 25.41% | 5.54% | 5.56% |
| Average | 38.63% | 7.52% | 3.52% | |
| Median | 32.29% | 6.15% | 4.45% |
(Source: Portfolio Visualizer)
NVDA’s 10% best months are a median 32% gain, with returns as strong as 82% in a single month.
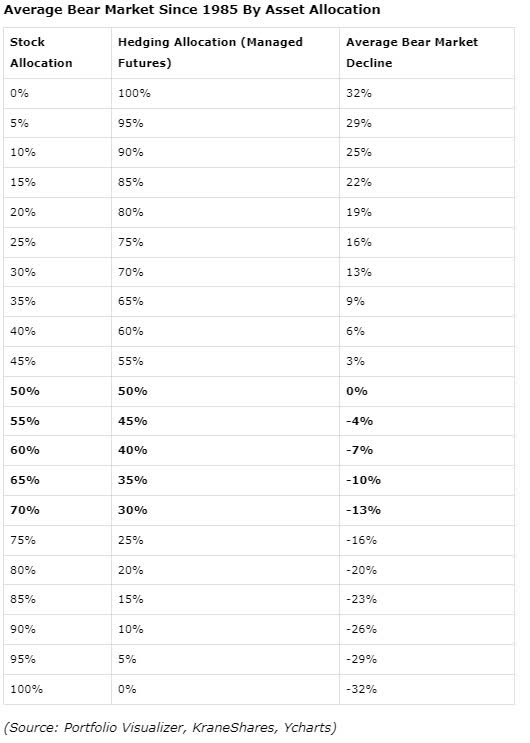
Can you see the benefits of rebalancing in real time during bear markets using managed futures and limit orders?
The 40% monthly crashes are what create the 82% monthly rallies. If your optimal NVDA allocation is 5% and falls to 40%, you can buy with limits and keep it at 5% the entire time. And so when that face-ripping rally comes around, when NVDA overshoots to the bottom, you end up with maximum benefit.
Then, at annual rebalancing time, you can harvest those excess returns, including bubble excess valuations, to buy high-yield blue chips to compound income even faster.

DK
This is why I am so bullish on NVDA. Not just for the growth, I don’t care about growth. I care about total returns because income tracks total returns due to annual rebalancing.
By harvesting the yield generated by NVDA’s extreme volatility, long-term NVDA investors can maximize long-term inflation-adjusted income.
Portfolio Visualizer
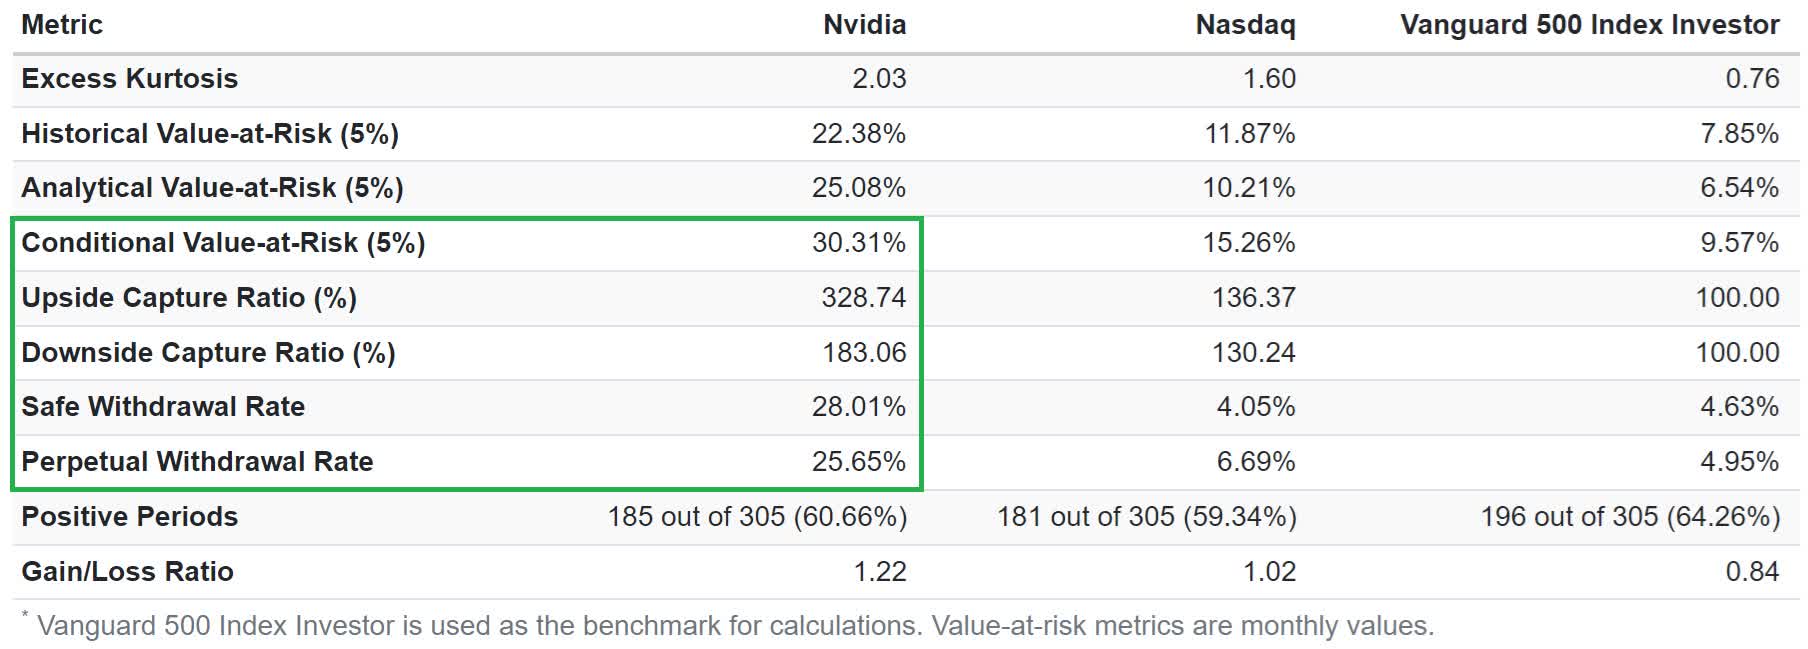
NVDA’s 5% worst months are 30% monthly declines, 3X worse than the S&P’s 10% worst 5% of months, and 2X worse than the Nasdaq’s 15% worst monthly returns.
NVDA has historically captured 329% of the S&P’s upside in exchange for 183% of its downside when stocks fall.
It delivered safe 26% withdrawal rates, though no investor would ever be 100% NVDA as a retirement plan.
Managed Futures = KMLM (since Jan 2021) (Portfolio Visualizer)
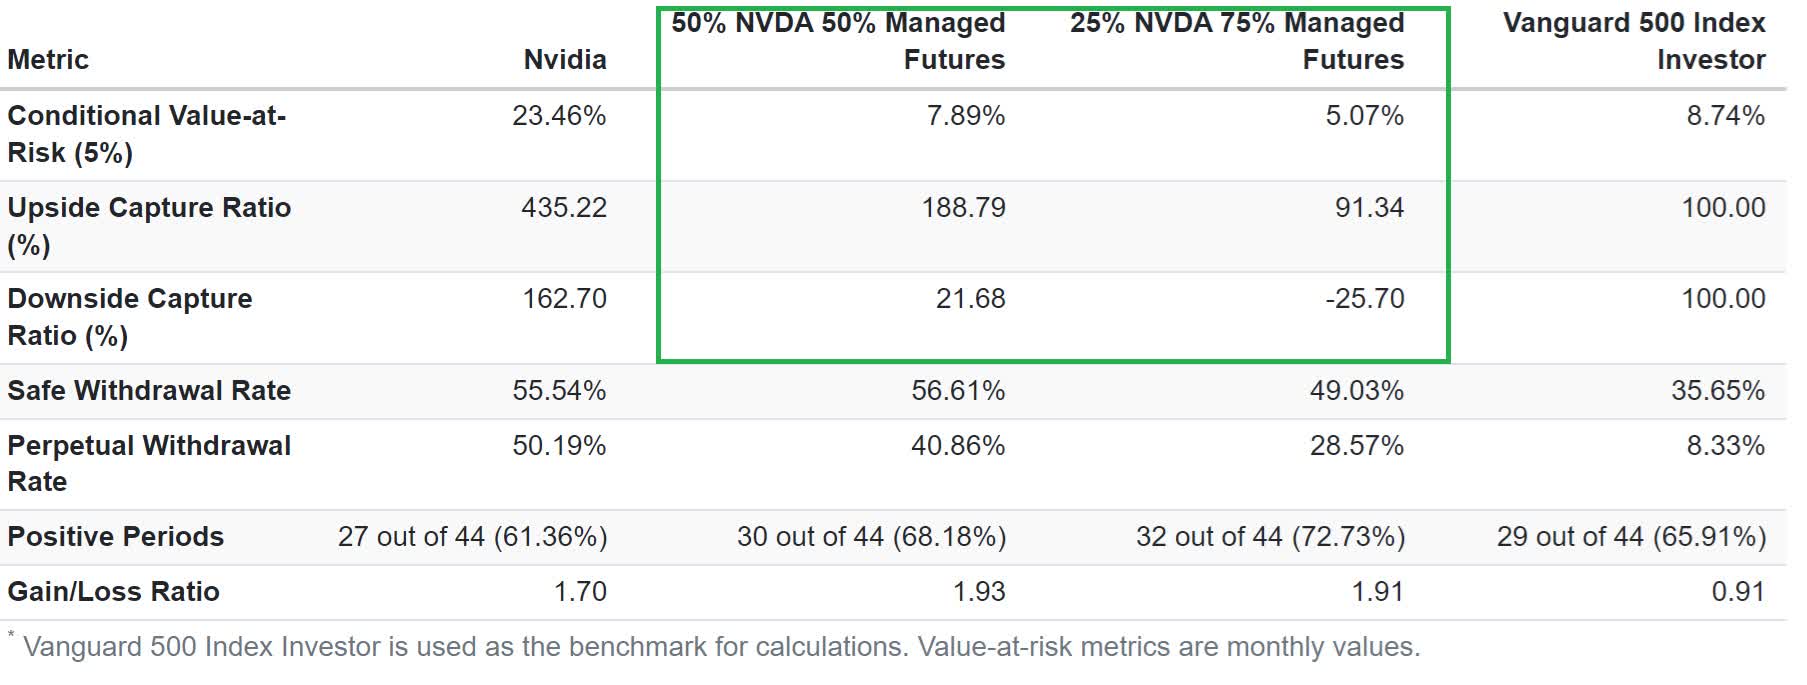
By combining NVDA with managed futures, you can adjust its volatility to what you can emotionally and financially stand.
For example, a 50% NVDA and 50% KMLM stock bucket captured 189% of the S&P’s upside with 22% of its downside.
25% NVDA and 75% KMLM captured the market, 91% of the S&P upside, with a 26% downside.
That means since Jan 2021, a 75% KMLM and 25% NVDA combo went up 9% when the S&P was up 10% and up 2.6% when the market was down 10%.
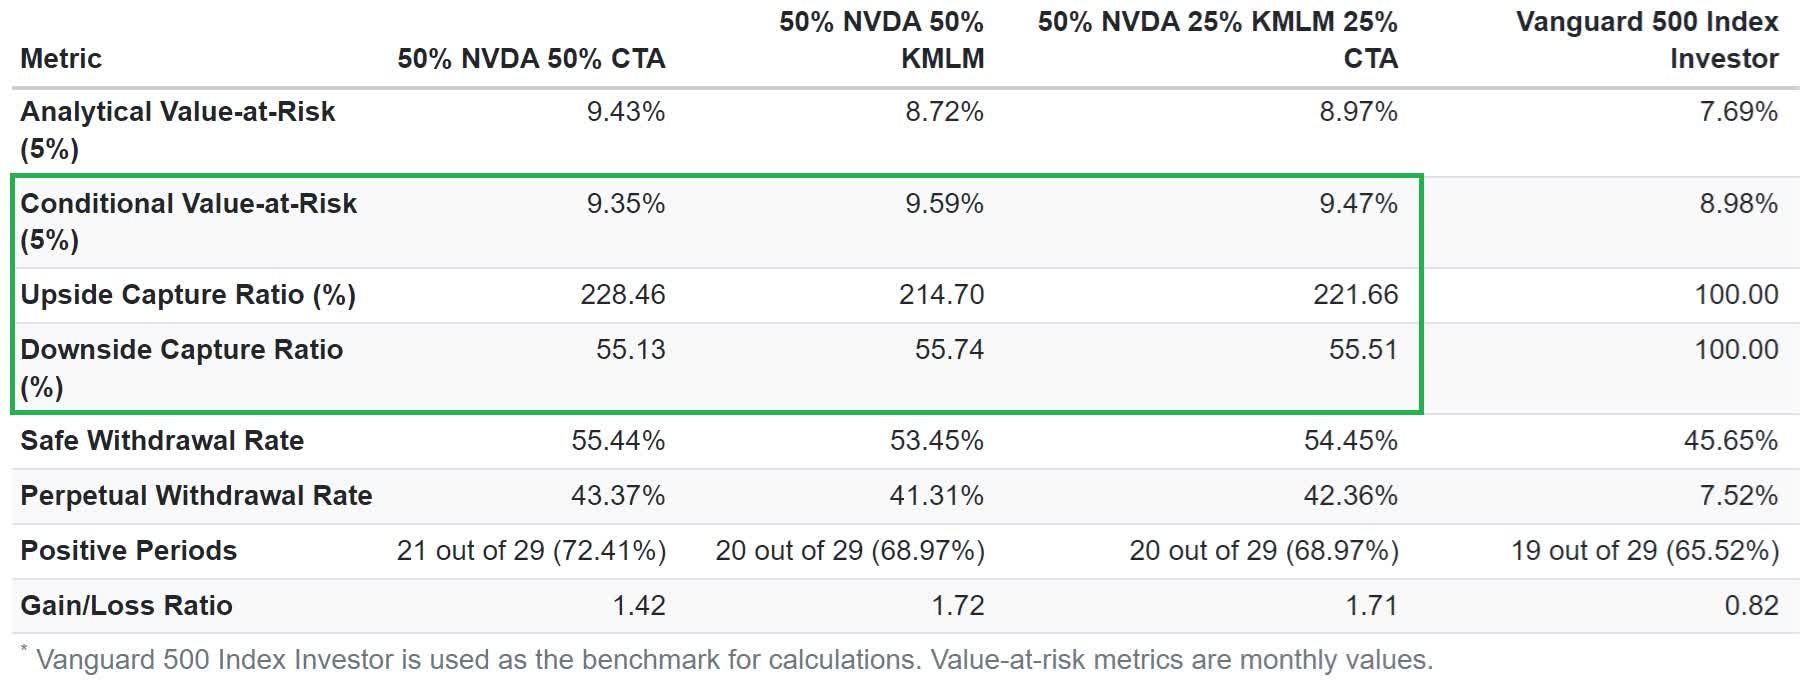
Since April 2022 (Portfolio Visualizer)
This is the key to emotional and financial risk management. I’m not trying to time whether NVDA will soar or crash. No one can predict that.
Trust Asset Allocation, Not Market Timing, To Control Volatility
Portfolio Visualizer Premium
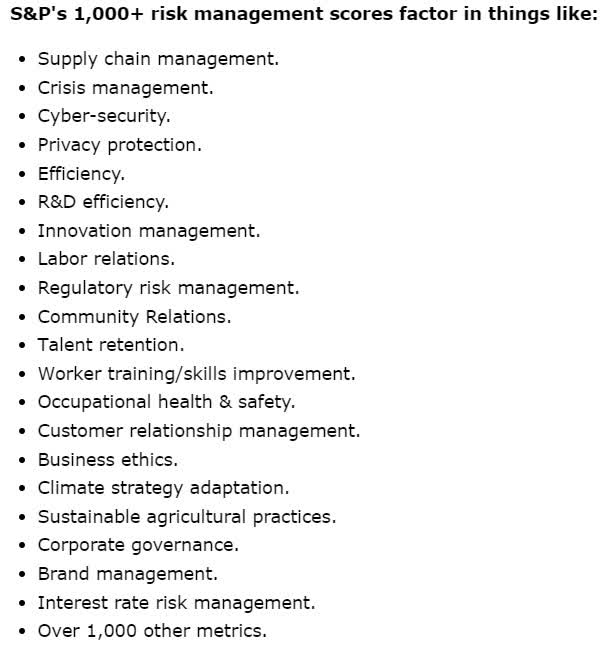
NVDA has risks, including regulatory/antitrust risks, R&D efficiency risks, and over 1,000 other risks.
S&P
| S&P LT Risk Management Score | Rating |
| 0% to 9% | Very Poor |
| 10% to 19% | Poor |
| 20% to 29% | Suboptimal |
| 30% to 59% | Acceptable |
| 60% to 69% | Good |
| 70% to 79% | Very Good |
| 80+% | Exceptional |
| NVDA | 64.80% |
| Global Percentile | 88.37% |
(Source: S&P)
Bottom Line: Nvidia Is A Reasonable Buy Going Into Earnings And One Of The Top Return Potentials For The Rest Of The Year
Let me be clear. I never make forecasts. I look at consensus fundamentals on quality companies and then calculate historically justified fundamental total return potentials.
NVDA’s year-end fair value is $147, and if it beats and raises as expected in this year’s final two earnings, that would likely rise to $175 to $195.
NVDA has been tracking its fair value for about 18 months, ever since the AI explosion sent its fundamentals soaring at record rates.
Does that mean NVDA will be $200 by year-end? As we’ve seen many times this year, market sentiment is fickle.
NVDA has soared as much as 50% in one month, crashed 25% weekly, and soared 45% in the last few days.
But it keeps returning to historical fair value, 40.14X earnings, each time, as it has for the last decade.
It’s critical to size your financial and emotional risk with NVDA properly. This stock is the quintessential high-volatility hyper-growth blue chip.
The downside volatility for the unprepared investor can be soul crushing. The volatility to the upside, created by the extreme crashes, is mind blowing.
But leave the speculation to the traders. Don’t attempt to time NVDA. If you like the company, including its visionary CEO, who says he wants to keep innovating, buy at a reasonable price ($132.83 fair value or lower) and hold on.
Once my annual asset allocation is set, I manage my NVDA risk by rebalancing NVDA on a fixed schedule, using trailing stops.
- What You Need To Know About Protecting Your Portfolio From Recession And Bear Markets
- The report includes a section on trailing stops, which I use when selling stocks during annual rebalancing.
I’m targeting an 11% max overweight on NVDA this year because this is the lowest-risk year for NVDA.
That’s because TSM’s ramp is running through 2025 (possibly into 2026), and TSM management has confirmed that NVDA will likely be capacity-constrained by the end of 2025.
That means NVDA’s potential for up to $265 billion in revenue capacity (if there is a demand) could support the $225 to $235 billion that Morgan Stanley and KeyBank expect.
Given that the market is 12-month forward-looking, the risk of an air gap in demand (sudden decrease in orders and collapse of margins) is very low for all of 2024.
Investors will start looking to 2026 in 2025, which means more significant risks of a sustained 40% to 60% bear market should an air gap develop.
I’ll adjust the target allocation to 7.5% to 9.1% next year, depending on the economy’s performance, based on my portfolio’s algo-driven risk management rules, which are optimized for my family’s needs at any time.
I’m not telling you what allocation to use for NVDA (if any). I’m using myself as an example.
I share my limit buys, reasoning, and the best available data from all 62 analysts.
But the bottom line? With high confidence, I’m riding into NVDA earnings with a record number of shares. Jensen fans will be impressed with the following:
My NVDA Earnings Expectations
- $30 to $50 billion buyback
- Possibly a doubling of the dividend.
- 12.5% to 20% beat and raise.
- 5% to 15% pop (options market pricing in 8.7% one-day swing).
Analyst’s Disclosure: I/we have a beneficial long position in the shares of NVDA either through stock ownership, options, or other derivatives. I wrote this article myself, and it expresses my own opinions. I am not receiving compensation for it (other than from Seeking Alpha). I have no business relationship with any company whose stock is mentioned in this article.
Seeking Alpha’s Disclosure: Past performance is no guarantee of future results. No recommendation or advice is being given as to whether any investment is suitable for a particular investor. Any views or opinions expressed above may not reflect those of Seeking Alpha as a whole. Seeking Alpha is not a licensed securities dealer, broker or US investment adviser or investment bank. Our analysts are third party authors that include both professional investors and individual investors who may not be licensed or certified by any institute or regulatory body.
—————————————————————————————-

Dividend Kings helps you determine the best safe dividend stocks to buy via our Automated Investment Decision Tool, Zen Research Terminal, Correction Planning Tool, and Daily Blue-Chip Deal Videos.
Membership also includes
-
Access to our 13 model portfolios.
-
My real money $2.4 million family portfolio.
-
50% discount to iREIT (our REIT-focused sister service)
-
real-time chatroom support
-
Real-time email notifications of all my family portfolio buys.
-
Numerous valuable investing tools
Click here for a two-week free trial, so we can help you achieve better long-term total returns and your financial dreams.