Summary:
- Nvidia’s potential for possible explosive earnings growth in 2025 is exceptional, with big upside potential based on forward PE and sales forecasts.
- Nvidia’s free cash flow is expected to grow significantly, driven by a 17% CAGR in sales through 2030, potentially reaching $166 billion in 2030.
- AI spending by big tech giants is projected to continue growing, boosting Nvidia’s sales and making it a top investment idea for 2025 and beyond.
- Despite its volatility, Nvidia’s strong growth prospects and leadership in AI make it a compelling investment with potentially extraordinary returns.
- This A-rated company has risk management in the top 14% of global companies, and with the AI spending boom expected to continue through 2031-2047, it’s one of my top 5 investing ideas, making up 10% of my net worth.

Jose Luis Pelaez Inc
Bottom Line Up Front: Nvidia Could Have A Blockbuster 2025
Ycharts
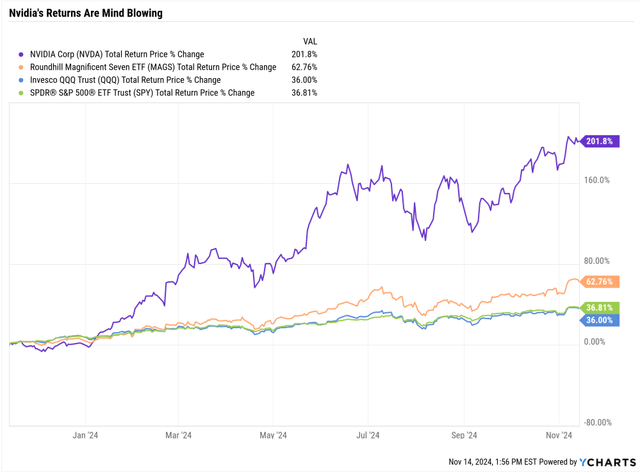
Nvidia (NASDAQ:NVDA) tripled last year.
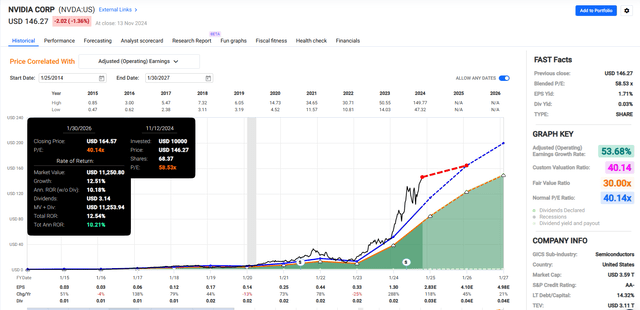
And its current consensus forecast appears to be somewhat underwhelming.
FAST Graphs, FactSet
However, as I’ll explain in a moment, NVDA’s potential for explosive beating of its earnings expectations is one of the best I’ve ever seen in eight years as an analyst.
5-Year Return Potential: 200% = 24% CAGR vs 76% S&P =12% CAGR.
FAST Graphs, FactSet
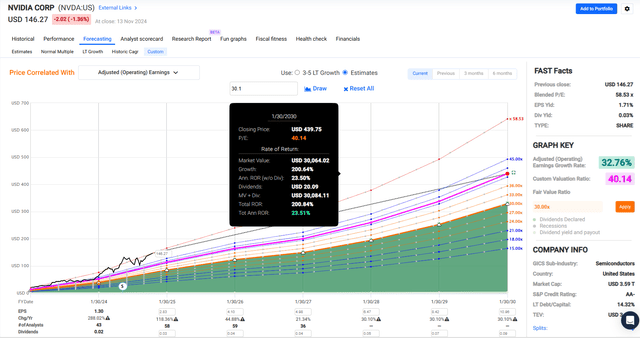
NVDA’s five-year return potential remains exceptional, but here’s the realistic-best case scenario for NVDA.
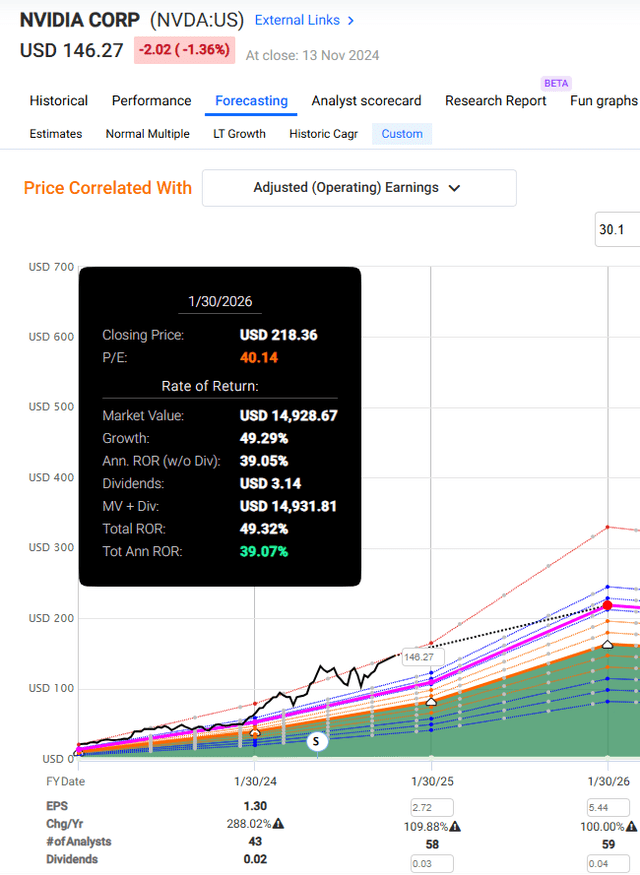
1-Year Return Potential: 49% = 39% CAGR vs 8% S&P
FAST Graphs, FactSet
5-Year Return Potential: 264% = 28% CAGR vs 76% S&P =12% CAGR.
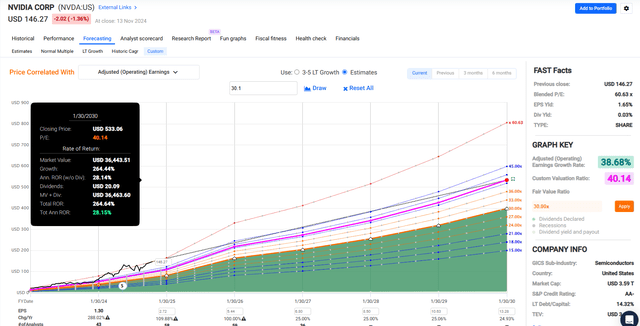
FAST Graphs, FactSet

Dividend Kings Zen Research Terminal
Why is Nvidia one of my top ideas for 2025? Why am I so confident in NVDA that it makes up 11% of my portfolio at the end of 2024?
- 10% of my net worth.
It has the possibility of 100% upside potential on a forward PE basis, as I’ll explain in a few minutes.
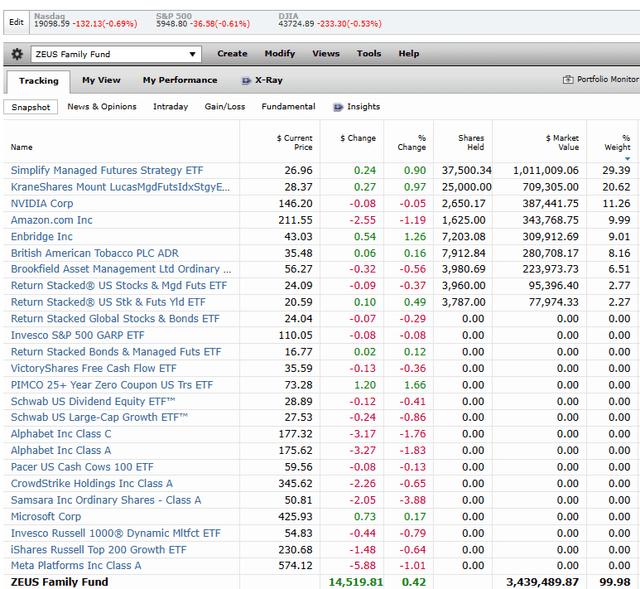
Morningstar
Let me show you the three reasons I think NVDA might be one of the hottest blue chips of 2025 and remain one of the top Ultra SWAN hyper-growth dividend stocks for the rest of this decade.
And that’s why I’m riding so strongly and confidently with CEO Jensen Huang in 2025.
Reason One: Exceptional Consensus Growth Right Now
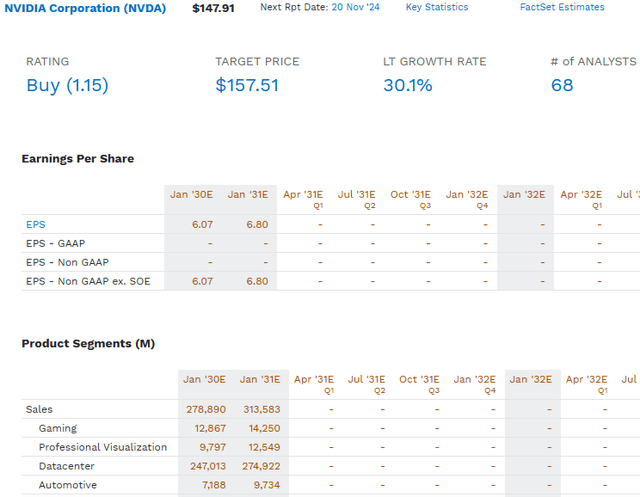
FactSet Research Terminal
The median consensus from all 68 analysts covering NVDA will grow sales annually through 2030 (Fiscal 2031).
That’s 17% CAGR consensus sales growth, which is impressive given NVDA’s size and extremely high profitability.
- $120 billion is the 2024 consensus revenue.
But of course, what matters isn’t just sales, it’s free cash flow, the true bottom line.
- Cash left after running the business and investing in future growth.
- Buffett’s owner earnings.
- The source of all long-term intrinsic value.

FactSet Research Terminal
Free cash flow estimates only go out as far as 2027 directly but show explosive growth in free cash flow, more than doubling in 2024 and then growing further:
- 44% in 2025.
- 27% in 2026.
- 18% in 2027.
- 30% CAGR from 2024 to 2027.
However, with the 2031 fiscal year sales consensus, we can extrapolate the potential free cash flow by using the 2027 consensus free cash flow margins.
- 2023: 43% FCF margin.
- 2024: 48% FCF margin.
- 2025: 46% FCF margin.
- 2026: 49% FCF margin.
- 2027: 53% FCF margin.
Analysts expect NVDA’s free cash flow margins to grow over time because revenue is expected to grow faster than costs for the foreseeable future.
Costs are primarily fixed (other than stock option grants), but sales are expected to grow at nearly 20% CAGR through 2031.
So, let’s use the 53% FCF margin consensus of 2027, which, if sales keep growing as expected, could be even higher in 2030.
- $166 billion in free cash flow in 2030.
What’s $166 billion in extrapolated free cash flow consensus in 2030 likely worth?
Nvidia Historical Valuation Profile
| Time Frame (Years) | Average PE | Average P/FCF | Annual EPS Growth | Annual FCF Growth | EPS PEG | FCF PEG |
| 20 | 35.71 | 34.94 | 34.25 | 32.78 | 1.04 | 1.07 |
| 19 | 34.82 | 34.94 | 34.34 | 36.19 | 1.01 | 0.97 |
| 18 | 34.5 | 33.23 | 28.44 | 26.08 | 1.21 | 1.27 |
| 17 | 35.02 | 33.95 | 26.14 | 26.93 | 1.34 | 1.26 |
| 16 | 35.99 | 34.44 | 25.55 | 22.07 | 1.41 | 1.56 |
| 15 | 37.27 | 36.03 | 42.91 | 39.79 | 0.87 | 0.91 |
| 14 | 37.65 | 36.03 | 45.98 | 33.66 | 0.82 | 1.07 |
| 13 | 35.91 | 37.31 | 40.05 | 33.83 | 0.90 | 1.10 |
| 12 | 35.83 | 38.49 | 39.68 | 34.38 | 0.90 | 1.12 |
| 11 | 37.84 | 41.14 | 44.57 | 40.55 | 0.85 | 1.01 |
| 10 | 40.14 | 44.18 | 52.96 | 46.15 | 0.76 | 0.96 |
| 9 | 42.5 | 47.69 | 53.13 | 46.54 | 0.80 | 1.02 |
| 8 | 45.84 | 52.31 | 62.24 | 47.7 | 0.74 | 1.10 |
| 7 | 48.54 | 56.27 | 53.62 | 52.08 | 0.91 | 1.08 |
| 6 | 49.75 | 58.05 | 49.7 | 45.33 | 1.00 | 1.28 |
| 5 | 48.85 | 59.21 | 50.89 | 53.85 | NA | 1.10 |
| 4 | 51.53 | 67.54 | 72.98 | 58.24 | 0.71 | 1.16 |
| 3 | 53.27 | 82.81 | 73.14 | 79.72 | 0.73 | 1.04 |
| 2 | 53.71 | 87.25 | 70.94 | 83.85 | 0.76 | 1.04 |
| 1 | 52.98 | 92.71 | 288.38 | 614.24 | 0.18 | 0.15 |
| Average | 42.4 | 50.4 | 59.5 | 72.7 | 0.9 | 1.1 |
| Median | 39.0 | 42.7 | 47.8 | 42.9 | 0.9 | 1.1 |
| 2030 FCF Consensus | $166,199.00 | Current Market Cap | $3,590,000.00 | 2029 Fair Value |
Annualized Return Potential |
|
| Free Cash Flow Fair Value (Median) | $7,090,049.34 | Increase In Value (Median) | 97.49% | $350.09 | 18.79% | |
| Free Cash Flow Fair Value (Average) | $8,380,750.77 | Increase In Value (Average) | 133.45% | $412.86 | 22.70% |
(Source: FAST Graphs, FactSet)
If Nvidia grows as expected and returns to its historical fair value price/FCF of 42.7 to 50.4, with a free cash flow PEG ratio of 1.1, it would be worth between $7.1 trillion and $8.4 trillion at the end of 2029.
For context, NVDA, at a $3.63 trillion market cap, became the most valuable company in global history, not adjusted for inflation.
If NVDA trades at its historical fair value multiples and grows as expected, it could be the most valuable company in history, adjusted for inflation, by 2029.
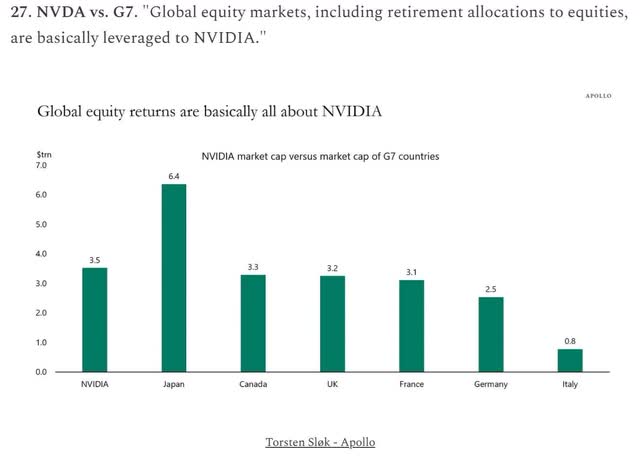
DailyChartBook
A company that might potentially be worth more than Japan’s entire stock market, the second most valuable on earth.
And what’s even more incredible? These estimates for potentially Buffett-like returns over the next five years might be conservative.
Reason Two: I’m Very Confident NVDA Will Blow Away These Expectations
The FactSet consensus is likely to underestimate NVDA’s medium-term results significantly.
Taiwan Semi (TSM) says it’s increasing wafer production by 150% in 2024 and 100% in 2025 but thinks that NVDA will remain supply-constrained through the end of 2025.
- $260 billion theoretical maximum sales for NVDA in 2025.
- Vs. $175 billion FactSet consensus.
Something that Jensen Huang, CEO of Nvidia, just confirmed.
Blackwell is in full production, Blackwell is as planned, and the demand for Blackwell is insane. Everybody wants to have the most, and everybody wants to be first.” Jensen Huang
According to Morgan Stanley analysts who met with Nvidia’s leadership, including Huang, orders for Blackwell GPUs are already sold out for the next 12 months. This means new customers placing orders now would have to wait until late 2025 to receive their orders.
So basically, NVDA appears to be fully booked through the end of next year.
Let me show you what I mean.
Business Insider
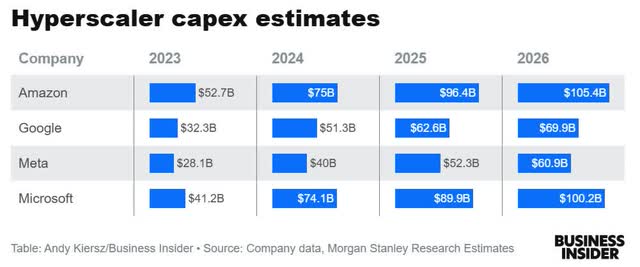
After running channel checks and speaking with management at the tech giants, Morgan Stanley estimates $300 billion in growth spending in 2025 and $336 billion in 2026.
Let’s see how these compare to the median FactSet consensus.
| Company | 2023 | 2024 | 2025 | 2026 | 2027 | 2028 | 2029 | Total |
| Microsoft | $36,298 | $54,107 | $65,484 | $69,136 | $73,238 | $92,199 | $116,066 | $281,503 |
| Amazon | $52,729 | $71,330 | $80,722 | $87,525 | $88,390 | $98,110 | $103,874 | $290,374 |
| Alphabet | $32,251 | $50,644 | $57,667 | $62,188 | $65,616 | $67,430 | $71,023 | $204,069 |
| Meta | $27,266 | $37,968 | $49,390 | $53,977 | $56,830 | $59,263 | $60,915 | $177,008 |
| Total | $148,544 | $214,049 | $253,263 | $272,826 | $284,074 | $317,002 | $351,878 | $952,954 |
| US GDP Growth Boost | 0.54% | 0.74% | 0.85% | 0.87% | 0.88% | 0.96% | 1.02% | 0.96% |
| GDP | $27,361,000 | $28,745,000 | $29,908,000 | $31,306,000 | $32,274,460 | $33,043,090 | $34,374,740 | $99,692,290 |
| Morgan Stanley | $154,300.00 | $240,400.00 | $301,200.00 | $336,400.00 | ||||
| Difference | $5,756.00 | $26,351.00 | $47,937.00 | $63,574.00 |
(Source: FactSet Research)
Morgan Stanley thinks AI spending will be around $48 billion for the hyperscalers, which is more than the overall consensus in 2025, and $64 billion more in spending in 2026.
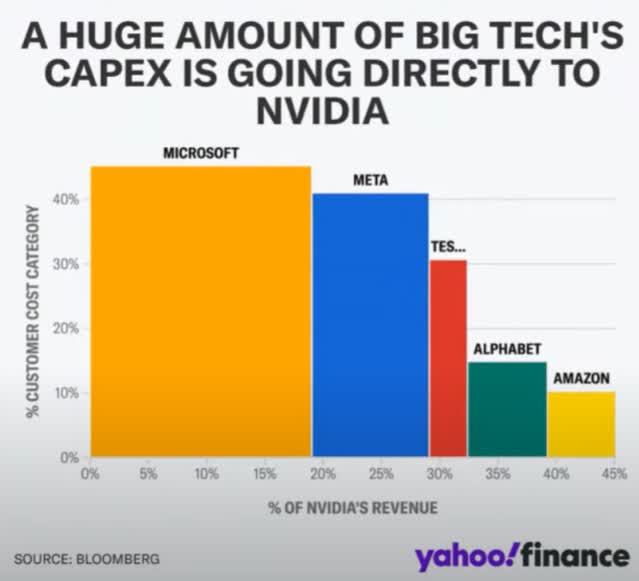
The median FactSet consensus is for 15.4% CAGR growth in capex (growth) spending, and about 50% of that goes towards AI (specifically NVDA).
Yahoo Finance
About 50% of big tech spending goes to NVDA, meaning around $150 billion in sales (per Morgan Stanley) from the four largest hyperscalers alone.
According to FactSet, that’s compared to $175 billion in consensus revenue.
In other words, if everyone other than AMZN, GOOGL, Meta, and MSFT buys over $25 billion of hardware from NVDA in 2025, it will beat current expectations.
Expectations will likely jump significantly after management provides its usual one quarter of forward guidance.
If Morgan Stanley is correct, NVDA will outperform consensus sales by $32 billion in 2026 alone.
- 15% sales beat in 2026.
The $260 billion theoretical maximum sales for NVDA in 2025, based on TSMC’s 100% capacity growth plans, means up to 100% upside potential by the end of 2025.
How many companies have a fundamentally justified total return potential, even if, in the best case, of 100% in the next year alone?
Reason Three: The AI Spending Boom Might Continue For Decades To Come
OK, so this level of growth spending, sufficient to boost US GDP growth by 1% alone (from just four companies), is remarkable.
- Bloomberg estimates 1.5% extra GDP growth from AI growth spending across all companies in 2025.
And the FactSet consensus expects growth spending from the hyperscalers to grow by 10.4% CAGR.
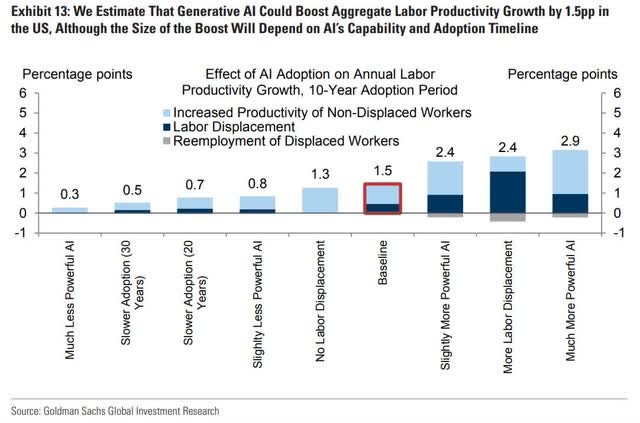
In other words, GDP growth could continue to accelerate due to AI spending alone. Never mind the 0.3% to 2.9% productivity boost Goldman Sachs estimates will begin in 2027.
Goldman Sachs
But you might wonder, why on earth are the big tech giants spending all this growth money? Aren’t they hurting their bottom lines? Didn’t investors revolt against Meta (META), resulting in a 75% crash in the 2022 bear market?
Nope, because the hyperscalers are so profitable that Wall Street doesn’t care. They consider it a feature, not a bug.
The Hyperscalers Free Cash Flow Consensus Estimates (20% CAGR From 2023 to 2027)
| Company | 2023 | 2024 | 2025 | 2026 | 2027 | 2028 | 2029 | Total |
| Microsoft | $66,731 | $71,411 | $77,198 | $98,425 | $122,083 | $152,020 | $182,603 | $770,471 |
| Amazon | $36,658 | $46,495 | $64,254 | $90,743 | $121,593 | $139,517 | $166,438 | $665,698 |
| Alphabet | $69,495 | $76,333 | $92,266 | $110,117 | $127,958 | NA | NA | $476,169 |
| Meta | $43,010 | $47,985 | $51,470 | $56,688 | $73,030 | NA | NA | $272,183 |
| Total | $215,894 | $242,224 | $285,188 | $355,973 | $444,664 | $291,537 | $349,041 | $2,184,521 |
(Source: FactSet)
From 2023 to 2027, analysts expect the Hyperscale tech giants (AI leaders) to deliver 20% CAGR free cash flow growth, from an incredible $216 billion to $445 billion.
Free cash flow is after spending on capex and R&D and investing in all future growth. Thanks to the greatest free cash flows in human history, cash balances are expected to rise to stratospheric levels.
The Hyperscalers Cash Balances Consensus Estimates
| Company | 2023 | 2024 | 2025 | 2026 | 2027 | 2028 | 2029 |
| Microsoft | $41,862 | $47,111 | $77,470 | $123,659 | $165,288 | $230,257 | $307,709 |
| Amazon | $73,387 | $107,591 | $172,003 | $254,327 | $411,124 | $582,293 | $795,354 |
| Alphabet | $24,048 | $37,300 | $84,438 | $133,843 | $293,895 | $431,899 | $596,997 |
| Meta | $41,682 | $47,111 | $77,470 | $123,659 | $165,288 | $230,257 | $307,759 |
| Total | $180,979 | $239,113 | $411,381 | $635,488 | $1,035,595 | $1,474,706 | $2,007,819 |
(Source: FactSet)
The FactSet consensus expects 49% CAGR growth in cash on balance sheets from 2023 to 2029 despite:
- Hundreds of billions in annual buybacks.
- Tens of billions in dividends.
- $1 trillion in AI growth spending.
- Around $1 trillion in R&D.
In fact, by 2029, these four companies are expected to have $2 trillion in cash on their balance sheets.
- Earning $80 billion in annual net interest from risk-free T-bills.
The point is that big tech is more than wealthy and profitable enough to fund this kind of incredible AI growth spending, which could deliver 22% or even greater annual returns for Nvidia by the decade’s end.
Why Big Tech Is Eager To Spend So Much On AI
Why would big tech spend trillions on AI just because it has the cash flow and giant piles of money?
Ycharts
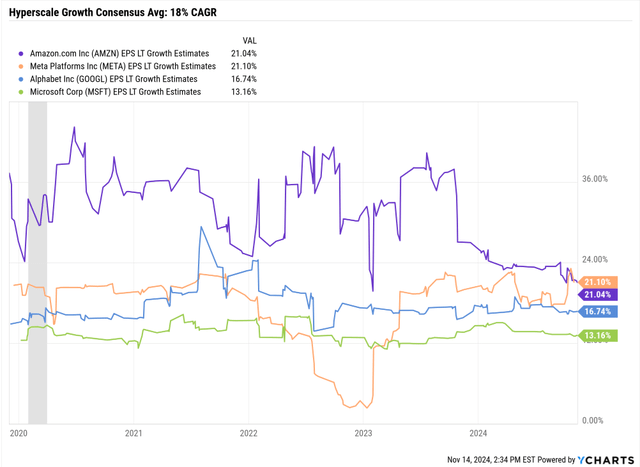
Because that’s how you achieve the expected 18% CAGR long-term earnings growth, that is 3X more than the S&P’s historical earnings growth rate.
Ok, so big growth spending leads to big growth, in theory, but how efficient is that growth spending?
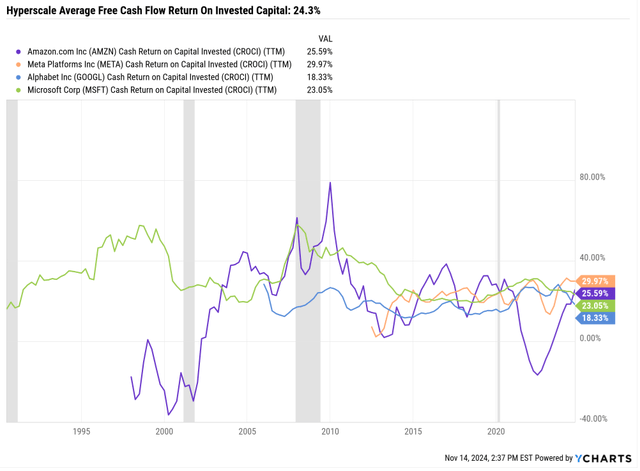
Ycharts
In the last 12 months, the free cash flow return on invested capital from the hyperscalers was 24%.
For every $1 spent (on anything), they generated $0.24 in additional free cash flow the following year.
For context, Buffett became the greatest investor in history by delivering 20% long-term annual investing returns.
If you can spend $100 today and earn $124 in free cash flow tomorrow, would you keep spending more each year? Yes.
What is the limit you’d spend? As long as the cash return on invested capital is attractive, you will spend exponentially more every year.
Nvidia’s Jensen Huang says his company plans to deliver a 1 million X improvement in AI computing power in the next decade.
What does that mean? Imagine, 1000X faster computing power for 1,000X lower cost.
Do you think Microsoft, Amazon, and Alphabet, the three most significant cloud computing providers, might be interested in that?
Microsoft Case Study: Why Microsoft Can’t Get Enough AI Chips
In the most recent conference call, Microsoft’s management told us about AI’s impact on the company.
- AI-driven transformation is changing work across roles, functions, and business processes, helping customers drive growth and operating leverage.
- Microsoft’s AI business is on track to surpass $10 billion in annual revenue run rate next quarter, making it the fastest business in Microsoft’s history to reach this milestone.
- Azure AI usage more than doubled over the past six months, with both digital natives and established enterprises moving AI apps from test to production.
- GitHub Copilot is changing how software is built, with enterprise customers increasing 55% quarter-over-quarter.
- Microsoft 365 Copilot adoption is accelerating, with usage more than doubling quarter-over-quarter. Nearly 70% of Fortune 500 companies now use it.
- AI is driving fundamental changes in the business applications market, with customers shifting from legacy apps to AI-first business processes.
- Microsoft is bringing AI to industry-specific workflows, like healthcare with DAX Copilot.
- AI is transforming search, browsers, and digital advertising, helping Microsoft gain share with Bing and Edge.
- Microsoft is investing heavily in AI infrastructure and capabilities while driving efficiencies across businesses.
- The company expects Azure growth to accelerate in the second half of the fiscal year as capital investments create increased AI capacity to serve growing demand.
Azure is MSFT’s cloud computing platform, so consider how AI has been accelerating its growth.
- Four quarters ago: 6% boost to Azure growth.
- Three quarters ago: 7% boost to growth.
- Two quarters ago: 8% boost to growth.
- Last quarter: 12% boost to growth (33% growth in Azure)
- This quarter: Even faster acceleration in Azure growth.
Morgan Stanley is more conservative, expecting “just” 9% growth in cloud computing thanks to AI.
Azure is Microsoft’s fastest-growing and most important business. AI spending is directly driving accelerating growth.
Jensen Huang says, “The more you spend, the more you save.”
Well, when it comes to AI that is not just a slogan, Microsoft is living this fact right now.
In other words, the fear that “big tech will stop spending on AI” is becoming less likely.
Either all the tech giants are run by complete idiots who have fallen for the most significant tech scam in history, or, like Microsoft is showing, the more they spend on AI. The more their profits grow, giving them the resources to spend more on AI and R&D than the US government.
- By 2030, AMZN, MSFT, Meta, and GOOGL will spend more on R&D and growth capex than the US government is spending on infrastructure in the next decade.
- Each year!
Jensen recently said that AGI, which Nvidia expects to arrive by 2029, might increase human productivity by as much as 50X.
- Nvidia claims its increasing AI computing power by 4X each year.
The average revenue per employee for S&P 500 companies in 2023 was $597,087.
- $29,854,350 in potential sales per employee.
Compound
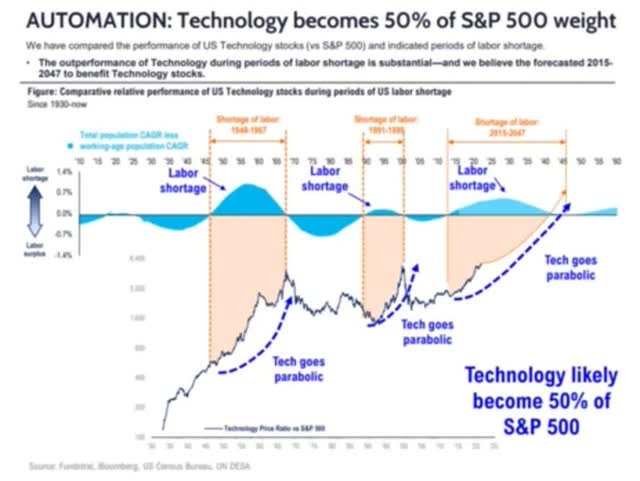
This is why Fundastrat believes big tech could grow to 50% of the S&P 500, with tech/communications (GOOG, Meta)/consumer discretionary (AMZN, TSLA) reaching 75%.
- Railroads were 80% of the US stock market in 1900.
Risk Profile: Why Nvidia Isn’t Right For Everyone
While it’s true that big tech (including OpenAI) is in an arms race for AI that shows no sign of slowing (20% to 25% CAGR growth in AI chips for the foreseeable future, according to Jensen Huang), that doesn’t mean Nvidia is a “risk-free” investment, not by a long shot.
Sam Altman, the CEO of OpenAI, is in a race to create an artificial general intelligence (AGI) – aka “AI as smart as a human” is planning to spend $100 billion on an AI model called “Project Stargate” that’s expected to be 1,000X as powerful as ChatGPT 4.0, and require 5 GW of power.
- The power of five nuclear power plants.
- It’s equal to what NYC uses.
Project Stargate is expected to require 4 million GPUs.
For context, in 2023:
- Nvidia shipped 3.76 million data center GPUs for AI applications.
- This represented approximately 98% of the AI GPU market share.
- Total AI GPU shipments across all companies (including AMD and Intel) were 3.85 million units.
- Nvidia’s 3.76 million shipments increased by over 1 million units compared to 2022, representing 42% year-over-year growth.
In other words, OpenAI wants more GPUs for Stargate than Nvidia shipped in 2023.
But that doesn’t necessarily mean that it will be mostly Nvidia GPUs.
Increasing competition: Major tech companies and startups are developing their own AI chips, including:
- Google, with its TPUs
- Microsoft with new Azure Maia AI Accelerator and Azure Cobalt CPU
- AMD with Instinct AI accelerators
- Intel with Gaudi AI accelerators
- Apple and Qualcomm optimizing chips for on-device AI
- Startups like D-Matrix, Cerebras Systems, and others
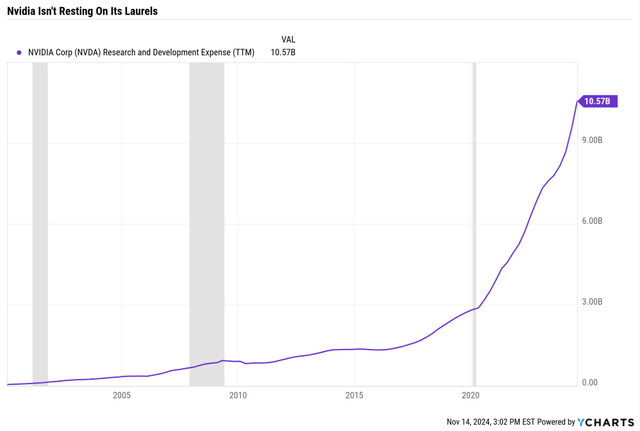
Ycharts
In an arms race with AMD and Intel, Nvidia has ramped up its R&D.
Nvidia Growth Spending Consensus Forecast
| Year | R&D | Capex |
Total Growth Spending |
| 2023 | $6,036 | $1,133 | $7,169 |
| 2024 | $8,926 | $2,246 | $11,172 |
| 2025 | $11,561 | $2,753 | $14,314 |
| 2026 | $16,044 | $3,234 | $19,278 |
| 2027 | $20,333 | $3,112 | $23,445 |
| 2028 | $24,525 | NA | $24,525 |
| 2029 | $29,649 | NA | $29,649 |
| 2030 | $30,098 | NA | $30,098 |
| 2031 | $36,418 | NA | $36,418 |
| Total | $183,590 | $12,478 | $196,068 |
(Source: FactSet)
Nvidia is expected to spend almost $200 billion on R&D from 2023 to 2031 and about $210 billion on total growth spending.
- $7 billion to $40 billion in growth spending in eight years.
- 24% CAGR growth in growth spending.
It’s the global leader in AI chips, having invented the most popular software platform (Cuda).
Basically, Nvidia is like Apple, the most lucrative smartphone ecosystem. Still, its continued lead will only persist if it avoids complacency and innovates effectively.
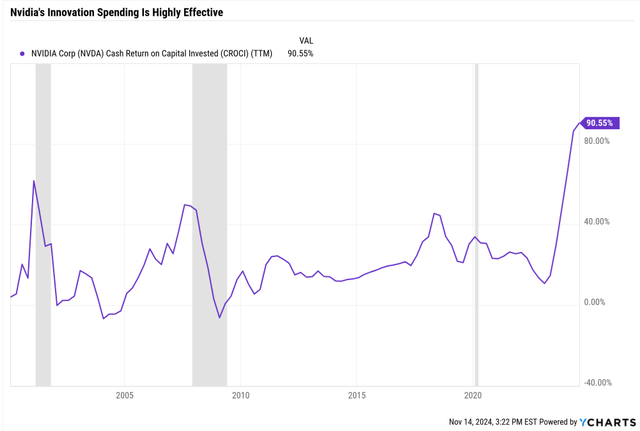
Ycharts
Nvidia is the innovation leader and the most effective company in the industry in converting R&D spending into free cash flow.
As long as it remains the innovation leader with the best chips and the most cost-effective long-term solution, hyperscalers like Microsoft are likely to choose it.
If it fails to remain the No. 1 low-cost, long-term solution, then big tech could end up building its own chips (or buying AMD) with its $2 trillion cash pile (by 2029).
The double-edged sword of big tech.
They have virtually infinite budgets to spend but also are the biggest threat to Nvidia.
- The only ones in the world that could buy AMD and double its R&D budget (or triple it) would be big tech.
- And potentially hire NVDA engineers.
- By offering 2X to 3X the salaries.
And that’s just one major risk (the largest).
S&P
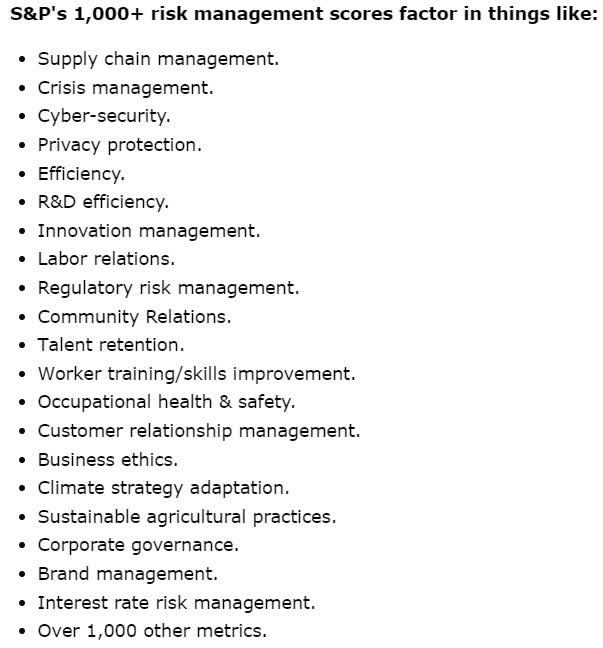
Fortunately, S&P has a risk management model that factors in virtually everything that can go wrong.
| S&P LT Risk Management Score | Rating |
| 0% to 9% | Very Poor |
| 10% to 19% | Poor |
| 20% to 29% | Suboptimal |
| 30% to 59% | Acceptable |
| 60% to 69% | Good |
| 70% to 79% | Very Good |
| 80+% | Exceptional |
| Nvidia | 64% Optimal |
| Global Percentile | 86% (Top 14% of Global Companies) |
(Source: S&P)
NVDA is in the top 14% of global companies (13,000-plus rated companies) at managing its risk.
And, of course, these are just the fundamental risks.
Incredible Volatility That Nvidia Investors Have To Expect In The Future

Portfolio Visualizer
Since its 1999 IPO, NVDA has turned $1K into $4 million, which is an incredible 4,000X return.
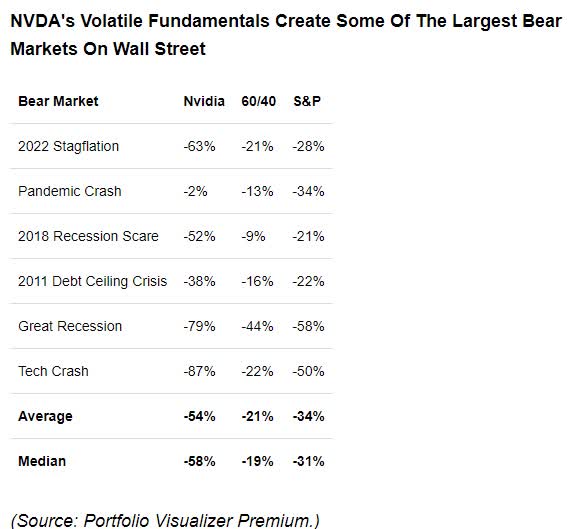
Its average annual volatility has been 61%, meaning it could crash by 61% in any given year.
Portfolio Visualizer
The median bear market is a 58% crash.
Worst 5 Annual Returns
| Nvidia |
Vanguard 500 Index Investor |
|
| Year | Return | Return |
| 2002 | -82.80% | -22.15% |
| 2008 | -76.28% | -37.02% |
| 2022 | -50.27% | -18.23% |
| 2018 | -30.82% | -4.52% |
| 2010 | -17.56% | 14.91% |
| Average | -51.55% | -13.40% |
| Median | -50.27% | -18.23% |
(Source: Portfolio Visualizer)
Best 5 Annual Returns
| Nvidia |
Vanguard 500 Index Investor |
|
| Year | Return | Return |
| 2001 | 308.35% | -12.02% |
| 2023 | 239.02% | 26.11% |
| 2016 | 226.94% | 11.82% |
| 2024 | 195.44% | 26.81% |
| 1999 | 147.04% | 16.18% |
| Average | 223.36% | 13.78% |
| Median | 226.94% | 16.18% |
(Source: Portfolio Visualizer)
Worst 5% Monthly Returns
| Nvidia | Vanguard 500 Index Investor | ||
| Year | Month | Return | Return |
| 2002 | 6 | -48.66% | -7.13% |
| 2008 | 7 | -38.89% | -0.83% |
| 2002 | 7 | -35.56% | -7.72% |
| 2001 | 9 | -35.14% | -8.09% |
| 2000 | 11 | -34.83% | -7.89% |
| 2002 | 12 | -32.81% | -5.89% |
| 2022 | 4 | -32.03% | -8.73% |
| 1999 | 9 | -31.56% | -2.74% |
| 2008 | 1 | -27.72% | -6.02% |
| 2019 | 5 | -25.07% | -6.36% |
| 2018 | 10 | -24.98% | -6.85% |
| 2004 | 7 | -24.67% | -3.31% |
| 2008 | 6 | -24.21% | -8.44% |
| 2000 | 10 | -24.10% | -0.43% |
| 2002 | 2 | -22.41% | -1.94% |
| Average | -30.84% | -5.49% | |
| Median | -31.56% | -6.36% |
(Source: Portfolio Visualizer)
The average decline in the 5% worst months is a 31%. And NVDA is capable of falling almost 50% in a single month.
Best 5% Monthly Returns
| Nvidia | Vanguard 500 Index Investor | ||
| Year | Month | Return | Return |
| 2003 | 5 | 82.62% | 5.26% |
| 2000 | 2 | 72.68% | -1.91% |
| 2001 | 1 | 57.56% | 3.55% |
| 1999 | 11 | 56.50% | 2.02% |
| 2001 | 10 | 56.02% | 1.90% |
| 2011 | 1 | 55.32% | 2.36% |
| 2001 | 3 | 45.28% | -6.36% |
| 2002 | 11 | 43.95% | 5.88% |
| 2009 | 12 | 43.03% | 1.95% |
| 1999 | 8 | 39.75% | -0.50% |
| 2002 | 10 | 39.02% | 8.78% |
| 2017 | 5 | 38.54% | 1.39% |
| 2023 | 5 | 36.34% | 0.42% |
| 1999 | 12 | 35.56% | 5.98% |
| 2023 | 1 | 33.69% | 6.27% |
| Average | 49.06% | 2.47% | |
| Median | 43.95% | 2.02% |
(Source: Portfolio Visualizer)
The upside of extreme downside is there if you can stomach the wild ride.
Bottom Line: Nvidia’s Total Return Potential In 2025 Is Extraordinary
Nvidia’s earnings growth consensus for next year is 41%.
And that’s on $175 billion in consensus sales.
As I’ve explained in this article, based on management guidance and Taiwan Semi’s capacity ramp, Nvidia’s hypothetical max EPS growth is 100% in 2025.
And according to Morgan Stanley, $150 billion of that $260 billion potential sales could come from the hyperscaler tech giants.
As long as the big tech giants don’t announce big cuts in growth spending in 2026 (the consensus is that there will be more growth spending through 2029 at least), Nvidia will have a relatively low fundamental risk next year.
Its hyper-volatile nature means that it won’t be a smooth ride.
- When the S&P fell 9.8% in August 2024, NVDA was down 35%.
But suppose you can embrace such volatility as an ally and use it to buy NVDA opportunistically. In that case, you can enjoy an even more robust 2025 and likely excellent returns through 2029.
The AI revolution appears to be gaining steam.
So unless the big tech giants are all run by idiots, AI’s productivity and profit gains make Nvidia one of my top 5 investing ideas for 2025 and beyond.
Analyst’s Disclosure: I/we have a beneficial long position in the shares of NVDA either through stock ownership, options, or other derivatives. I wrote this article myself, and it expresses my own opinions. I am not receiving compensation for it (other than from Seeking Alpha). I have no business relationship with any company whose stock is mentioned in this article.
Seeking Alpha’s Disclosure: Past performance is no guarantee of future results. No recommendation or advice is being given as to whether any investment is suitable for a particular investor. Any views or opinions expressed above may not reflect those of Seeking Alpha as a whole. Seeking Alpha is not a licensed securities dealer, broker or US investment adviser or investment bank. Our analysts are third party authors that include both professional investors and individual investors who may not be licensed or certified by any institute or regulatory body.
—————————————————————————————-

Dividend Kings helps you determine the best safe dividend stocks to buy via our Automated Investment Decision Tool, Zen Research Terminal, Correction Watchlist, And Planning Tool, and Daily Blue-Chip Deal Videos.
Membership also includes
- Access to our 14 model portfolios.
- my real money $3.4 million ZEUS Family portfolio.
- 50% discount to iREIT (our REIT-focused sister service)
- real-time chatroom support
- real-time email notifications of all my ZEUS Family portfolio buys
- numerous valuable investing tools
Click here for a two-week free trial so we can help you achieve better long-term total returns and your financial dreams.
