Summary:
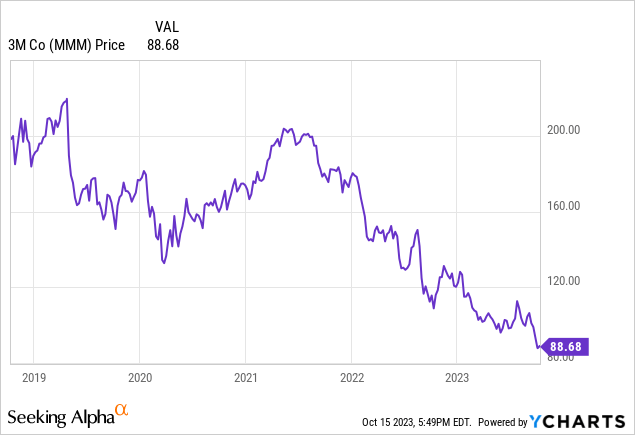
- 3M Co shares have experienced a 40% pullback, trading near 52-week lows at a 10.0x forward P/E.
- The company reported weak quarterly results, with a decrease in sales and a negative impact on earnings due to a proposed settlement regarding water contamination.
- Despite slow growth, 3M’s strong business portfolio and efficient operations have allowed for high profitability and growth in book value.
jetcityimage
The 40% pullback in 3M Co (NYSE:MMM) shares have the company trading near 52-week lows at a 10.0x forward P/E. Driving the pullback over the past year has been the previously announced proposed settlement agreement with PWS in the United States. The case involved public water contamination by perfluoroalkyl and polyfluoroalkyl substances (PFAS) produced by 3M. The resulting settlement is a pre-tax charge of $10.3 billion that negatively impacted earnings per share by $14.19 in the latest quarter, but is payable over 13 years. This one-time item will be seen through the graphs/metrics discussed as we adjust potential investor yields and cash flows for the 13-year payout of the settlement. 3M is a mature and slow growing business, but the cash flows are starting to look appealing at the current levels.
Latest Quarterly Results
In 3M’s latest Q2 2023 quarterly results, the company reported weak results with GAAP sales of $8.3 billion, which was a decrease of 4.3% compared to the prior year. Adjusted (non-GAAP) sales were not any better and decreased 4.7% compared to the past year on a total basis, along with a 2.5% decrease based on organic sales.
Effecting earnings were the previously announced proposed settlement agreement with PWS in the United States regarding PFAS resulting in a pre-tax charge of $10.3 billion payable over 13 years which negatively impacted earnings per share by $14.19. This one-time item will be seen through the graphs/metrics discussed. Adjusting the TTM GAAP $2.82 loss per share for the $14.19 settlement (approximately $11.35 post-tax), 3M’s TTM diluted EPS comes to $8.53 which would place it at a 10.4x TTM P/E with 3M’s current stock price at $88.68.
On the debt side, compared to the prior quarter, 3M also decreased their net debt (offset by cash balances) by 12% to $11.7B from the prior year quarter. Management also increased guidance for the full year to adjusted EPS of $8.60 to $9.10 compared to prior guidance of $8.50 to $9.00. At the new midpoint of $8.85 EPS per share, this would yield a forward PE around 10.0x.
A Profitable and Growing Business
3M’s strong business portfolio and efficient operations have allowed it to achieve an average return on equity (‘ROE’) and return on invested capital (‘ROIC’) of 34.7% and 12.4% respectively over the past decade. This level of profitability is well above my rule of thumb of 15% ROE and 9% ROIC before adjusting the latest TTM PWS settlements ($10.3 billion pre-tax charge). Adjusting for the after-tax implications of the PWS settlement would raise the ROE and ROIC averages up to 45.1% and 18.7% respectively. These long-term figures allow me to be confident that, in my opinion, the company is able to maintain and continue to increase its intrinsic value in the future. Hopefully there are no more lawsuits lurking in the background, but the cash flows look able to support the 13-year payout of the $10.3 billion.
Historical Profitability at 3M (compiled by author from company financials)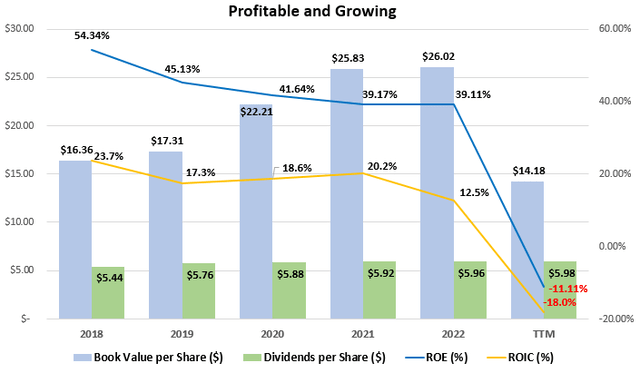
On the growth side, 3M looks like a pretty mature company in my opinion given that since 2018 the company has only managed to grow revenues per share at an average rate of 2.1%. Growth in EPS has been worse, at an average rate of -0.9% when being generous and adjusting for the pre-tax $14.19 per share in settlements mentioned earlier. Dividend growth has been in line with revenue gains at an average rate of 2.1% with the dividend payout ratio (excluding share repurchases) being stable over the period around 60% as can be seen in the graph below. This dividend payout ratio shows some room for growth over EPS or revenue gains going forward.
Per Share Figures at 3M (compiled by author from company financials)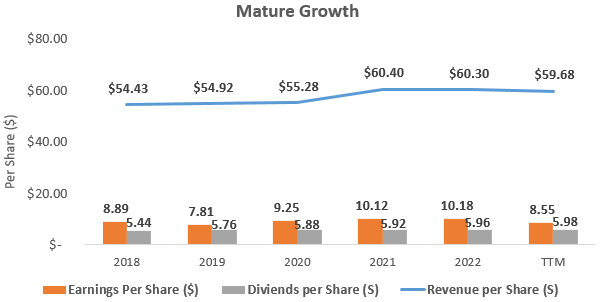
How is the Cash Flow?
Strong businesses with a good brand and wide product portfolios, such as 3M, are able to generate cash beyond what is needed to fund sustainable operations. As can be seen in the graph below, capital expenditures and acquisitions have averaged only 22% and 5%, respectively, of cash flow from operations since 2018.
Cash Flow Analysis at 3M (compiled by author from company financials)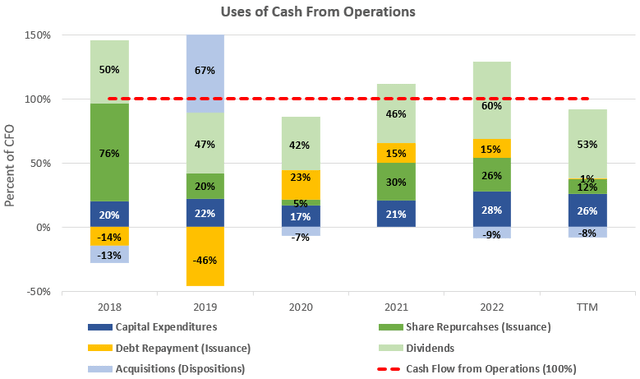
With capital expenditures and acquisitions only taking up on average 27% of cash flow from operations over the past decade, this leaves approximately 73% to be returned to investors in the form of dividends and share repurchases. With average cash flow from operations of $7.0 billion over the past five years, this 73% would imply free cash flow to shareholders of $5.0 billion for an impressive 10.2% free cash flow yield at the current $49.1 billion market capitalization. If we take the $10.3 billion settlement payments over the next 13 years, this would imply payments of $792 million per year, lowering the average FCF available to shareholders down to $4.2 billion for an 8.62% FCF yield.
Interest Coverage & Debt
Since 2018, finance leverage at 3M has stayed relatively stable around 3.6x, as can be seen in the chart below, and the company’s interest coverage ratio was a healthy 9.4x in 2022. 3M also does a great job returning cash to shareholders in the form of dividends and share repurchases. Since its 2018 fiscal year, the company has bought back on average 1.64% of its outstanding shares each year, as can be seen in the graph below. Adding these share repurchases on top of the current 6.77% yield would imply a total shareholder yield of 8.41%.
Leverage and Shares Outstanding (compiled by author from company financials)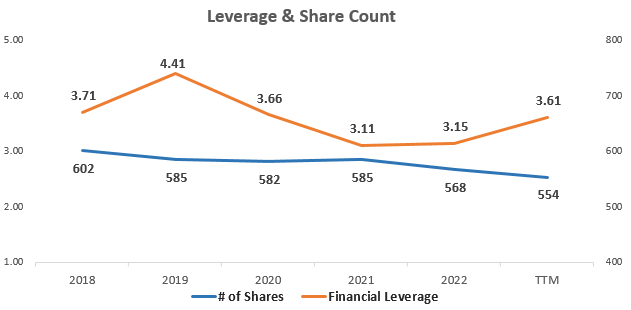
Getting a Sense of Valuation
3M’s adjusted TTM P/E of 10.4x can also be expressed as a 9.6% earnings yield, but I also always like to examine the relationship between average ROE and price-to-book value in what I call the Investors’ Adjusted ROE, especially for cyclical companies. It examines the average ROE over a business cycle and adjusts that ROE for the price investors are currently paying for the company’s book value or equity per share. 3M has a great ROE, but potential returns for investors depend on the multiple paid for the book value of equity in the public stock market.
With 3M earning an average ROE of 34.7% since 2018 and shares currently trading at a price-to-book value of 6.3x when the price is $88.68, this would yield an investors’ Adjusted ROE of 5.6% for an investors’ equity at that purchase price, if history repeats itself. If we use the adjusted ROE of 45.1% mentioned earlier, which excludes the PSW settlement, this investors’ Adjusted ROE increases up to 7.2%. This is no growth yield is slightly below the 9% that I like to see, but adding 3% to conservatively represent 3M growing alongside GDP could increase this potential total return beyond my 9% target.
Below is a table outlining the potential earnings yield estimates from this investors’ adjusted ROE figure, as well as the cash flow and earnings yields discussed.
Potential Shareholder Yields from 3M (compiled by author from market data and company financials)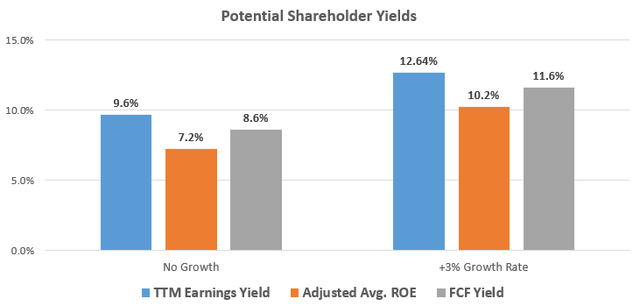
Takeaway for Investors
The 40% pullback in 3M shares have left the company trading near 52-week lows at a 10.0x forward P/E given management’s latest guidance of $8.85 diluted EPS. Growth has been nothing special at 3M over the last 5 years, so I would be hesitant to adding much growth to the potential earnings yield. Adjusting for the settlement agreement with PWS in the United States, the valuation and cash flows are starting to look appealing at these low valuations.
Analyst’s Disclosure: I/we have no stock, option or similar derivative position in any of the companies mentioned, but may initiate a beneficial Long position through a purchase of the stock, or the purchase of call options or similar derivatives in MMM over the next 72 hours. I wrote this article myself, and it expresses my own opinions. I am not receiving compensation for it (other than from Seeking Alpha). I have no business relationship with any company whose stock is mentioned in this article.
Disclaimer: While the information and data presented in my articles are obtained from company documents and/or sources believed to be reliable, they have not been independently verified. The material is intended only as general information for your convenience, and should not in any way be construed as investment advice. I advise readers to conduct their own independent research to build their own independent opinions and/or consult a qualified investment advisor before making any investment decisions. I explicitly disclaim any liability that may arise from investment decisions you make based on my articles.
Seeking Alpha’s Disclosure: Past performance is no guarantee of future results. No recommendation or advice is being given as to whether any investment is suitable for a particular investor. Any views or opinions expressed above may not reflect those of Seeking Alpha as a whole. Seeking Alpha is not a licensed securities dealer, broker or US investment adviser or investment bank. Our analysts are third party authors that include both professional investors and individual investors who may not be licensed or certified by any institute or regulatory body.
