Summary:
- 3M’s stock has declined by 21% since 2021, facing challenges like declining margins and PFAS litigation, but new CEO William Brown brings hope for profitability.
- Q2 2024 showed improvement in gross margin and adjusted EPS, with strong operational excellence attributed to lean manufacturing and robust supply management.
- Despite a high TTM P/E ratio, 3M’s diversified portfolio and positive EV/EBITDA ratios suggest undervaluation, but stagnant revenue and high debt remain concerns.
- Addressing PFAS litigation and restructuring operations are crucial for 3M’s long-term success and ability to sustain shareholder value through dividends and stock buybacks.
josefkubes
Investment Thesis
3M (NYSE:MMM) is an American conglomerate that saw a significant decline in its stock price in recent years. Since 2021, the 3M stock has declined by 21%.
The company has a diverse portfolio and a wide range of products worldwide in different regions. The company sells its 45,000 products in 55 sectors, including aerospace, construction, automotive, electronics, and consumer goods in around 200 countries. This wide range of products and access to a huge market helped it enjoy a gross profit margin of 50% by 2018, but this number has declined since then. Until 2017, it also enjoyed an operating margin income of 17%, which has also been declining since then.
Their new CEO, William Brown, could be a sign of hope. He brings extensive experience as the former CEO of L3Harris Technologies. This could help the company utilize his expertise to increase its profitability and deal with challenges related to the PFAS litigation.
Q2 Highlights
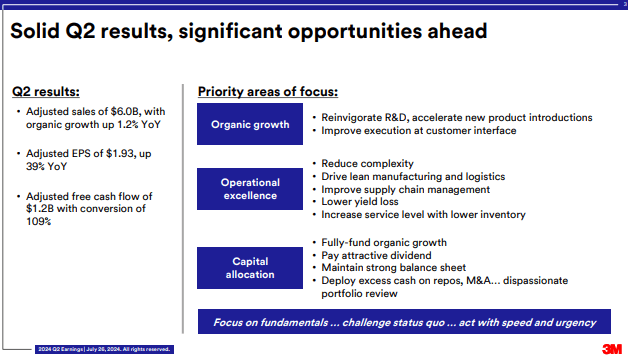
3M reported adjusted sales of $6.0 billion in Q2, which increased by only 1.2% YoY. Except for the Americas, sales in the other regions, including Asia Pacific, Europe, the Middle East, and Africa, were negative. Although on the good side, we can see an improvement in the adjusted operating margin and EPS. The company reported an adjusted operating margin of 21.6% and adjusted EPS of $1.93, reflecting strong operational excellence. The company attributes this operational excellence to lean manufacturing and logistics, robust supply management, lowering yield loss, and increasing service levels with low inventory.
3M Earnings Presentation
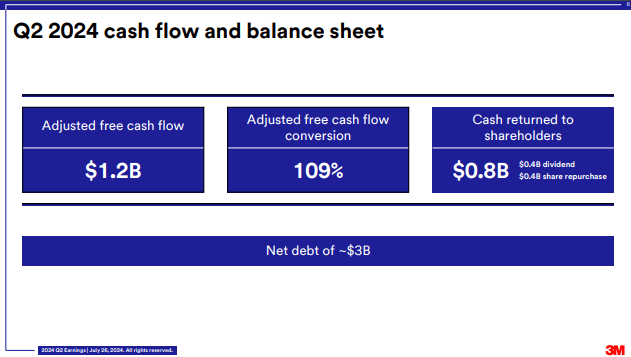
Its gross margin showed signs of improvement by standing at 42.9% in Q2 2024 compared to 40.7% in the same quarter last year. Adjusted FCFs were $1.2 Billion (19% of the revenue), and cash returned shareholders were $0.8 Billion, which includes $400 million as dividends and $400 million in stock buybacks. Although this number is slightly low, the cash return to shareholders in Q1 was $0.9 billion, which includes $0.8 billion in dividends.
3M Earnings Presentation
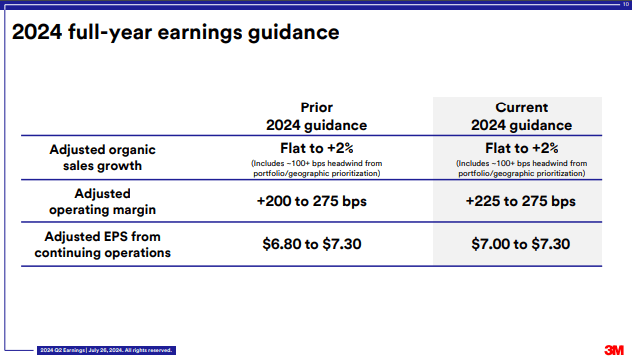
Full-year guidance shows organic sales growth to remain flat at 2%. I think the R&D advancement translation will need more time to fully reflect its effect. The company has increased its adjusted operating margin to +225 to 275 bps from +200 to 275 bps. It’s a good omen, reflecting the management’s confidence in the work in progress.
3M Earnings Presentation
Since the new CEO has just shown up to the scene this year. We should give some time to him that with the experience and skills he brings to the table, the company would be able to increase its profitability in the near future.
Effect of New CEO’s Appointment
On May 1st, 2024, 3M announced William Brown as the new CEO, substituting Michael Roman. He holds a mechanical degree and is the former CEO of L3Harris Technologies. As a former CEO of L3Harris Technologies, he brings much experience that could help the company optimize its full potential and eventually increase its profitability. During his tenure, the stock price surged significantly against the S&P 500, beating the market. He is focused on R&D and mentioned that the current spending of 4.5% by 3 M’s is too low if the company wishes to regain its innovative legacy. He has the required capabilities for the job but can’t assure the success of the company. Let’s see how things unfold.
Peer Comparison
3 M’s forward P/E ratio of 19.96 indicates it is lower than Hitachi (25.55) and Honeywell (21.13), having a forward P/E ratio of 25.55 and 21.13, respectively. But in comparison to Swire Pacific, it’s significantly higher. This shows that the 3M stock is trading at a reasonable valuation compared to Hitachi and Honeywell due to its earning potential. However, a higher P/E ratio compared to Smith’s Group shows that it is overpriced. This implies that the market has yet to value its earning potential. On the other hand, 3 M’s P/E ratio, based on the twelve months that followed, is 53.51. It is significantly higher than most of its peers, except Swire Pacific (3.35). This is due to its revenue, which has been consistent in Q2-2023 and Q2-2024. This sharp contrast with its forward P/E of 19.96 indicates that 3M expects a significant earnings rebound.
Its 3-year revenue growth is alarming in comparison to its peers. This could be attributed to the challenges the company faced recently related to increasing debt or legal risks from PFAS litigation. But its 5-year revenue growth is more positive, suggesting long-term stability.
3M’s high FCF margins and decent ROE show that the company remains profitable and efficient despite stagnant revenue. Its diversified business spread across a huge portfolio helped it to sustain its profitability. This helped it to return value to its shareholders by giving $400 million in dividends and utilizing $400 million in share repurchases. At this point, I think things are a bit too unclear, and I can’t say anything about its long-term stability due to the ongoing situation of stagnant revenue and FCFs. If the company doesn’t manage to restructure its operational efficiency, it won’t be able to sustain giving value to its shareholders in terms of dividends and stock buybacks in the future.
|
MMM |
HTHIY |
HON |
SWRAY |
SMGZY |
IEP |
|
|
P/E GAAP (FWD) |
19.96 |
25.55 |
21.13 |
9.5 |
13.91 |
NM |
|
P/E GAAP (TTM) |
53.51 |
29.41 |
23.51 |
3.35 |
24.01 |
NM |
|
PEG Non-GAAP (FWD) |
NM |
– |
2.57 |
– |
1.21 |
– |
|
PEG GAAP (TTM) |
NM |
NM |
2.77 |
0.01 |
1.77 |
– |
|
Price/Sales (TTM) |
2.33 |
2.12 |
3.62 |
1.16 |
1.91 |
0.55 |
|
Revenue 3 Year (CAGR) |
-2.08% |
3.68% |
3.21% |
-0.96% |
9.19% |
1.36% |
|
Revenue 5 Year (CAGR) |
0.30% |
0.52% |
-0.67% |
-0.56% |
4.63% |
1.94% |
|
Levered FCF Margin |
33.12% |
8.10% |
13.61% |
13.86% |
9.83% |
-10.42% |
|
Return on Equity |
24.31% |
11.20% |
32.74% |
9.32% |
10.78% |
-11.88% |
Valuation
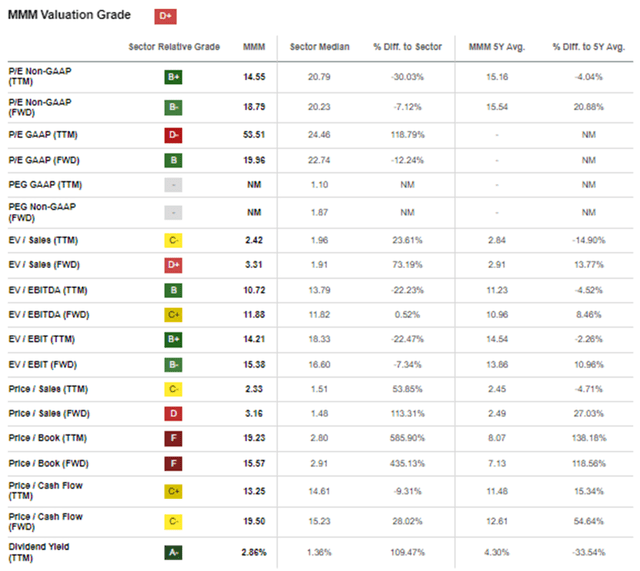
In the industrial sector, 3 M’s valuation presents a mixed scenario with opportunities and risks simultaneously. The company’s revenue growth is slow at the moment. Due to this, its TTM P/E (53.51) is significantly high as compared to the sector median of 24.46. However, its higher price-to-sales and price-to-cash flow ratios suggest that investors are willing to pay a premium for its revenue and cash flow. Investors are betting on the company’s vast portfolio and diversified business spread across different regions of the world. But it’s a huge risk, in my opinion, in case future growth falls below expectations.
Due to its diversified business, the company is generating enough revenue to sustain itself, but that’s not enough. Its positive effect can be seen in its favorable EV/EBITDA and EV/EBIT ratios. Both numbers fall below the sector median, indicating that the company is relatively undervalued in terms of earnings and cash flow metrics.
Seeking Alpha
From a cash flow perspective, 3 M’s Price/Cash Flow (FWD) of 19.05 is well above the sector median. This indicates that investors are willing to pay a premium for the cash flow the company will generate in the future. I believe this premium will only be justified if the company increases its revenue and profitability by making necessary operational changes. A company that has been standing since 1902 and diversified business across regions doesn’t deserve stagnant revenue. Meanwhile, its Dividend Yield (TTM) ratio is strong, standing at 2.86%. This could be appealing to income-focused investors. But as I discussed earlier, if the company doesn’t restructure its operational efficiency, it won’t be able to sustain its dividend payments in the future.
Risks
3M’s major challenge at the moment is its litigation and regulatory scrutiny related to Per- and polyfluoroalkyl substances (PFAS). PFAS are a group of chemicals used by industries in consumer goods since the 1950s. So much so that PFAS is used in various daily products. But their major downside is that it’s not environment-friendly and takes years to break down in the environment. It’s hazardous for both human health and the environment. The company aims to exit all PFAS manufacturing by year-end 2025. The company will have to pay a significant amount of money to pay fines, penalties, and settlements with $11.3 billion already charged.
The company’s long-term debt reached $20.6 billion in Q1, compared to $13 billion the previous year. In Q2, we saw a slight decrease in the long-term debt, but that’s still not efficient. The company needs to generate extra cash to pay its liabilities; otherwise, it won’t be able to spend money on business development.
Conclusion
At the moment, 3 M’s situation reflects both challenges and opportunities. It continues to leverage its diversified product portfolio and global presence; the decline in profitability, stagnant revenue growth, and increasing debt are causes for concern. The recent appointment of William Brown as CEO brings hope, especially with his focus on R&D and operational efficiency. However, the looming PFAS litigation, with $11.3 billion already charged and increasing debt, requires decisive action for the company to regain investor confidence and sustain returning value to shareholders. Its long-term success is dependent upon addressing these issues, as well as its ability to restructure operations.
Analyst’s Disclosure: I/we have no stock, option or similar derivative position in any of the companies mentioned, and no plans to initiate any such positions within the next 72 hours. I wrote this article myself, and it expresses my own opinions. I am not receiving compensation for it (other than from Seeking Alpha). I have no business relationship with any company whose stock is mentioned in this article.
Seeking Alpha’s Disclosure: Past performance is no guarantee of future results. No recommendation or advice is being given as to whether any investment is suitable for a particular investor. Any views or opinions expressed above may not reflect those of Seeking Alpha as a whole. Seeking Alpha is not a licensed securities dealer, broker or US investment adviser or investment bank. Our analysts are third party authors that include both professional investors and individual investors who may not be licensed or certified by any institute or regulatory body.
