Summary:
- I discuss the reasons underlying my decision to sell 3M Company stock – litigation liabilities, a rather weak balance sheet, deteriorating fundamentals, and a potential “stealth” dividend cut.
- With a starting yield of 4.8%, reallocating proceeds to generate at least a similar dividend income is a difficult task – value traps should be avoided at all costs.
- I decided to shift the bulk of my proceeds into CME Group Inc., Philip Morris International Inc., and Pioneer Natural Resources Company, which are leaders in their respective fields.
- I share my investment thesis on CME, PM and PXD stock and provide a brief look at their fundamentals.
- The new investments offer a combined dividend yield of 3.4% (4.8%+ including special dividends) and a weighted-average dividend growth rate of about 6%, which provides reasonable protection against inflation.
klenger
Article Scope
In this article, I explain the main reasons for my decision to sell 3M Company (NYSE:MMM) stock. I realized a paper loss of about 20% and received a tax credit that I used to offset taxes paid on dividend income and capital gains so far in the first half of 2023. This reduced my loss from 20% on paper to an actual loss of about 15%.
My 3M stock position represented about 1.6% of my total portfolio value at the time of the sale, most of which I reallocated to three stocks discussed in the second part of this article. Each of the three companies is a leader in its respective field.
CME Group Inc. (CME) is the world’s leading derivatives marketplace, Philip Morris International Inc. (PM) is the world’s leading manufacturer of modified risk nicotine products and combustibles outside the U.S., and Pioneer Natural Resources Company (PXD) is a uniquely positioned and leading Permian Basin drilling company with more than 20 years of high-return reserves.
Why I Sold 3M Stock
As a long-term buy-and-hold investor, I rarely sell stocks. However, in the case of 3M, which I have owned since 2020, after much deliberation I decided to sell my position after news of a tentative settlement related to the company’s PFAS (per- and polyfluoroalkyl substances, “forever” chemicals) litigation. These are the main reasons for my decision, in no particular order:
Reason 1: Litigation Expenses
Recently, 3M announced an agreement with U.S. public water suppliers under which the company will provide funding of up to $12.5 billion (gross value) to establish water treatment and testing facilities. However, while investors breathed a sigh of relief in an initial reaction, I think it is important to note that the settlement only affects water suppliers and does not extend to other commercial facilities, claims overseas (see, for example, this article on the situation in Belgium), or claims related to product liability. Nor should we forget the company’s ongoing Combat Arms litigation. In another article, I estimated the impact of litigation-related payments on 3M’s cash flow.
In the PFAS context, it is reasonable to assume that 3M will pay significantly more than the recently announced amount, due to still unresolved claims from overseas and domestic claims from other commercial entities or governmental bodies. Litigation related to product liability is a potential elephant in the room that cannot be quantified, but should be considered in light of the increasing media attention. However, given the inconclusive nature of the research, I would not overstate the impact at this time – PFASs have been manufactured for several decades and can be detected in the blood of approximately 98% of the U.S. population. Of course, should conclusive scientific evidence emerge in the future, these two aspects could be considered as an important negative argument.
It should also be remembered that the company’s business is cyclical and its leverage has increased significantly over the years and decades. Against this backdrop, the news related to the PFAS litigation, and what increasingly looks like the most predicted recession in modern history, a credit rating downgrade was to be expected. On June 23, Moody’s downgraded 3M’s long-term credit rating by one notch to A2. The negative outlook was maintained due to the agency’s “[…] expectation that payments relating to PFAS claims beyond the 2023 public water systems settlement, along with sizable resolutions in the Combat Arms litigation, will accumulate over the next few years.”
Reason 2: Balance Sheet Quality
Despite the fact that 3M’s leverage has only known one direction since the Great Recession – up and to the right – I would argue that the company’s balance sheet is still in an acceptable condition. However, considering that most of the increase in leverage was due to – rather poorly timed – share buybacks, the negative impact on financial stability could have been avoided. Of course, the buybacks are understandable from a management perspective – share buybacks have contributed about one-third of earnings per share growth over the past two decades.
While the debt-to-free cash flow ratio is not yet a real concern – keep in mind that the recent increase to about 3.0x was largely due to a temporary decline in free cash flow – it is worth keeping an eye on the upcoming maturities of 3M’s debt and the weighted-average interest rate. Short-term maturities are substantial (nearly $13.6 billion over the next 7.5 years) and the weighted-average interest rate for the mentioned amount and period is rather low (2.9%), so 3M should expect significantly higher debt service costs if interest rates remain higher for longer.
In this context, the upcoming spin-off of 3M’s healthcare segment is worth mentioning. Management plans to spin off the segment with a net leverage ratio of 3.0x to 3.5x EBITDA. Based on the segment’s latest EBITDA number ($2.44 billion in 2022), the standalone company will likely have to shoulder about $8 billion in debt. However, this does not mean that 3M will move a significant portion of its debt to the spun-off company, which may not even be legally possible due to the terms of the outstanding notes. Instead, the SpinCo will most likely assume debt equal to the above debt target, which will enable it to pay the expected $6.7 billion dividend to the parent. Despite the fact that 3M can use the proceeds to pay off debt and/or pay litigation costs, I believe the process will be a wash from a shareholder perspective. After all, it represents an indirect transfer of debt to the SpinCo, along with a significant portion of earnings power (about 28% of 2022 EBITDA).
I take a rather critical view of this move, especially in light of the fact that 3M only acquired a large part of its healthcare business in 2019 (Acelity, Inc., $6.7 billion enterprise value), which is now being spun off.
On a positive note, however, 3M is expected to retain a 19.9% stake in the SpinCo, which will be sold over time. Depending on the stock valuation of the new standalone company, 3M could generate cash flow of approximately $2.7 billion, assuming the SpinCo trades at the same price-to-sales multiple as 3M Company currently does.
Reason 3: Deteriorating Fundamentals
Given 3M’s cyclicality, profitability is also expected to follow a certain pattern. However, upon closer examination, 3M’s performance has deteriorated significantly in recent years, and comparatively more significantly than during the Great Recession. This is particularly evident in gross margin, return on invested capital (ROIC), and asset turnover (Figure 1). In addition, 3M’s cash conversion cycle suggests increasingly poor working capital management, but to be fair, one should not forget the recent impact of supply chain disruptions. That being said, for a company that operates in a variety of industries with a highly complex supplier network, it will take a lot of time and money to simplify and make the supply chain more robust. 3M recently announced actions that will “[…] reduce costs at the corporate center, further simplify and strengthen [the] supply chain structure, and streamline […] go-to-market business models […]”.
Figure 1: 3M Company (MMM): Gross margin, return on invested capital (ROIC), and asset turnover (own work, based on company filings)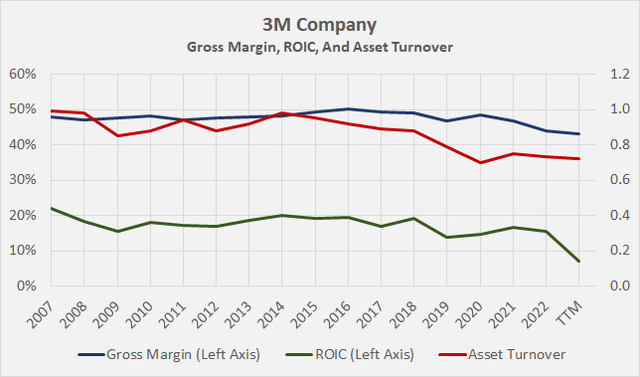
In light of the significant costs associated with litigation, deteriorating financial flexibility, and ever-increasing commercial competition, I certainly welcome these actions, but believe they were announced somewhat late and therefore do not cast 3M’s management in a good light. For this reason, and because of the decision to spin off a business unit, a significant portion of which was acquired only four years ago, I believe the board of directors should critically question the viability of management’s long-term plan. Of course, I dislike the fact that the CEO (Michael Roman) is also the chairman of the board of directors.
Reason 4: A Potential Dividend Cut
For the reasons stated above, and given the rather paltry dividend increases in recent years, I believe 3M Company could rebase the dividend.
At this point, I don’t think a dividend cut – on a combined SpinCo/RemainCo basis – is really necessary, but the company could use the healthcare spinoff to modify its dividend policy – a “stealth dividend cut”, if you will. In my view, the RemainCo dividend will decline by at least 25% to reflect the healthcare segment’s EBITDA contribution, despite the fact that 3M will receive about $6.7 billion from the yet-to-be-named SpinCo. In the long run, a dividend that currently costs about $3.4 billion is not sustainable for the parent.
Granted, the SpinCo could pay a dividend, but it is not inconceivable that management will prioritize debt reduction over a dividend, given the company’s pronounced post-transaction leverage ratio of 3.0x to 3.5x EBITDA (in the press release linked above, management identified deleveraging as a top priority). In the press release detailing the settlement with public water suppliers, management emphasized “cash flow needs under this agreement and other contractual commitments and obligations“. And while I wouldn’t read too much into that statement, it’s often these subtle statements that are the first clues to an impending dividend cut.
How I Reallocated The Proceeds From The Sale Of My 3M Position
CME Group Inc. (CME)
A starting yield of about 4.8% (my average price for MMM stock was $125) is not easy to replace. I don’t want to chase yield and risk investing in a value trap with a dividend that may not be sustainable. Finally, one of my key investment objectives is to create a portfolio with a weighted-average dividend growth rate that is at least equal to my personal rate of inflation.
In this regard, CME Group Inc. is an excellent fit. The company is the world’s leading derivatives marketplace and owns and operates the Chicago Mercantile Exchange, CME Clearing, the Chicago Board of Trade (CBOT), the New York Mercantile Exchange and the Commodities Exchange (NYMEX and COMEX). It offers benchmark products in the categories of interest rates, equity indices (e.g., E-mini futures on the S&P 500, Nasdaq-100, Dow Jones Industrial, and Russell 2000), energy (e.g., WTI crude oil), agricultural commodities, foreign exchange, and metals. The primary exposure is to interest rate and equity index derivatives. The company generates most of its profits through the collection of clearing and transaction fees. Although it plays an important role in the exchange of derivatives, its exposure in the event of a counterparty default is limited to a three-digit million amount, with the remainder borne by a guarantee fund maintained by the counterparties.
CME’s balance sheet is very solid, with low debt, a balanced maturity profile and a very conservative interest coverage ratio. The company has a long-term credit rating of Aa3 with a stable outlook, which was affirmed in November 2022. Moody’s cited “consistent delivery of exceptionally strong profit margins via its widely diversified derivatives product offerings, global scale and conservative financial and strategic policies” in its ratings rationale.
With its large ecosystem and the trust it has built with its customers around the world, CME benefits from significant lock-in and network effects. The business model is easily scalable and reasonably recession resistant. All in all, it is no wonder that CME Group can boast very high profitability – around 50% free cash flow margin since 2018 is a great performance (Figure 2). If there is anything to criticize, it is the steadily declining average rate per contract (RPC) – essentially, CME is earning less and less on each transaction. However, the declining RPC should be viewed in the context of the steadily increasing average daily volume (ADV) that contributes to the overall strength of CME’s ecosystem. The lower RPC is also due to the newer micro E-mini futures, but it is important to remember that these are relatively more expensive than the classic E-mini futures.
Those interested in a deeper dive into CME’s business model, balance sheet quality and investment-related risks should take a look at the article I published in March.
Figure 2: CME Group Inc. (CME): Free cash flow and free cash flow margin, adjusted for stock-based compensation and normalized with respect to working capital movements (own work, based on company filings)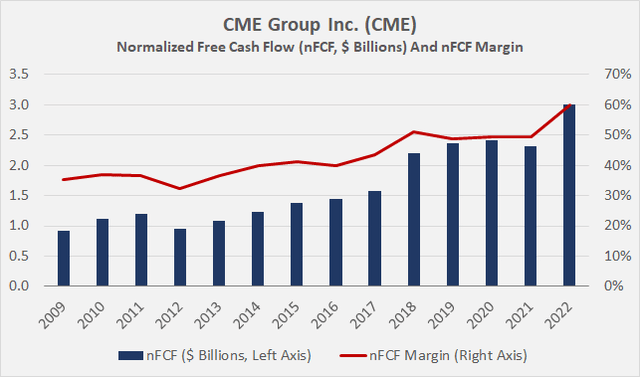
I own CME as a “risk management” position. With higher volatility and dynamic interest rate markets, the company’s products are in high demand. Of course, that doesn’t mean CME stock won’t fall dramatically in a stock market crash, but the decline is expected to be short-lived. Ultimately, I take a long-term view and focus on a growing stream of dividend income. Take, for example, the financial crisis of 2008/09 – CME stock lost about three-quarters of its value from peak to trough. However, in February 2008, the company declared a 34% increase of its regular quarterly dividend, and in June, a special dividend of $1.00. In 2009 and 2010, CME paid a quarterly dividend of $0.23, and in February 2011, it increased its regular dividend by 22%. CME’s dividend growth (excluding special dividends) has been 16% on a CAGR basis since 2006. In recent years, dividend growth has slowed somewhat, but is still very solid at nearly 11% (5-year CAGR). In early 2023, CME increased its quarterly dividend by 10%. With three-year average free cash flow of about $2.6 billion, the company’s payout ratio is only about 15%, leaving ample room for dividend growth. However, it is now the rule rather than the exception for CME to pay a special dividend at year-end. For example, the company declared a variable dividend of $4.50 in December 2022, bringing the dividend yield to nearly 5% at a share price of $180. Of course, and despite the fact that CME has declared a variable special dividend every year since 2012 (Figure 3), I won’t include the special dividend in my projected annual dividend income, but the more-or-less regular additional income is still nice to see. Ignoring the special dividend, CME stock currently trades at a dividend yield of 2.4%, which is almost 40% higher than the average dividend yield over the past five years.
Figure 3: CME Group Inc. (CME): Ordinary quarterly and variable dividends declared each year (own work, based on company filings)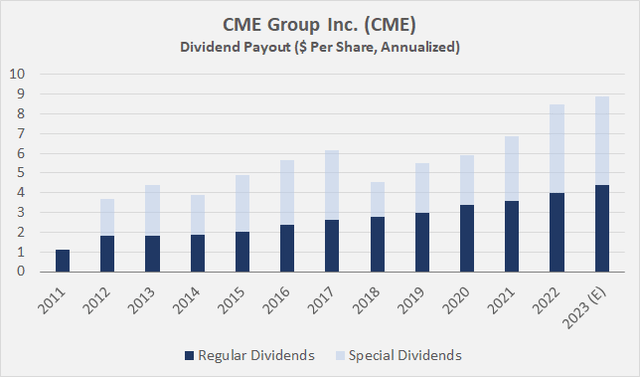
A blended price-to-earnings ratio of 22 (price-earnings-growth ratio of 1.75), on the other hand, suggests that the stock is not cheap from an adjusted earnings perspective (Figure 4), but I think CME deserves such a premium because of its wide economic moat, very robust balance sheet, reliable cash flows, and very secure dividend. From a discounted cash flow perspective, the stock looks expensive at first glance (4% implied perpetual growth rate at an 8% cost of equity). However, CME – organically and through acquisitions – has grown its free cash flow at a CAGR of nearly 10% since the Great Recession, so I don’t think 4% implied growth is too optimistic. As the world’s leading exchange operator, I am very confident in CME’s pricing power, network effects, and scalability.
Figure 4: CME Group Inc. (CME): FAST Graphs chart based on adjusted operating earnings per share (FAST Graphs tool)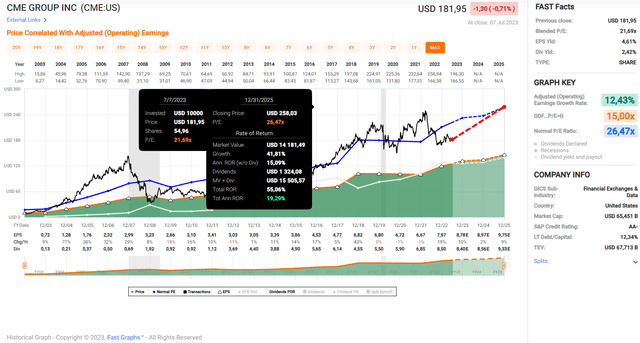
Pioneer Natural Resources Company (PXD)
Now, I do realize that by deciding to shift some of my 3M sale proceeds into shares of Pioneer Natural Resources Company, I might come across as a procyclical yield hunter. PXD is definitely not cheap, according to Seeking Alpha’s valuation metrics (Table 1). And while the FAST Graphs chart in Figure 5 suggests plenty of upside potential, I contend that we are definitely far from what can be called the bottom of the cycle and that a recession is probably upon us. What was I thinking?
Table 1: Pioneer Natural Resources Company (PXD): Valuation metrics, their sector medians, and five-year average valuations (Seeking Alpha) Figure 5: Pioneer Natural Resources Company (PXD): FAST Graphs chart based on adjusted operating earnings per share (FAST Graphs tool)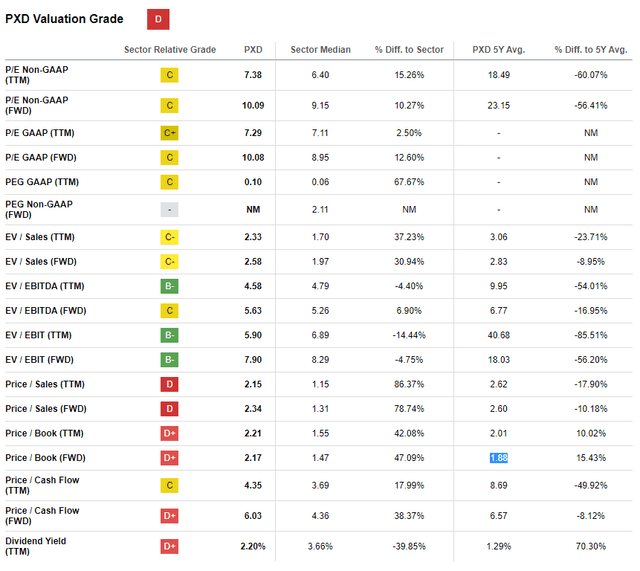
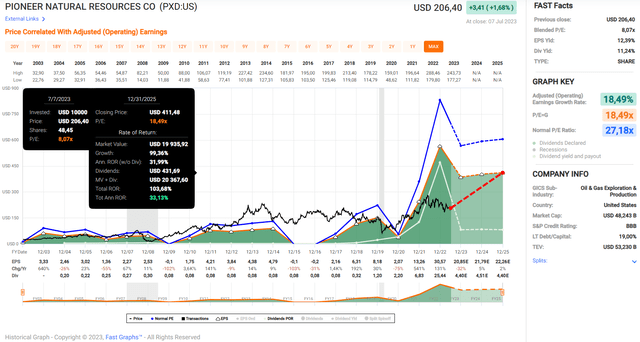
The price of oil has fallen quite a bit since the invasion of Ukraine and is now quite close to the long-term average for the period 2006 to 2022. Granted, in a recession the price of oil can fall even further, but I would argue that Mr. Market has already factored this in as this is probably the most anticipated recession in modern history. In my view, we are in for a new supercycle, but with very high volatility due to uncertainties in supply, capex financing (e.g., difficult lending environment) and, of course, policy (e.g., outright development restrictions). I plan to discuss my outlook for the fossil fuel industry in a separate article.
Given the potential for an increasingly difficult credit environment – not only due to higher interest rates, but more importantly due to ESG-related restrictions on lending – I believe it is critical to invest only in oil and gas companies with very strong balance sheets. To be sure, however, the situation in the U.S. is luckily not comparable to that in Europe (where major banks have cut financing to fossil fuel companies by 27.6% since 2021, in part due to new funding policies). While I will not go into this difficult topic in this article, I strongly believe that limiting exploration and development investment through credit constraints is not the right path to a greener future. At the very least, lower investment can be expected to lead to higher prices and possibly lower resilience. Consider, for example, APA Corp’s (APA) decision to suspend drilling in the North Sea and reduce its workforce in the U.K. due to unfavorable tax and regulatory regime.
In my view, oil and gas companies are very different companies today than they were before the 2014-2016 oil price slump and the pandemic in 2020. The U.S. shale boom, high capital spending, low interest rates, and consequently poor returns on capital (“drill baby drill” mentality), followed by the price collapses in 2014-2016 and 2020 have ultimately made the companies that have survived much more resilient.
In this context, Pioneer Natural Resources is an excellent example. The company is fully focused on the Midland Basin (West Texas), which is the largest component of the Permian Basin and requires relatively lower drilling capex than other regions. I appreciate it when companies focus on their main area of expertise – and PXD’s focus on the Midland Basin can’t be argued away when you know that the company acquired most of its acreage long before the shale boom. Its broad presence in the area allows the company to maximize its output through long lateral sections. Granted, the tendency to extend wells laterally is not new, but with more than 1,000 wells with a lateral section of more than 15,000′ expected to be placed on production in 2023 (about 20% of the total 2023 program), PXD is definitely very well positioned. The company claims to have more than 20 years of high-reserve inventory (slide 15, Q1 2023 presentation), making it the safest bet among peers. PXD is committed to rather slow growth, with annual output growth of about 5%.
At PXD, investors are directly exposed to the oil price, as the company’s management does not hedge its price structure. Given the company’s solid balance sheet (see below), low break-even price of around $40 per barrel, and high inventory levels, I actually welcome this somewhat unusual business practice. Depending on how you view the future of fossil fuel prices, PXD may be an excellent or rather poor investment. As mentioned earlier, I believe we are in the early stages of a new (volatile) supercycle, so I welcome the fact that the upside is not capped. At the same time, I have no problem with the dividend payout (to which PXD remains very committed) being skewed significantly toward a variable component. At an oil price of $80 per barrel, PXD generates free cash flow of about $5.4 billion per year, so management’s guidance of over $4.0 billion for the first half of 2023 looks very realistic. Of course, due to the higher price of oil in 2022, PXD generated much higher free cash flow of over $7 billion that year, of which $6.3 billion was distributed to shareholders via dividends. The strong cash position at the beginning of the year also allowed management to repurchase $1.7 billion worth of shares and pay down $2.6 billion in long-term debt.
The decision by rating agency Moody’s to upgrade Pioneer’s long-term credit rating by one notch to Baa1 in November 2022 is quite understandable, in my view. With currently expected 2023 free cash flow, it would take the company only 14 months to pay off all of its current net debt ($4.7 billion at the end of the first quarter of 2023). Measured by EBITDAX (EBITDA before exploration and related costs), PXD’s leverage ratio is expected to be about 0.5 at the end of 2023. The company has been repaying its higher cost debt over the last two years and therefore benefitted from a weighted-average interest rate of only around 1.6% on its outstanding debt at the end of 2022. The maturity profile (Figure 6) is extremely comfortable, but it should be added that the company recently redeemed its 0.550% 2023 notes with new debt at a coupon of 5.100%. This raises Pioneer’s weighted-average interest rate to 2.5%, which is still very low for an oil and gas company.
Figure 6: Pioneer Natural Resources Company (PXD): Debt maturity profile and weighted-average interest rates at the end of 2022 (own work, based on PXD’s 2022 10-K)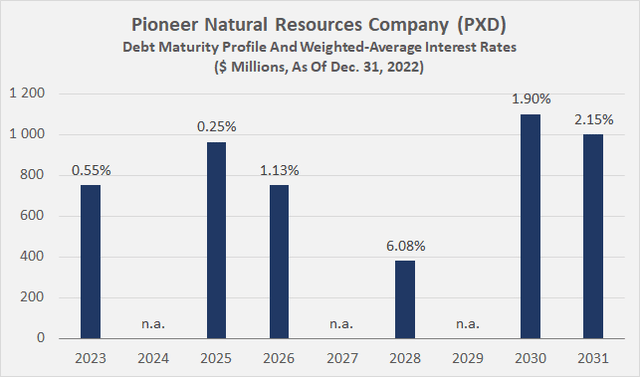
In the context of dividends, PXD’s current 2.4% base dividend yield sounds rather meager, but as I mentioned earlier, the company’s payout is heavily weighted toward a variable component. Since I hold PXD in a diversified portfolio of mostly non-cyclical or moderately cyclical dividend payers, I don’t mind a temporarily lower payout. That way, the company can conserve capital during the next cyclical trough without having to either cut its regular dividend or, worse, pay the dividend with borrowed money.
If the oil price stays in its current window, PXD investors can expect dividends of about $8 per share per year (4% dividend yield) and a reduction in the number of shares outstanding of about 4% per year in the theoretical best-case scenario (100% of free cash flow returned to shareholders). The lower the number of shares outstanding, the more meaningful the buybacks become, and the more room there is for higher dividends. Of course, the weighting of share repurchases and dividends is at the discretion of PXD’s board of directors, but the company currently remains committed to returning at least 75% of free cash flow to shareholders.
I believe PXD is an excellent long-term investment in the current environment and a welcome addition to a diversified “all-weather” equities portfolio. PXD’s top position in the Permian Basin, disciplined management and rock-solid balance sheet also make it an ideal pick in the context of ESG-related lending restrictions, tighter lending standards or political risk. Let’s face it, a future in which the Western world continues to prosper is only possible with abundant and secure fossil fuel energy available at a reasonable price. But I don’t want to be misunderstood, I’m all for more efficient extraction technologies, and less pollution (e.g. methane emissions) on the way to more sustainable energy sources – I’ve just come to the conclusion that a meaningful transition is not possible without fossil fuels, which seems to be the plan in some parts of Europe.
Finally, I would like to add one caveat, namely the comparatively short capex cycle of shale producers such as PXD. In this context, consider the steadily declining number of wells drilled but not yet completed (Figure 7), which suggests that shale producers are likely to report higher capex in the future to avoid eating up too much of their “inventory”. Of course, shale producers only have an incentive to drill new wells at least close to production if the oil price justifies the capital outlay, i.e., if a deep recession is avoided.
Figure 7: Drilling Productivity Report – Total drilled but uncompleted wells (generated with YCHARTS – I: DPRRTDUW)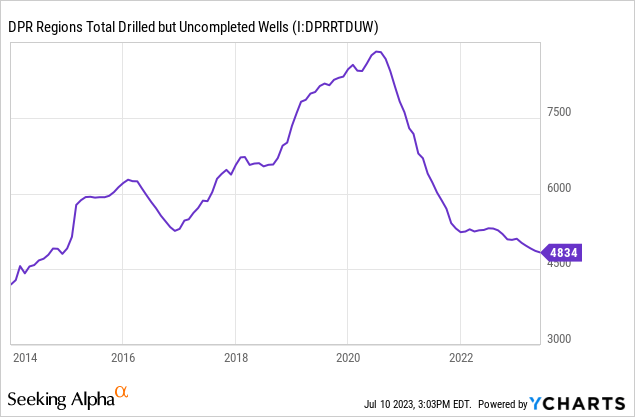
Philip Morris International Inc. (PM)
Last but not least, I bought more shares of Philip Morris International Inc. In my earlier articles, I gave the stock a “hold” rating due to its comparatively high valuation. However, I took advantage of the roughly 10% drop in the share price to nearly $90 in late May/early June to add to my already large position.
I maintain that British American Tobacco p.l.c. (BTI, OTCPK:BTAFF) is currently the best tobacco stock from a risk/reward perspective in my opinion (current P/E of 7, 13.5% free cash flow yield, see my last article), but I recognize that PMI is well ahead in the modified risk segment, and I very much appreciate the strategic move of re-entering the U.S.
I won’t go into detail in this article about the company’s admirable strategic moves in its modified risk products segment, and instead ask you to refer to my last article, published just before the company’s first quarter earnings report. In short, the company has invested heavily to re-enter the U.S. market. It acquired Swedish Match for about $14.0 billion (net of cash), instantly becoming the market leader in oral nicotine products in the U.S. PMI, however, will soon be back in the U.S. with more than just oral nicotine products. The company has likely now paid the full $2.7 billion plus interest to Altria Group Inc. (MO) to grant it exclusive marketing rights to IQOS in the U.S. after the original agreement expires in April 2024. As a result, PMI benefits from the 2020 Modified Risk Tobacco Product (MRTP) authorization for IQOS, but the company also expects to file a Premarket Tobacco Product Application (PMTA) for IQOS ILUMA – the induction-based successor that no longer infringes British American’s patented technology – in the second half of 2023.
PMI is well on its way to achieving its self-imposed goal of becoming a majority smoke-free company by 2025 – despite Russia and Ukraine being former top growth markets for its heated tobacco product IQOS. I think this is a very strong achievement, especially compared to #2 – British American Tobacco – which expects only £5 billion in “New Categories” revenue by 2025 – or about 17% of total net revenue, assuming flat cigarette revenue. To be fair, it should be added that the company excludes traditional oral nicotine products (i.e., moist and traditional snuff, Granite, Mocca, Grizzly, Kodiak, Camel, and Lundgrens brands) from this category, which would increase the revenue share of modified risk products to over 20% of total net revenue by 2025.
There is no doubt that PMI management’s recent actions are paying off, as is the continued substantial investment in its own business (see this article), but they have obviously come at a significant cost. While I don’t think PMI overpaid for Swedish Match, the quality of its balance sheet has deteriorated significantly – at least in absolute terms. Compared to the end of Q1 2022, PMI’s net debt has increased by a whopping 81%, from $24.7 billion to $44.7 billion. However, it is important to remember that the company has very high profitability and regularly generates annual free cash flow of $10 billion or more, not even including the contribution from Swedish Match (likely well over $500 million with strong growth). Since PMI pays out about 70% to 80% of its free cash flow in dividends, debt reduction will take considerable time, but given the company’s recession resilience (after all, it’s a tobacco company), this level of debt is still manageable. This is also reflected in its solid A2 long-term credit rating and stable outlook (last affirmed in November 2022), which puts PMI ahead of its peers (A3 for Altria Group, and Baa2 for British American Tobacco). However, investors should get used to the fact that dividend increases will be rather modest over several years to facilitate debt repayment, but this has been openly communicated by management.
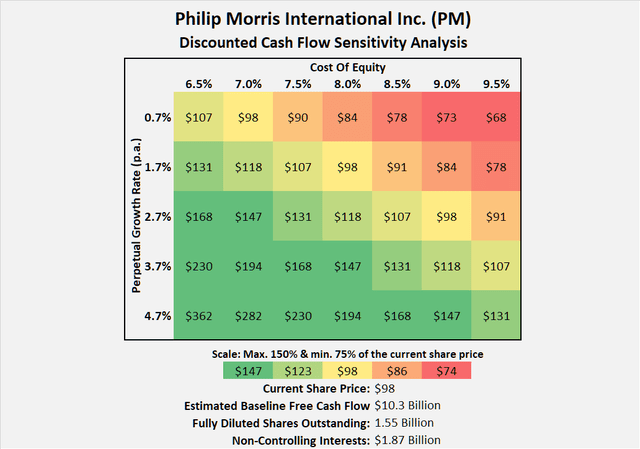
Considering that PMI stock has recovered nicely from its recent low of $90, one could argue that the shares are no longer a buy at a price near $100. Even at $90, the shares were not what I would call a steal, but given the comparatively solid growth prospects, I found it acceptable to add to my position at a 15x earnings multiple, or a 7.4% free cash flow yield based on average free cash flow for 2020 through 2022, including a $500 million contribution from Swedish Match. However, it should be remembered that PMI’s free cash flow has been significantly impacted by large capital expenditures (long-term average capital of $1.0 billion per year), and this burden should ease once the company fully establishes its modified risk products segment (heated tobacco sticks are even more profitable than conventional cigarettes). PMI stock currently trades at 16 times blended earnings (Figure 8), or a free cash flow yield of about 6.8%. From a discounted cash flow perspective, PMI’s current share price implies a perpetual growth rate of about 1.7% at a cost of equity of 8.0% – not what I would call cheap, but acceptable given the company’s position (Figure 9).
Figure 8: Philip Morris International Inc. (PM): FAST Graphs chart based on adjusted operating earnings per share (FAST Graphs tool) Figure 9: Philip Morris International Inc. (PM): Discounted cash flow sensitivity analysis (own work, based on company filings and own calculations)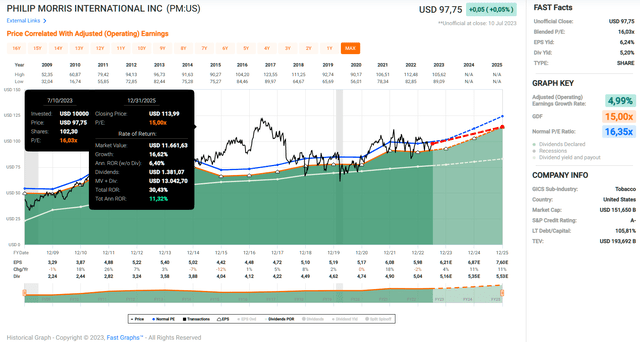
Concluding Remarks
I sold 3M – at a loss of about 20% – due to its significant (and, in my opinion, not yet properly discounted) litigation liabilities, comparatively weak balance sheet (largely due to poor capital allocation), deteriorating fundamentals, and finally a potential dividend rebasement that I expect to be announced as part of the healthcare spin-off.
I had to reallocate about 1.6% of my portfolio value, not including the tax credit I received in the process of realizing a 20% paper loss. I wanted to replace what I no longer consider a leader in its field with three companies with solid fundamentals and good long-term prospects. CME Group, the world’s leading derivatives marketplace; Philip Morris International, the global leader in modified risk products and combustible products outside the U.S.; and Pioneer Natural Resources, the uniquely positioned and leading operator in the Permian Basin with more than 20 years of high-return reserves.
Excluding special dividends, an equal-sized position in CME, PM and PXD currently equates to a dividend yield of 3.4% and a weighted-average dividend growth rate of 17.5% (27% on a five-year CAGR basis). While the growth rate in particular sounds enticing compared to 3M’s token increases, it should not be over-interpreted due to PXD’s recent performance. Recall that the strong free cash flow is only a consequence of the current environment and the company was barely able to pay a dividend five years ago. If PXD’s long-term sustainable dividend growth is assumed to be 5% per year, an equally weighted position of these three stocks would still give rise to an annual growth rate of 5.5% (6.0% five-year CAGR), which is reasonable protection against the erosion of purchasing power due to inflation. However, like PXD’s high dividend growth, PMI’s slow dividend growth (1.6% and 3.5% based on one- and five-year CAGRs, respectively) should not be over-interpreted – given the current prioritization of debt reduction and comparatively high capex over the past decade.
When factoring in the special dividend from CME (assuming the 2022 level is maintained) and a $4 special dividend from Pioneer (quite realistic based on the current free cash flow guidance), the dividend payout would actually equal the dividend income I lost by selling my position in 3M. While I believe that dividend certainty should not be over-interpreted due to the variable nature of special dividends and the cyclicality of PXD’s earnings, I nonetheless feel very comfortable having diversified my 3M proceeds into these three stocks from an income perspective as well. The long-term prospects of CME, PM and PXD are very solid, as each stock is the leader in its own segment.
As always, please consider this article only as a first step in your own due diligence. Thank you for taking the time to read my latest article. Whether you agree or disagree with my conclusions, I always welcome your opinion and feedback in the comments below. And if there’s anything I should improve or expand on in future articles, drop me a line as well.
Editor’s Note: This article discusses one or more securities that do not trade on a major U.S. exchange. Please be aware of the risks associated with these stocks.
Analyst’s Disclosure: I/we have a beneficial long position in the shares of PXD, MO, BTAFF, PM, CME either through stock ownership, options, or other derivatives. I wrote this article myself, and it expresses my own opinions. I am not receiving compensation for it (other than from Seeking Alpha). I have no business relationship with any company whose stock is mentioned in this article.
The contents of this article and my comments are for informational purposes only and may not be considered investment and/or tax advice. I am neither a licensed investment advisor nor a licensed tax advisor. Furthermore, I am not an expert on taxes and related laws – neither in relation to the U.S. nor other geographies/jurisdictions. It is not my intention to give financial and/or tax advice, and I am in no way qualified to do so. I cannot be held responsible and accept no liability whatsoever for any errors, omissions, or for consequences resulting from the enclosed information. The writing reflects my personal opinion at the time of writing. If you intend to invest in the stocks or other investment vehicles mentioned in this article – or in any form of investment vehicle generally – please consult your licensed investment advisor. If uncertain about tax-related implications, please consult your licensed tax advisor.
Seeking Alpha’s Disclosure: Past performance is no guarantee of future results. No recommendation or advice is being given as to whether any investment is suitable for a particular investor. Any views or opinions expressed above may not reflect those of Seeking Alpha as a whole. Seeking Alpha is not a licensed securities dealer, broker or US investment adviser or investment bank. Our analysts are third party authors that include both professional investors and individual investors who may not be licensed or certified by any institute or regulatory body.
