
Summary:
- Fund manager Cathie Wood made headlines with her $2,600 5-year price target for Tesla, Inc., with a best-case scenario of $3,200, 17X upside by 2029.
- Her thesis is that 90% of Tesla’s value will come from licensing its self-driving tech, thus capturing much of the $9 trillion revenue of the robotaxi industry by 2030.
- Robotaxis will likely cost $150K to $200K each, and building a global fleet would cost over $35 trillion. Only Amazon and Alphabet’s Waymo have the necessary cash flow.
- Amazon’s current consensus free cash flow of 41% through 2029 justifies a 300% return, or $965 per share, within five years. It could boost your income growth by 2% to 4% through annual rebalancing.
- If Cathie Wood is right about robotaxis, Amazon’s potential upside, through its Zoox subsidiary, is as high as 18X in the best-case scenario, higher than Tesla’s (9% faster income growth). And if robotaxis fail, Tesla is in trouble (according to CEO Elon Musk). Amazon investors still own Amazon, which is expected to generate $700 billion in free cash flow through 2029.
PM Images
Cathie Wood is renowned for her, let’s say, somewhat optimistic forecasts on Tesla, Inc. (NASDAQ:TSLA).
Cathie Wood’s Tesla Price Forecasts For 2029
- Bear Case Target: $2,000 per share by 2029 (25th percentile outcome)
- Base Case/Expected Value Target: $2,600 per share by 2029 (50th percentile)
- Bull Case Target: $3,100 per share by 2029 (75th percentile outcome).
Cathie Wood’s eye-popping bullish case on Tesla is a 17X return over the next five years, or 76% annual return potential.
We think that the robotaxi opportunity, globally, will deliver $8 to $10 trillion in revenue by 2030.” – Cathie Wood.
An ARK Invest report from February 2024 highlighted that they see robotaxis “transforming global transport with point-to-point transportation to be available in nearly every country at an average price of ~$.50 per mile.” They project that robotaxis will have traveled 13 trillion vehicle miles by the late 2030s.
Let me show three reasons her $2,000 “bear case” is likely highly inflated. Even if Ms. Wood is correct about robotaxis as a massive potential future market, Tesla isn’t expected to dominate it.
Reason One: The Economics Of Robotaxis Don’t Make Sense Under Her Scenario
Let’s do some quick math to see how reasonable it might be to think that by 2030, transportation as a service will become wildly adopted by millions.
The U.S. Department of Transportation’s Federal Highway Administration (FHWA) states that the average person drives around 13,476 miles annually.
- NerdWallet: The average annual cost of owning a new vehicle driven 15,000 miles a year was $12,182 in 2023 or $1,015 monthly.
- Bankrate: In 2022, the average annual cost of car ownership was $10,728, which increased to $12,182 in 2023.
- AAA: The average annual cost of new vehicle ownership in 2023 was $12,182, or $1,015 monthly.
So, if Tesla could offer a robotaxi subscription service at $0.50 per mile, the average American would have to spend about $500 monthly to replace their car with a robot-taxi.
But here’s the rub: Americans love their cars. It doesn’t make sense for the average family of 3.13 people to have 2.28 cars, yet we do it anyway.
In other words, the average family of 3 to 4 people has 2 to 3 cars, which cost $2K to $3K per month, the 2nd largest expense for the family.
The average car is idle 95% of the time, indicating this is a potential game-changer in cost savings and increased efficiency. Still, it must overcome a deeply ingrained cultural bias slanted toward individual car ownership.
To make robotaxis a dominant form of transportation and achieve an $8 to $10 trillion market size, robotaxis must provide an overwhelming economic and convenience benefit.
Is a 50% discount on car ownership cost enough? I don’t think so, even if Tesla has another problem.
Reason 2: Tesla Can’t Afford To Be The Amazon Of Robotaxis
ARK Invest estimates that the upfront investment per robotaxi vehicle is around $150,000, assuming a 5-year useful life. This translates to an annual depreciation cost of around $32,000 or $90 daily.
OK, but ARK is betting its credibility and possibly the company’s future on robotaxis. What about other estimates?
Cruise’s self-driving Chevy Bolt EVs cost between $150,000 to $200,000 per vehicle to outfit with the necessary autonomous driving technology.
With a cost of about $175K per vehicle, it would likely cost at least $1 per mile for a robotaxi subscription, assuming Tesla’s $0.50 per mile fee is 50% of revenue.
If a company isn’t getting at least 50% of sales, it would be unlikely to license FSD from Tesla.
That’s because whoever licenses Tesla’s tech has to pay for the enormous robotaxi fleet.
Transportation As A Service: The Ultimate Wide Moat Business
The ultimate value of transportation as a service would be to own the fleet and sell subscriptions to consumers, a family plan, say, $100 per family, for unlimited rides.
Imagine being able to hit a button on your phone or AI glasses, or pin, or whatever future AI tech is most common, “I need a ride,” and within 5 minutes, you have a robotaxi at your disposal.
Suppose you could achieve such convenience at a 90% discount to what you spend on a car today, saving $900 per month on average. In that case, this would result in the solid adoption of robotaxi, which would probably be the majority of transportation.
But that would require a global fleet of taxis. How large?
As of 2024, there are approximately 1.475 billion vehicles worldwide, including passenger cars, trucks, and buses.
The occupancy rate or vehicle occupancy is a critical factor. Higher occupancy means fewer robotaxis are required to service the same travel demand. Boston Consulting Group reports that the average taxi occupancy is around 1.2 passengers, but robotaxis might be able to go as high as 2.
For a significant city like New York with 8 million residents, even assuming 20% simultaneous demand at peak hours, we’d need around 800,000 robotaxis for prompt 5-minute service with that occupancy.
For the global population of around 8 billion, even a 5% simultaneous peak demand would require around 200 million robotaxis globally.
Allowing a 30% redundancy factor for peaks/maintenance, a reasonable global robot-taxi fleet size could be around 260 million vehicles.
In other words, one robotaxi might be able to replace 5.6 vehicles since the average car is idle 95% of the time.
For this calculation, let’s assume a median cost of $175,000 per robotaxi vehicle based on cost estimates from Waymo, ARK, and Cruise.
To build a fleet of 260 million robotaxis at $175,000 each:
Cost = 260,000,000 vehicles x $175,000 per vehicle= $45.5 Trillion.
That’s $46 trillion to build out a global robotaxi fleet.
How many companies could hope to fund even a fraction of that? Not Tesla.
FactSet Research Terminal 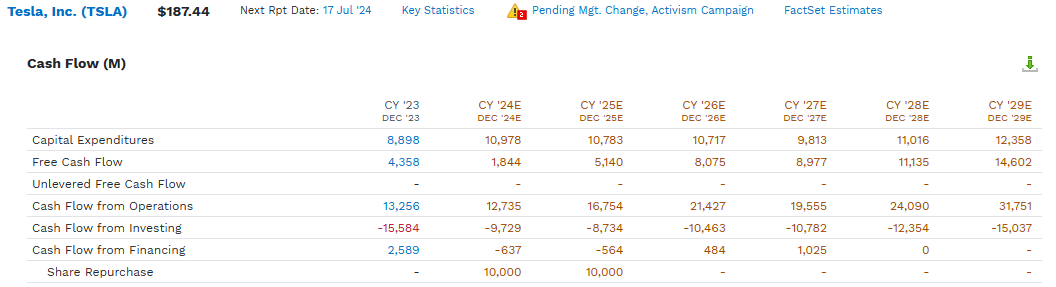
Tesla’s free cash flow is expected to hit $14.6 billion in 2029 and just $12 billion in capex spending.
Tesla can’t spend or raise the funds necessary for a robotaxi fleet.
Imagine that Tesla can 10X thanks to robotaxi/AI mania. In 2020, CEO Elon Musk raised a lot of money for Tesla to build out its Gigafactories, thanks in large part to the post-pandemic stimulus speculative gold rush.
The perfect storm was created by $9 trillion in stimulus, money printing, and “free money forever,” combined with parabolic growth in Tesla sales and Elon’s charismatic international roadshow.
In 2020 alone, Tesla raised $7 billion in secondary stock offerings, including $5 billion worth of stock sales in December 2020 alone.
What was happening in December 2020?
The COVID vaccines had been approved, everyone was flush with stimulus cash, the economy was growing at 10%, a 3rd round of stimulus checks were promised, Tesla was growing like a weed and supply constrained, and Elon was at the height of his popularity.
Today, none of these things are true. But let’s say that Elon can somehow capture lighting in a bottle again. Tesla 10X to a $6 trillion market cap, driven by absurd levels of AI/Robotaxi mania.
In December 2020, at the peak of the mania, Tesla had a market cap of just under $800 billion, and $5 billion in dilution represented less than 1%.
Let’s imagine Elon can hype TSLA to $6 trillion and then do a $60 billion secondary.
That would be 0.75% of the cost of building a global robotaxi fleet.
At today’s $600 billion market cap, Tesla might be able to raise $3.75 billion in a secondary, at the same 0.625% shareholder dilution we saw in December 2020.
That assumes that the August Robotaxi presentation will be a smashing success and will reinvigorate Tesla’s share price’s animal spirits.
Companies like Uber (UBER) would have built the robotaxi fleet, at a cost of $46 trillion or so, to replace all vehicles, and Tesla would get $0.50 per mile.
Uber would have to charge $1 per mile, or just over $1,000 per month for a subscription to its robotaxi service.
Would the average car-loving American give up their wheels for no economic benefit?
I think not.
Reason Three: Amazon Or Alphabet Can Afford To Be The Amazon of Robotaxis
We’ve seen how the cost of robotaxi fleets is enormous because our 1.5 billion vehicle install base took over 120 years to build.
Amazon Is Expected To Have $500 Billion In Net Cash By 2029
FactSet Research Terminal 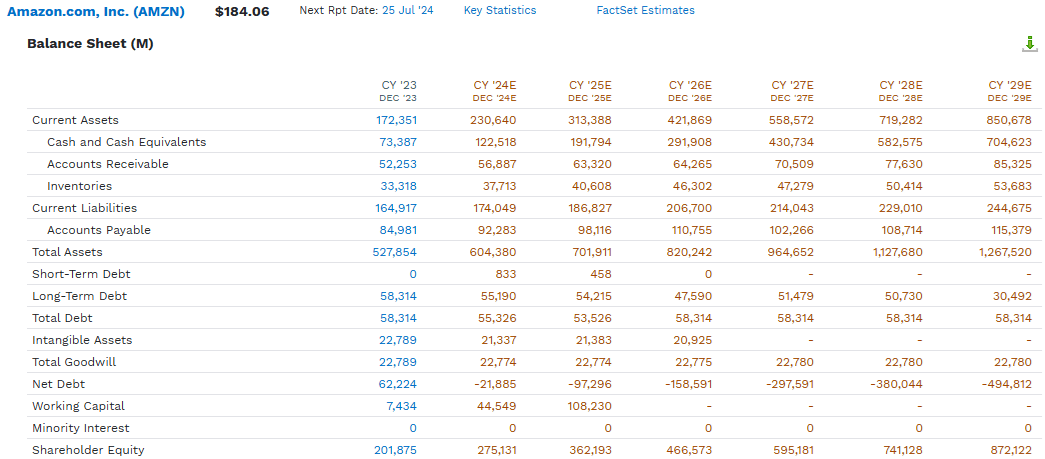
The current analyst consensus is for $705 billion in cash and $495 billion in net cash by 2029.
And that’s after spending over $1 trillion on growth.
Amazon Growth Spending Consensus
| Year | Amazon R&D (Millions) | Amazon Capex (Millions) | Total Growth Spending (Millions) |
| 2024 | $87,166 | $62,478 | $149,644 |
| 2025 | $97,433 | $68,367 | $165,800 |
| 2026 | $107,210 | $65,861 | $173,071 |
| 2027 | $108,552 | $73,063 | $181,615 |
| 2028 | $118,013 | $72,638 | $190,651 |
| 2029 | $127,446 | $75,651 | $203,097 |
| Total | $645,820 | $418,058 | $1,063,878 |
| Annual Growth Rate | 7.9% | 3.9% | 6.3% |
(Source: FactSet Research Terminal.)
How about Tesla? How much in R&D and growth capex are they expected to spend through 2029, the period Cathie Wood discusses?
| Year | Tesla R&D (Millions) | Tesla Capex (Millions) | Total Growth Spending (Millions) |
| 2024 | $4,359 | $10,966 | $15,325 |
| 2025 | $4,705 | $10,770 | $15,475 |
| 2026 | $5,532 | $10,675 | $16,207 |
| 2027 | $212 | $10,120 | $10,332 |
| 2028 | $7,613 | $11,591 | $19,204 |
| 2029 | $9,467 | $12,572 | $22,039 |
| Total | $31,888 | $66,694 | $98,582 |
| Annual Growth Rate | 16.8% | 2.8% | 7.5% |
(Source: FactSet Research Terminal.)
Analysts expect Tesla to spend an impressive $99 billion on growth through 2029.
Amazon (AMZN)? $1.1 trillion, 11X as much.
Alphabet (Owner of Waymo) is expected to spend $700 Billion On Growth, 7X More Than Tesla
| Year | Alphabet R&D (Millions) | Alphabet Capex (Millions) | Total Growth Spending (Millions) |
| 2024 | $49,290 | $47,945 | $97,235 |
| 2025 | $53,957 | $50,582 | $104,539 |
| 2026 | $57,752 | $52,096 | $109,848 |
| 2027 | $65,003 | $55,349 | $120,352 |
| 2028 | $71,025 | $55,747 | $126,772 |
| 2029 | $77,140 | $57,323 | $134,463 |
| Total | $374,167 | $319,042 | $693,209 |
| Annual Growth Rate | 9.4% | 3.6% | 6.7% |
(Source: FactSet Research Terminal.)
And let’s not forget that Amazon’s free cash flow is growing like a weed, over 40% per year.
Amazon Growth Consensus Forecast
| Year | Sales | Free Cash Flow | EBITDA | EBIT (Operating Income) | Net Income |
| 2023 | $574,785 | $36,658 | $109,538 | $36,852 | $30,425 |
| 2024 | $638,776 | $62,608 | $136,848 | $61,764 | $48,618 |
| 2025 | $710,140 | $76,348 | $157,314 | $77,012 | $62,584 |
| 2026 | $785,929 | $104,744 | $181,735 | $97,992 | $79,586 |
| 2027 | $860,354 | $127,536 | $210,185 | $116,594 | $95,778 |
| 2028 | $924,758 | $149,486 | $241,558 | $136,897 | $112,630 |
| 2029 | $1,008,330 | $176,399 | $276,364 | $163,368 | $135,349 |
| Annualized Growth 2024-2029 | 9.8% | 41.9% | 18.4% | 28.2% | 28.2% |
| Cumulative 2024-2029 | $4,928,287 | $697,121 | $1,204,004 | $653,627 | $534,545 |
(Source: FactSet Research Terminal.)
By 2030, analysts expect Amazon to generate over $200 billion in free cash flow and, by 2028, achieve the record for most free cash flow in any year.
| Year | Company | Free Cash Flow (USD) |
| 2028 (consensus forecast) | Amazon | $149,486,000,000 |
| 2022 | Saudi Aramco | $148,540,000,000 |
| 2022 | Apple | $111,440,000,000 |
| 2018 | Saudi Aramco | $111,070,000,000 |
| 2021 | Saudi Aramco | $107,510,000,000 |
| 2021 | Apple | $95,010,000,000 |
| 2019 | Saudi Aramco | $85,670,000,000 |
| 2020 | Apple | $73,430,000,000 |
| 2021 | Alphabet | $67,012,000,000 |
| 2022 | Microsoft | $63,330,000,000 |
| 2019 | Apple | $63,040,000,000 |
| 2022 | Alphabet | $60,010,000,000 |
| 2018 | Apple | $58,360,000,000 |
| 2021 | Microsoft | $56,710,000,000 |
| 2020 | Saudi Aramco | $49,040,000,000 |
| 2020 | Alphabet | $42,843,000,000 |
| 2020 | Microsoft | $40,110,000,000 |
| 2019 | Microsoft | $38,470,000,000 |
| 2019 | Alphabet | $36,990,000,000 |
| 2018 | Microsoft | $32,470,000,000 |
| Total | $1,490,541,000,000 | |
| % Total From Amazon In 2028 Alone | 10.03% |
(Source: FactSet, Perplexity.)
Amazon’s record 2028 free cash flow is expected to account for 10% of the top 20 corporate free cash flow years.
Tesla? According to the FactSet consensus, it won’t be at 50% of the 20th-best-ever recorded free cash flow by 2029.
For context, the Vatican has an estimated $3 to $30 billion in assets and generates $500 to $1 billion annually in revenue.
Big tech giants like Amazon and Alphabet (GOOG, GOOGL), on the other hand, have more money than they can spend.
| Year | Sales | Free Cash Flow | EBITDA | EBIT (Operating Income) | Net Income |
| 2023 | $304,296 | $74,020 | $121,040 | $84,952 | $71,645 |
| 2024 | $339,262 | $87,896 | $137,389 | $98,447 | $83,080 |
| 2025 | $376,274 | $100,457 | $159,429 | $111,994 | $95,268 |
| 2026 | $411,304 | $114,535 | $174,592 | $122,527 | $104,229 |
| 2027 | $436,139 | $149,000 | $192,782 | $134,336 | $116,489 |
| 2028 | $497,207 | $167,819 | $221,758 | $156,706 | $136,825 |
| 2029 | $585,828 | $207,213 | $286,790 | $234,327 | $197,292 |
| Annualized Growth 2023-2029 | 11.5353% | 18.7166% | 15.4620% | 18.4245% | 18.3915% |
| Cumulative 2024-2029 | $2,646,014 | $826,920 | $1,172,740 | $858,337 | $733,183 |
(Source: FactSet Research Terminal.)
Alphabet is expected to generate over $800 billion in free cash flow. In comparison, Amazon is expected to generate $700 billion, and both companies are expected to grow their FCF faster than Tesla in the coming years.
Waymo already runs a commercial robotaxi service, Tesla doesn’t, and Amazon plans to potentially dominate this industry.
Reason Four: Amazon Might Be The Stealth Leader In Robotaxis
Zoox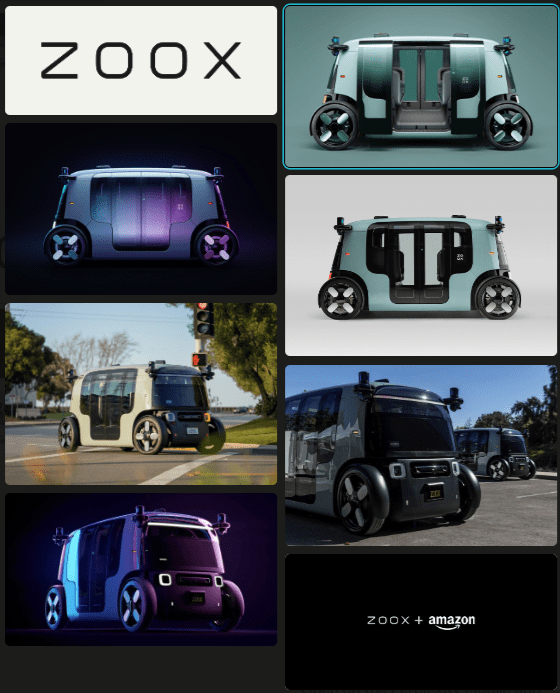
Zoox, a subsidiary of Amazon, is developing autonomous vehicles to provide mobility-as-a-service in dense urban environments.
The company was founded in 2014 to reimagine personal transportation from the ground up by creating a new kind of vehicle designed specifically for autonomous driving rather than retrofitting existing cars. Zoox has been testing its self-driving technology in several cities across the United States, including San Francisco, Las Vegas, and Seattle. Recently, the company announced plans to expand its testing operations to Miami and Austin.
Zoox plans to deploy a fleet of retrofitted Toyota Highlanders with its autonomous driving system in these new cities. While public rides will not be offered initially, this expansion marks a significant step towards the eventual commercialization of Zoox’s robotaxi service. The company has already received approval to carry passengers in its purpose-built autonomous vehicle in Foster City, California. It is gearing up for a commercial launch in Las Vegas later this year.
Zoox, a subsidiary of Amazon, is developing autonomous vehicles to provide mobility-as-a-service in dense urban environments. The company was founded in 2014 to reimagine personal transportation from the ground up by creating a new kind of vehicle designed specifically for autonomous driving rather than retrofitting existing cars.
Zoox has been testing its self-driving technology in several cities across the United States, including San Francisco, Las Vegas, and Seattle.
Recently, the company announced plans to expand its testing operations to Miami and Austin.
Zoox will deploy a fleet of retrofitted Toyota Highlanders with its autonomous driving system in these new cities. While public rides will not be offered initially, this expansion marks a significant step towards the eventual commercialization of Zoox’s robotaxi service.
The company has already received approval to carry passengers in its purpose-built autonomous vehicle in Foster City, California. It is gearing up for a commercial launch in Las Vegas later this year.
Tesla has no robotaxis; they have only promises from Musk for self-driving cars that go back to 2016.
Tesla has hype. Amazon has a small fleet of purpose-built cars in several US cities and plans to pay customers by year-end.
Zoox is working with regulators to launch the Zoox service, while Elon Musk is famous for aggravating regulators at every turn.
Waymo and Zoox have the commercial backing of tech giants with hundreds of billions in free cash flow.
That’s money that neither Uber nor Tesla has.
But give Cathie Wood the benefit of the doubt. Let’s say she’s right, and robotaxis will be perfected by 2029, creating a $9 trillion global market for “transportation as a service.”
Cathie thinks Tesla could become a leader in robot taxis by licensing its full self-driving (FSD) technology to Uber, which would pay Tesla a royalty per mile driven.
Pure profit, recurring revenue, what’s not to love?
But there is a catch. Tesla isn’t the leader in Robotaxis; Amazon is, or at least one of them.
Now, let’s assume Cathie is correct, and within two years, the tech is safe and deployed at scale. By 2030, $9 trillion in transportation as service subscriptions will be operating.
I don’t see Tesla getting $0.50 per mile in revenue from licenses. Because Waymo and Zoox are working on their software, their AI lead could very well ensure they cut Tesla out of the loop.
Without the ability to fund a $45 trillion robotaxi build out, Alphabet and Amazon are perhaps the best positioned to own the future of robotaxis.
Let’s assume Amazon’s future market share in robotaxis is similar to the 32% it has in the global cloud.
I would call that a conservative assumption, since the high cost of building a robotaxi fleet creates enormous barriers to entry.
Reason Five: Elon Musk Might Not Be The Genius You Think He Is
No less than Elon Musk has said that Tesla is not worth much unless it cracks autonomous robotaxis.
In Tesla’s Q4 2021 earnings call, Musk said the company’s $800+ billion market cap at the time “can be justified through a ‘roadmap’ of potential growth” from transforming Tesla’s cars into robotaxis that can generate significant incremental revenue through software margins.
Without robot-taxis, Tesla would be nothing more than a carmaker.
Without robotaxis, Amazon and Alphabet are still Amazon and Alphabet.
Elon Musk has made numerous ambitious promises over the years, many of which have not been delivered on time or at all. Here is a list of some notable promises that Musk has failed to deliver on time:
Elon Musk has made numerous ambitious promises over the years, many of which have not been delivered on time or at all.
Here is a list of some notable promises that Musk has failed to deliver on time:
- Robotaxis by 2020:
- In 2019, Musk predicted that Tesla would have autonomous robotaxis on the road by 2020. This has not materialized, and Tesla’s self-driving technology is still in development and testing phases.
- Coast-to-Coast Autonomous Driving:
- Musk claimed in 2016 that Tesla cars could drive autonomously from New York to Los Angeles by 2018. This capability has not been achieved.
- Fully Self-Driving Teslas:
- Musk has repeatedly promised that Tesla would achieve full self-driving capabilities “next year” since at least 2017. Tesla’s Full Self-Driving (FSD) feature still requires human supervision.
- One Million Robotaxis by 2020:
- In 2019, Musk declared that Tesla would have one million robotaxis on the road by 2020. This goal has not been met.
- Tesla Semi Truck:
- Announced in 2017 with a production timeline set for 2019, the Tesla Semi truck’s production was delayed until 2022, and even then, it faced issues such as brake failures.
- Mars Mission by 2026:
- Musk initially promised a Mars mission by 2026, but this has been delayed to at least 2029.
- Hyperloop Tunnel:
- Musk’s company Hyperloop promised a 10-kilometer tunnel by 2020. This project was not realized, and Musk later admitted that Hyperloop was never a serious venture.
- Twitter Algorithm Open-Sourcing:
- After acquiring Twitter, Musk promised to make the company’s algorithm public “next week.” The algorithm was not released until March 31, 2023, months after the initial promise.
- $35,000 Tesla Model 3:
- Musk announced that the Tesla Model 3 would cost $35,000. However, the actual cost has been higher due to various factors.
- Submarine to Rescue Thai Soccer Team:
- Musk offered to develop a submarine to rescue the trapped Thai soccer team in 2018. The submarine was not used, and divers rescued the team.
- Carbon Capture for Rocket Fuel:
- Musk promised to extract carbon from the air and use it as rocket fuel. However, this has not been achieved.
If Musk lived up to his reputation of not delivering on this promise, Tesla investors would be stuck owning a car company.
If robotaxis are not a $9 trillion market by 2030 (and they likely won’t be), Amazon investors will be stuck owning Amazon.
A world leader in digital retail, cloud computing, advertising, streaming, and now, it seems, potentially robotaxis.
Reason 6: Cathie Wood Might Not Be The Genius You Think She Is
Charlie Bilello 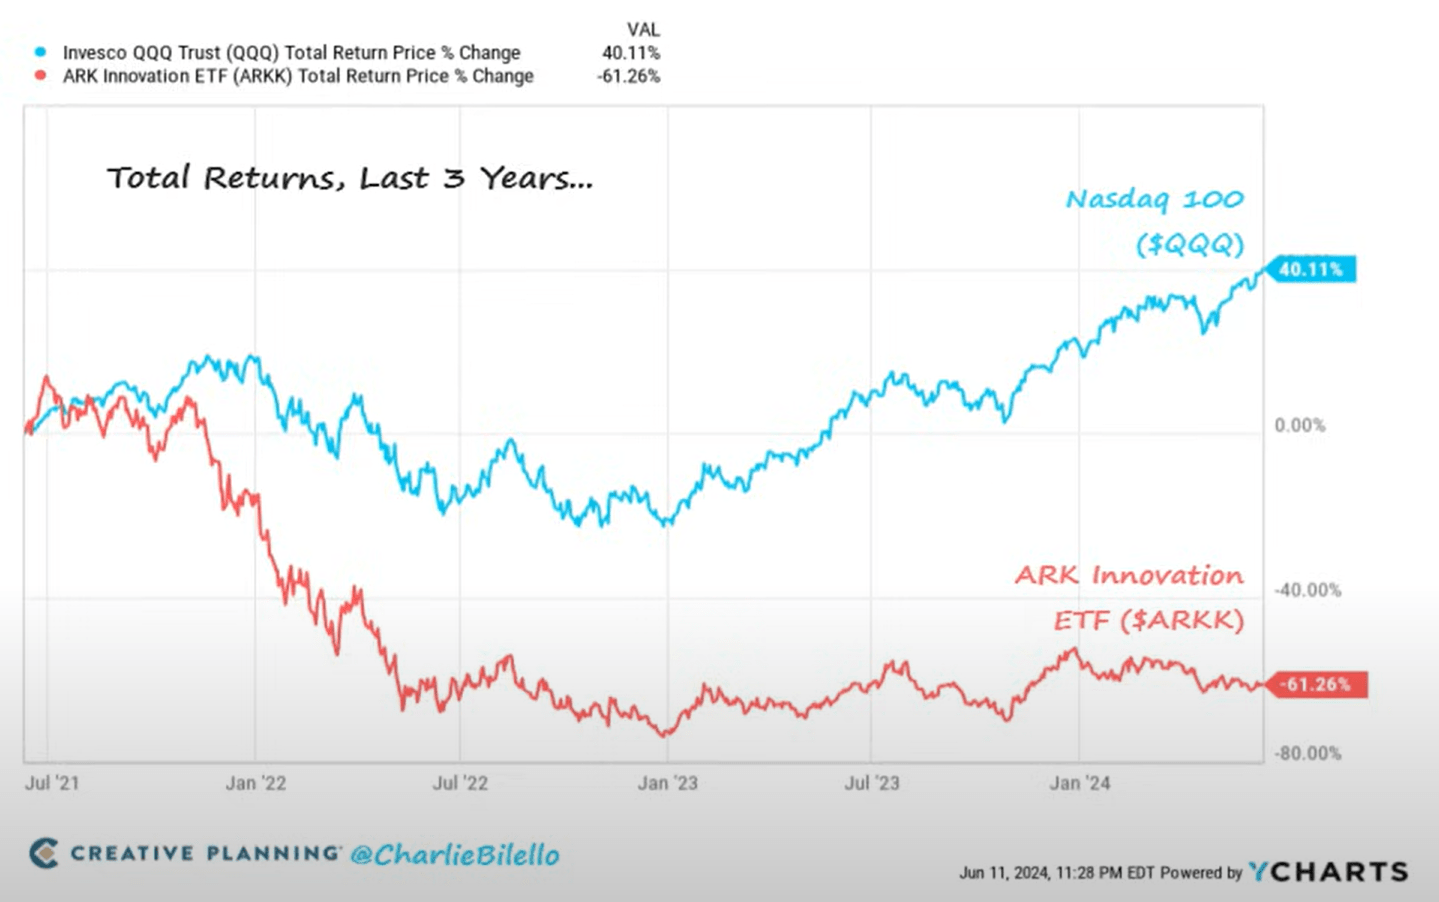
Cathie Wood got very lucky being 10% Tesla in the year, which went up 10X and another 150% the following year.
She had 5 ARK funds that were all up 100% or more in a single year. And she was hailed by some as the “Buffett of technology.”
Ycharts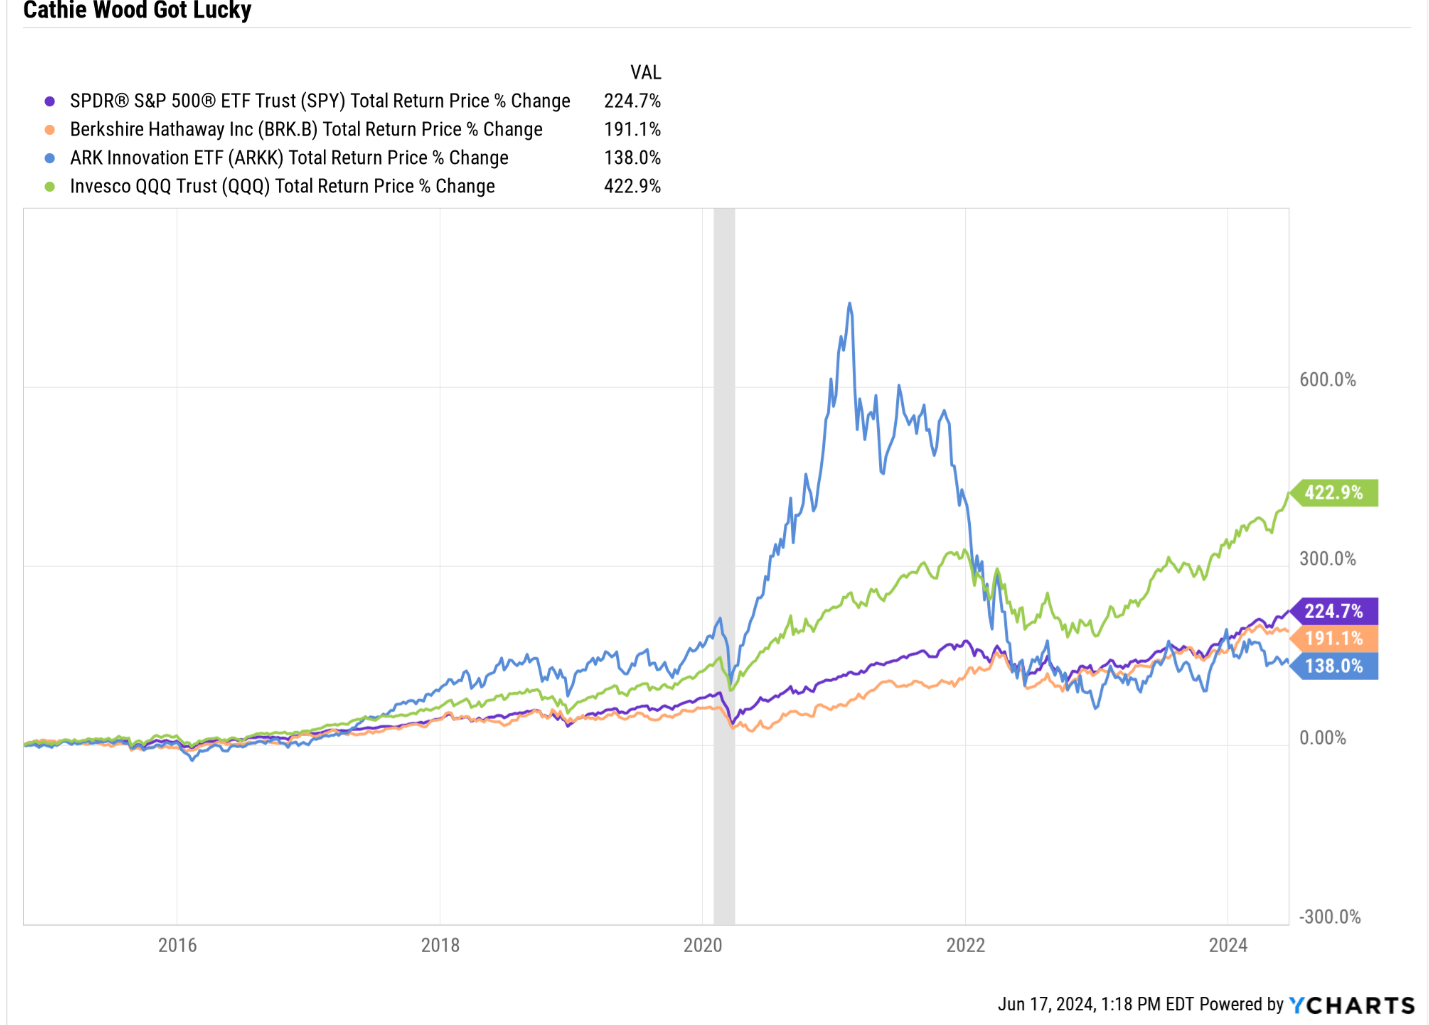
Buffett has beaten Cathie, even with her incredible 350% return in the Pandemic speculative mania.
That might be because she is “swinging for the fences” with her dreams of 5 incredible technologies combining to generate 6% to 9% GDP growth in the US.
TED, Cathie Wood 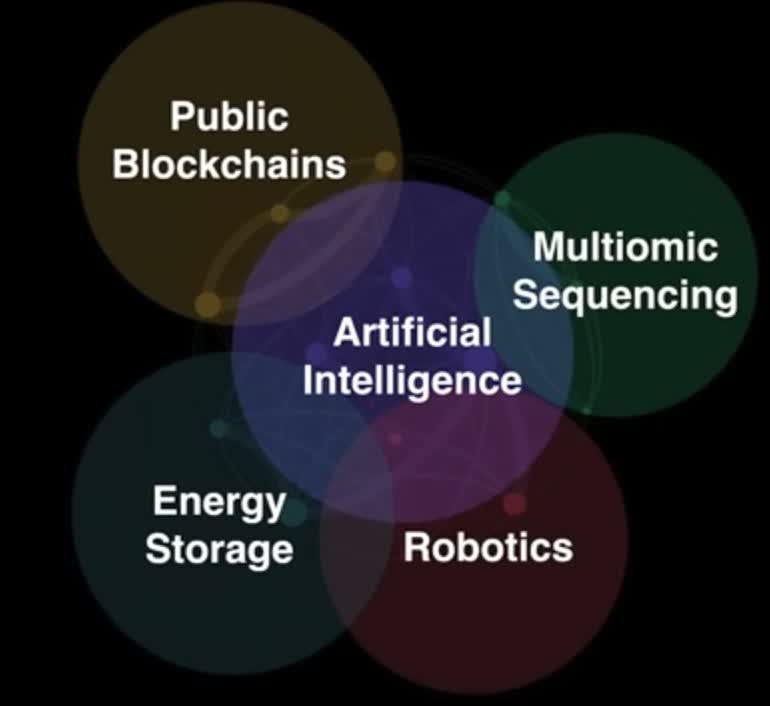
She believes that 40% annual earnings growth is for the leaders in these revolutionary technologies.
TED, Cathie Wood 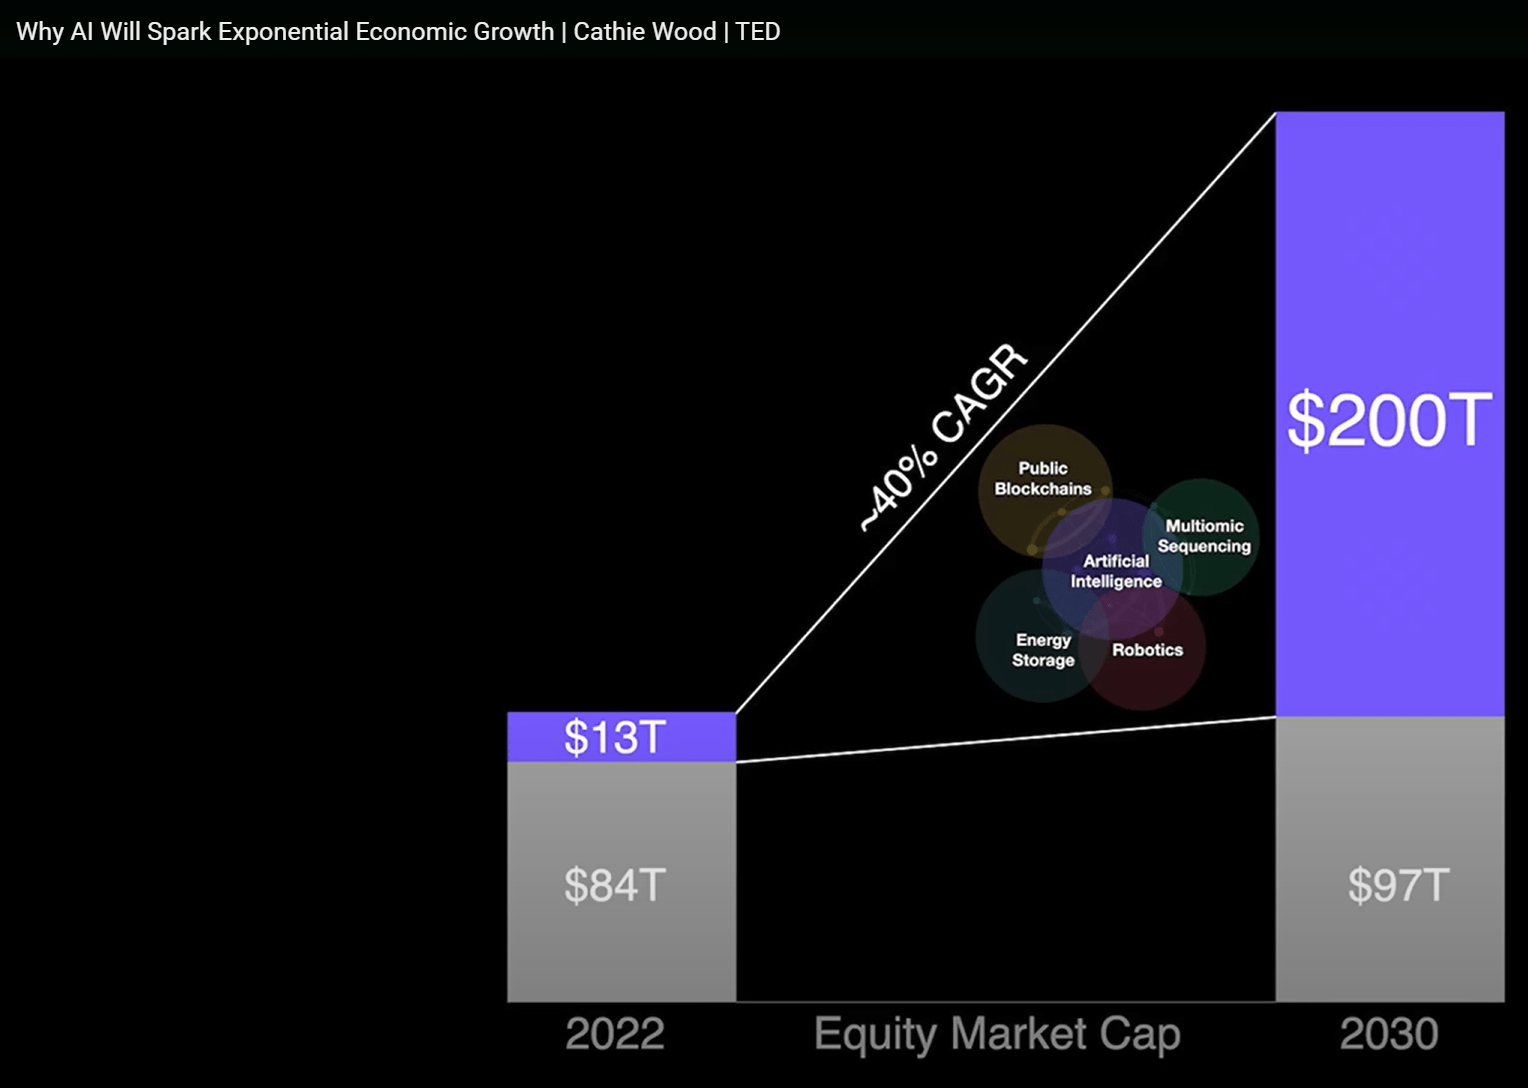
AMZN’s consensus 30% annualized FCF/share growth rate through 2029 is reasonable based on margin expansion.
Cathie’s optimistic outlook for 15X return potential for ARK Innovation ETF (ARKK) and her other funds through 2030 is outlandish.
Not impossible, mind you. I’ve done enough research into AI to understand the best-case scenario for these technologies, which makes Cathie’s forecasts not impossible, just the best-case scenario.
However, buying Amazon, whose 30% free cash flow consensus growth forecast has nothing to do with Zoox or robotaxis, is a much lower-risk opportunity.
Bottom Line: Even If Cathie Wood Is Right, Tesla Likely Won’t Dominate Robotaxis
Is Cathie Wood right about technology?
It depends. She’s fitting that the five general technologies will likely transform the world and mint vast fortunes.
However, as for her high conviction that Tesla will be a leader in robots and robotaxis and thus become a $10+ trillion company, or is Elon Musk saying that robots could make Tesla a $25 trillion company?
I am highly skeptical of that.
Amazon and Alphabet, with their oceans of free cash flow, are far more likely to capture value from robotaxis since they can afford to eventually build vast fleets of millions, tens of millions, or even hundreds of millions of purpose-built robotaxis.
Tesla, Inc., without robotaxis, is just a car company.
Amazon without robotaxis is still Amazon, a car company with a potential 300% upside to fair value within three years.
That’s why I increased my position to a full 11% overweight in my portfolio and set limits to keep it pinned at 11% of my portfolio for as long as its fundamental thesis remains intact.
Analyst’s Disclosure: I/we have a beneficial long position in the shares of AMZN, KMLM either through stock ownership, options, or other derivatives. I wrote this article myself, and it expresses my own opinions. I am not receiving compensation for it (other than from Seeking Alpha). I have no business relationship with any company whose stock is mentioned in this article.
Seeking Alpha’s Disclosure: Past performance is no guarantee of future results. No recommendation or advice is being given as to whether any investment is suitable for a particular investor. Any views or opinions expressed above may not reflect those of Seeking Alpha as a whole. Seeking Alpha is not a licensed securities dealer, broker or US investment adviser or investment bank. Our analysts are third party authors that include both professional investors and individual investors who may not be licensed or certified by any institute or regulatory body.
—————————————————————————————-

Dividend Kings helps you determine the best safe dividend stocks to buy via our Automated Investment Decision Tool, Zen Research Terminal, Correction Planning Tool, and Daily Blue-Chip Deal Videos.
Membership also includes
-
Access to our 14 model portfolios (all of which are beating the market in this correction)
-
My $2.5 million family charity fund.
-
50% discount to iREIT (our REIT-focused sister service)
-
real-time chatroom support
-
real-time email notifications of all my $2.5 million portfolio buys.
-
numerous valuable investing tools
Click here for a two-week free trial, so we can help you achieve better long-term total returns and your financial dreams.