Summary:
- Applied Materials (AMAT) is a high-quality, deeply cyclical business, with a history of significant earnings declines and recoveries within five years.
- My strategy involves buying deeply cyclical stocks like AMAT after a 50%-65% decline from their highs, aiming for substantial returns upon recovery.
- Historical price patterns show AMAT typically recovers from deep drawdowns, making it a strong candidate for cyclical investing during downturns.
sefa ozel
Introduction
In less than six months, the stock of semiconductor equipment maker Applied Materials (NASDAQ:AMAT) has fallen -36% off its recent highs.
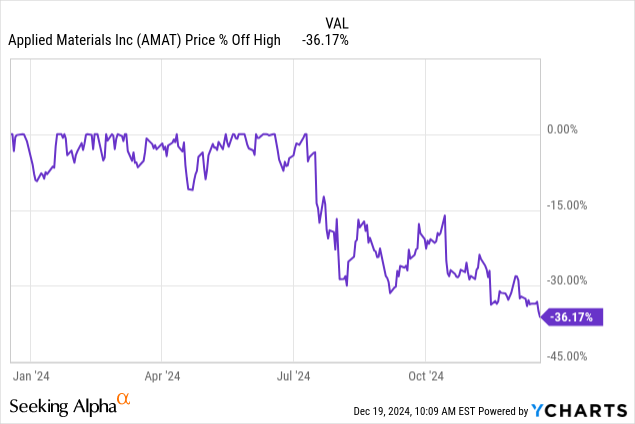
I last covered AMAT back in November 2022 with a similarly titled article where I shared my cyclical investing strategy, including the price I was willing to buy AMAT if it hit. My buy price for AMAT was $58.47, but the stock ultimately bottomed at $71.12 (after falling from a high of $167.06). So, I wasn’t able to buy AMAT during that downturn. (But I was able to buy AMD (AMD) and Micron (MU) near their bottoms, and they performed well, so I didn’t entirely miss out on the downturn’s opportunities.)
Some might consider this a missed opportunity, but I prefer to judge it from a more strategic portfolio perspective. My overall investing approach works differently than most investors. I start my process by gathering a list of businesses that meet my basic quality standards and are good fits for at least one of my core four investing strategies. Then I work out the valuations, conditions, and prices at which I would likely buy these stocks. I keep this database regularly updated, and then I wait. Currently, I track about 700 stocks in this way, about half of those have ‘buy prices’ assigned to them, and for the other half, I am waiting to see if certain other metrics improve before potentially adding buy prices. Because I actively track so many stocks in my Investing Group, The Cyclical Investor’s Club, I don’t need to have every stock hit my buy prices. I don’t even need a majority of stocks to hit my buy prices. I only need about 10% of the buy prices to hit every 2 or 3 years to have a steady supply of opportunities for the portfolio. This means I can be very picky about quality and valuations, so when I do get a good buying opportunity it typically produces excellent returns. That will be my goal for AMAT during this new downcycle, just as it was during the last one.
This article will have a similar structure as my 2022 article, but because AMAT made a new all-time high this year, the updated buy price will be different than it was in 2022.
Applied Materials Historical Earnings Cyclicality
The first thing I need to determine with any stock is whether it is a good fit for the specific strategies I use. Most of my strategies rely on earnings data availability and historical patterns in order to profile and categorize the business. So, I start by examining the historical earnings.
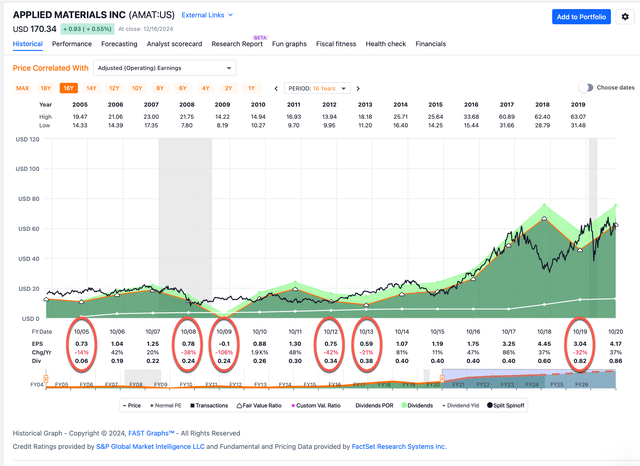
In the FAST Graph above, I have circled in red the years in which AMAT’s earnings per share growth was negative. Two things are notable. The first is that twice in the past 20 years earnings growth has declined by more than -50%. And second, in both of those instances, the earnings recovered their all-time highs within 5 years. This is the very definition of a high-quality, yet cyclical business. One in which earnings occasionally suffer deep declines, but recover in a timely manner, and also still grow over the long term. These types of businesses can provide great opportunities for investors, but they can be tricky investments to make.
As any investor who has purchased this stock in the past 9 months knows, the stock prices can be very volatile and can lose value extremely quickly, sometimes for no apparent fundament reason. For example, AMAT’s stock price has lost one-third of its peak value even though earnings have grown about 7% this past year and are expected by analysts to grow 9% next year. The reason for this volatility is because professional traders know that this is a cyclical business so they try to anticipate those big negative earnings growth periods ahead of time and get out of the stock early. Sometimes, these traders are correct to do so, and sometimes they are not. But one thing is for certain, if you wait for the actual earnings of the business to fall and the fundamentals to look bad before selling, the stock price will already be well off its highs. Conversely, if you wait for fundamentals to look good after a big downcycle, you almost certainly miss buying anywhere close to the bottom and your returns will suffer. This is why once I have used historical earnings to establish that a business is deeply cyclical, I no longer use fundamental analysis to help determine when to buy a stock of this type, and instead, I use historical price patterns as a guide.
AMAT’s Historical Price Cyclicality
When I buy the stocks of deeply cyclical businesses one of the main things I look for is the ability of the stock price to recover previous highs within about 2-5 years. While historical patterns don’t offer a perfect map to the future, they at least offer pretty good guideposts, and it’s always best to know what a stock is at least capable of doing so surprises are fewer than going in blind.
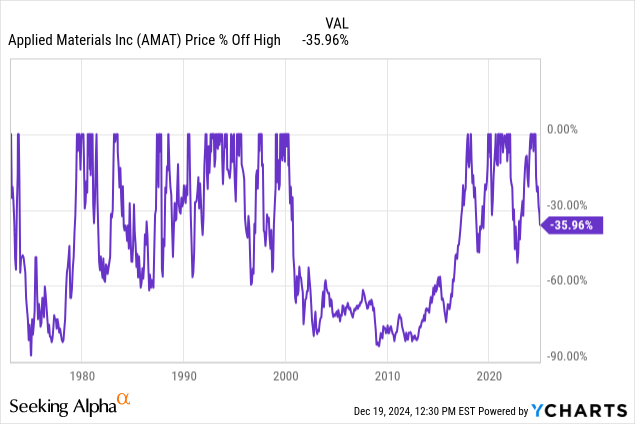
In the above drawdown chart we can see that historically, the price has been very deeply cyclical, typically falling between -60% to -85% off its highs before recovering in short order. The one exception to that pattern is the years following the 2000 bubble, from which the stock price took about 16 years to recover.
Even though our recent upcycle was very big, I think that we are still in much more of a secular growth trend for the industry since 2015 or so, and the price wasn’t quite as crazy high in 2021 or 2024 as it was in 2000, so I’m going to post another drawdown chart starting in 2005 so we can see the more recent post-2000-bubble drawdowns.
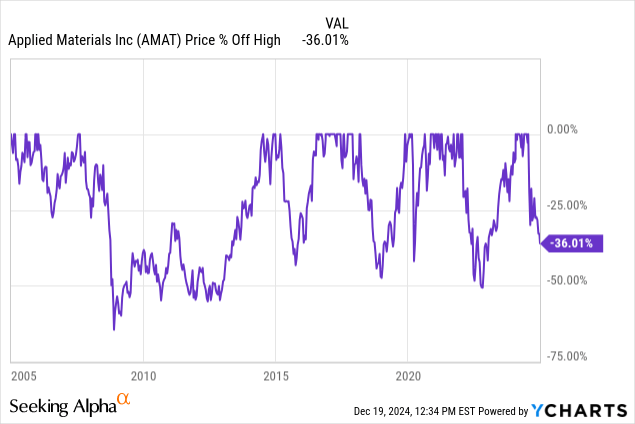
When I’m dealing with deep cyclical businesses, because I know the stock prices can be extremely volatile and that I might have to wait many years for a full recovery, I usually don’t buy them unless they are at least -50% off their highs and I can expect a 100% return for my trouble when the price recovers the old highs. (The thought process here is that if the market was willing to pay a certain price in the past under given conditions, then if those conditions arise again, the market is likely to pay a similar price.) If we focus on the drawdowns that were at least -50% during the past 20 years, we have 3 of them. The GFC in 2008, where the decline was about -68%, the 2018 decline which was about -53%, and most recently, the 2022 decline which was about -55%. All three of these drawdowns were deeper than -50%, and the one that occurred during a recession was deeper than -65%, so I am going to use those two levels as my potential buy levels.
My investing approach for deep cyclicals attempts to find historical patterns and then assume they will roughly repeat. However, I do check several things in order to see if there are obvious signs that this cycle really might be different this time and not repeat. I call these checks “impairment tests” and usually they take the form of questions. I will share the most relevant ones below.
Impairment Tests
Are revenues this cyclical peak higher than the last one?
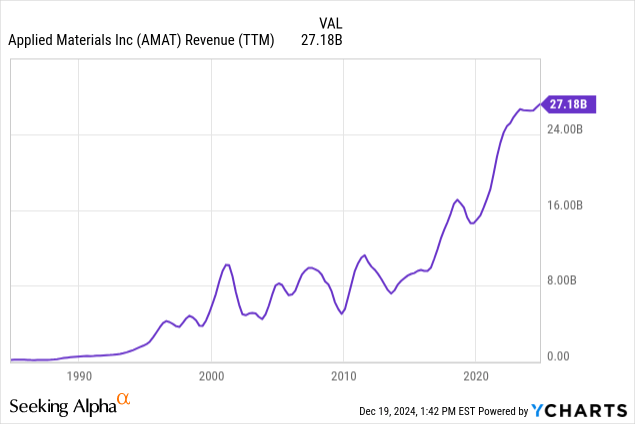
Revenues are significantly higher than the 2018 peak, and also slightly higher than the last time I covered AMAT in 2022. This is what we want to see because it’s a sign that the business is not starting a more permanent decline, so AMAT passes this test.
Has AMAT stock experienced a recent super-cycle?
It is certainly possible the stock experienced a super-cyclical peak this year. This can cause a problem for a strategy like mine that measures declines from peak prices because if the peak prices are ridiculously high, then a stock might fall -65% or more off its highs and still not exactly be a good value, or not behave similarly to historical periods when the stock wasn’t falling off a super-cyclical high.
I don’t have a clear way to identify super-cycles. It’s kind of an “I’ll know it when I see it” sort of thing. But my quick way to check is to look at a log-scale version of a long-term historical price chart. Super-cycles tend to show up pretty well on these charts without giving as many false positives as a normal long-term price chart.
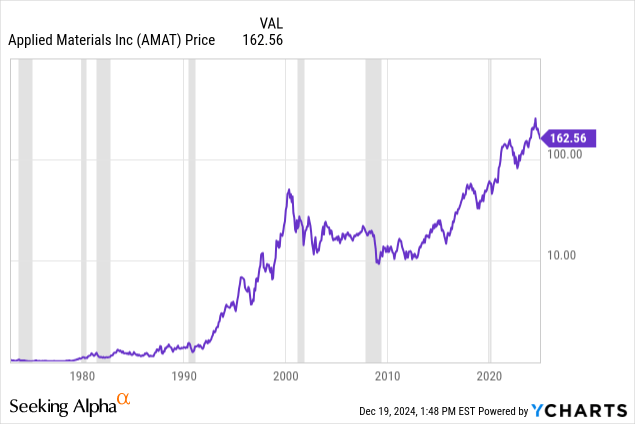
The periods from 1990 to 2000, which we know was a super-cycle, and the period from about 2014 to 2024 certainly have some similarities. However, the blow-off top from 1998 to 2000 was much steeper and more extreme and also less supported by business fundamentals. So, my interpretation of the current upcycle is that it is certainly part of a very big upcycle, but not as big as the 2000 super cycle. For reference, the initial price drop down from the 2000 peak was around -80%. I don’t expect the stock to fall that far this time around because the fundamentals and secular growth underpinnings are better and the peak was not as extreme.
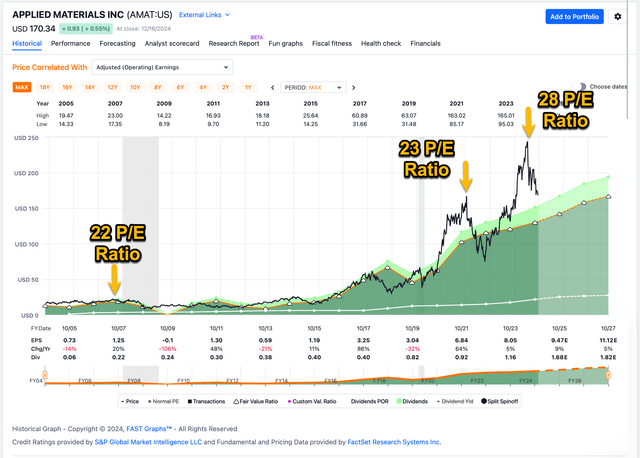
Another way I sometimes gauge a super cycle is by comparing peak P/E ratios to previous cycles (before earnings fell in the down cycle).
Compared to the last time I covered AMAT in 2022 when the peak P/E ratios from 2021 and 2007 were about the same, the peak 2024 P/E was notably higher at 28. This increases the odds the stock could fall further off its highs, particularly in a recession. However, balancing that out a little bit are the secular growth tailwinds and steadier earnings trends. I think investors should be keenly aware that if they do buy after a -50% decline off the high, and there is an actual recession, they could suffer an additional -50% decline before the stock price recovers, and that this could happen without there being any fundamental long-term problem with the business. Knowing this information might help some investors avoid selling near a cyclical bottom (which is what a lot of investors tend to do).
How is the company’s debt-to-equity compared to previous cycles?
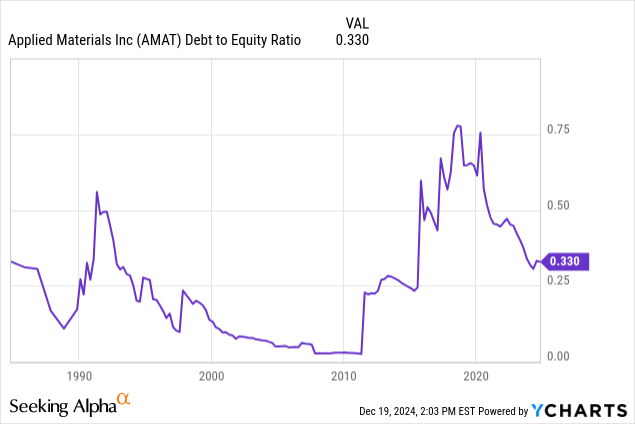
This metric looks fine to me and has consistently improved since 2018.
Has the price dropped enough to produce alpha in the past?
In this final test, I like to examine what sort of returns I could have achieved during previous downturns if I purchased the stock at the desired levels and held until the stock price recovered its old highs. Usually, if I get to this point in an analysis we know the price eventually recovers so it’s mostly about how long it takes to do so, and what the returns are like compared to the S&P 500 index.
If you recall, I wasn’t able to buy AMAT during the 2022 downturn, even though I was able to buy several stocks that year which ended up being big winners. Stocks like Netflix (NFLX), Service Now (NOW), Micron, AMD, Fiserve (FI), Fortinet (FTNT), and Mercadolibre (MELI). They all produce excellent returns. But, there were also many stocks like Nvidia (NVDA), Microsoft (MSFT), Alphabet (GOOGL) and AMAT, that got close to my buy prices, but didn’t quite hit, so I missed out on those opportunities. That’s just how it goes with any disciplined strategy, but earlier this year I did make an adjustment to give me a better chance of capturing some of the winners I might otherwise miss, without taking on too much additional risk.
Previously my standard initial position size was a 1% weighted portfolio position with the option of adding an additional 1%. Now I take 0.5% weighted positions with the option of adding three additional .5% weighted positions if the price keeps falling, or in some cases, if I grow more confident in the business. Generally speaking, 1% is still my standard weighting, but I have more flexibility layering in, which means there is a higher likelihood I can capture at least some gains from more of the stocks I have narrowly missed historically.
In the case of AMAT, I’ll examine two potential entry points, one at -50% off the high, and one at -65%. Let’s start with the -65% drawdown purchase from the 2008 downcycle.
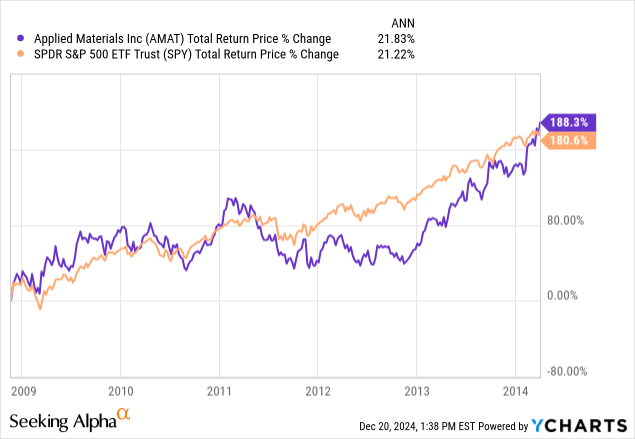
Purchasing AMAT after a 65% decline from the high immediately before the GFC (not measuring from the year 2000 high), would have taken about 5.5 years for the stock to recover pre-GFC highs, and it would have produced a 21.83% CAGR, which was about the same as the S&P 500. I consider long-term 20% CAGRs to be acceptable even if they don’t outperform the wider market, so this would have been a good investment. Also, the investor would have spent almost no time underwater after buying the stock, which is nice.
Now let’s test buying the same downcycle after a -50% decline:
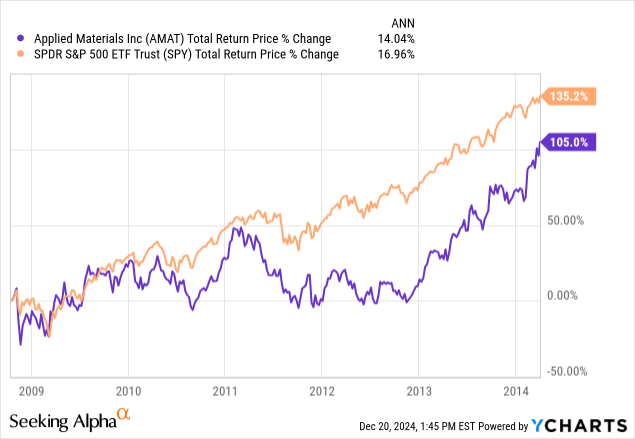
The holding period would have been about the same at 5.5 years but the CAGR would have been around 14%. That’s actually not too bad, but given that the S&P 500 outperformed if held over the same time period, there were probably better deals in the market at that time on which investors could have capitalized better. If an investor made a purchase at both price points they would have averaged around an 18% CAGR. That’s acceptable, but not fantastic.
Now let’s move to the 2018 down cycle.
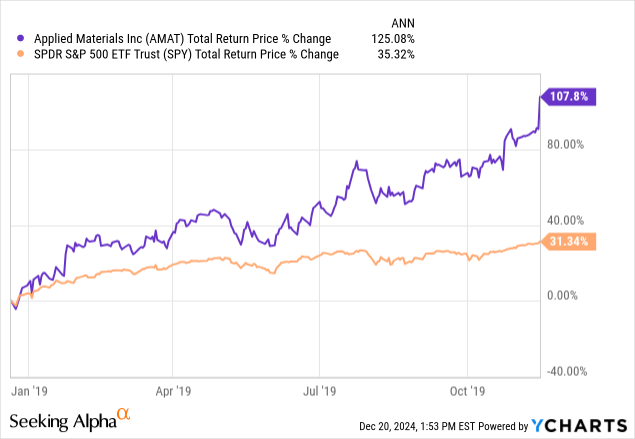
In this downcycle, AMAT fell just a little deeper than -50%, so that was the only option to buy the stock using the two price points I suggested. This time the price fully recovered in slightly under a year, and produced a 125% CAGR (probably closer to 100% if an investor waited one more month for long-term capital gains treatment). The S&P 500 “only” returned about 31% during the same time period so buying after a -50% decline worked out very well and holding out for a deeper decline would have produced nothing.
Finally, let’s look at the 2022 down cycle.
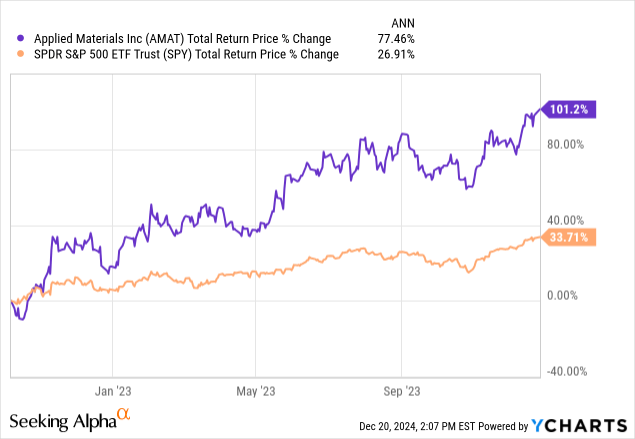
AMAT fell about -55% off its high in 2022, so the -50% level would have been the only one triggered. That would have doubled in a little over a year, producing a 77% CAGR compared to SPY’s 27% CAGR, so, similar to the 2018 downcycle in terms of regular and relative performance.
Overall, investing after a -50% decline off AMAT’s highs would have been a very good investing strategy during the previous two decades. However, investors should be aware, that if a recession does occur again in the future, the stock is capable of falling deeper, and if it is coming off a super cycle, capable of falling much deeper, so there are risks in buying at this level.
Putting all this together, having two buy prices for the stock, one after a -50% decline from peak, and one after a -65% decline is reasonable. Also, in order to spread risk around, I prefer small weightings of 0.5% for these positions with the expectation I’ll likely be able to add many different high-quality semiconductor industry stocks around the same time if we do get a downcycle.
Conclusion
Applied Materials is a high quality, yet deeply cyclical business I would be willing to buy during its next downcycle, provided the stock trades cheap enough. My current plan is to take an initial 0.5% weighted position at $127.95 per share, and a second potential position at $89.56 per share. The goal at that point if I am able to buy the stock at those levels will be to hold for a full recovery of the stock price until it reaches new highs.
Analyst’s Disclosure: I/we have a beneficial long position in the shares of NOW, NFLX, FTNT, AMD, MELI either through stock ownership, options, or other derivatives. I wrote this article myself, and it expresses my own opinions. I am not receiving compensation for it (other than from Seeking Alpha). I have no business relationship with any company whose stock is mentioned in this article.
Seeking Alpha’s Disclosure: Past performance is no guarantee of future results. No recommendation or advice is being given as to whether any investment is suitable for a particular investor. Any views or opinions expressed above may not reflect those of Seeking Alpha as a whole. Seeking Alpha is not a licensed securities dealer, broker or US investment adviser or investment bank. Our analysts are third party authors that include both professional investors and individual investors who may not be licensed or certified by any institute or regulatory body.
If you have found my strategies interesting, useful, or profitable, consider supporting my continued research by joining the Cyclical Investor’s Club. It’s only $400/year, and it’s where I share my latest research and exclusive small-and-midcap ideas. Two-week trials are free.

