Summary:
- AMD has reached record highs amid strong performance in the technology and semiconductor sectors, but recent market volatility and technicals suggest caution.
- The semiconductor industry benchmark has shown volatility, with a recent recovery uncertain, and AMD’s stock is now in a descending channel.
- AMD’s stock is currently in a descending channel, with potential for further decline despite short-term rebounds, leading to a sell rating.
- Protective strategies should be considered as risks currently outweigh short-term opportunities, despite the potential for further growth in the long term.
- I discuss essential price levels and metrics investors could consider gaining an edge over the stock’s likely price action.
BlackJack3D
Advanced Micro Devices, Inc. (NASDAQ:AMD) has experienced significant gains, reaching record highs amid strong performance in the technology and semiconductor sectors. However, recent market volatility and AMD’s technicals are hinting at cautiousness. This article discusses a short-term trading opportunity, highlighting the importance of setting stop-loss levels and actively managing risk. It considers broader market trends, including the potential for further declines despite short-term rebounds, and underscores the need for a cautious approach in navigating the current market landscape.
A Macro Perspective
The technology sector has outperformed all other sectors in the US economy over the past year. With forceful expansion led by companies in the semiconductor and computer hardware industries, technology companies have reached historically lofty valuations, supported by secular growth trends related to rapid digitalization and, most of all, Artificial Intelligence [AI] and its multiple applications. However, the correction experienced in the past few weeks has shown some cracks in the frenzy of optimism, reminding everyone of how fast the market can change direction, while today, the major indexes have again bounced back near the all-time high.
Not every stock in the semiconductor industry is supported by investors’ optimism, as seen in NVIDIA Corporation’s (NVDA) (NVDA:CA) stock performance. Intel Corporation’s (INTC) (INTC:CA) stock is now priced as it was back in 2013, Wolfspeed, Inc. (WOLF) is plunging towards its All-Time-Low [ATL], while Micron Technology, Inc. (MU) saw its valuation cut by over 45% during July, after marking a new All-Time-High [ATH] towards the end of June.
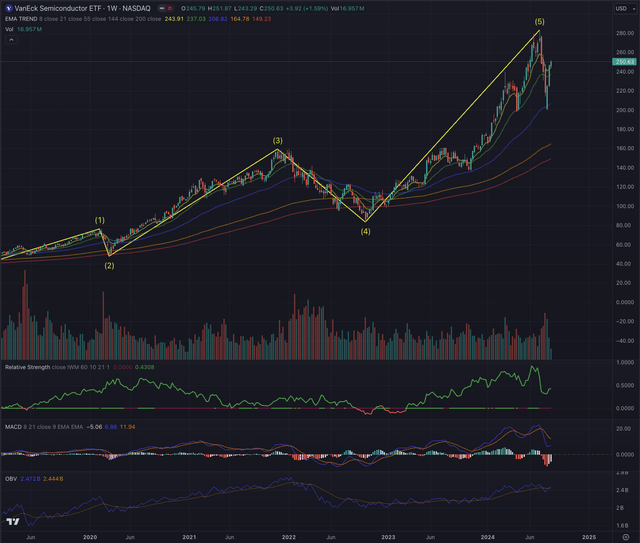
The VanEck Semiconductor ETF (SMH) has completed a five-wave impulse sequence, which started in December 2018 and led the benchmark to a stunning 700% performance until July 11, 2024, where a correction took place, leading to a 28% loss in valuation, and projecting the price towards its EMA55, a long-term trailing support level. In the meantime, SMH has recovered, reaching the 61.8% retracement of that correction in a steep “V-shape” recovery, while at this point, it is now uncertain if that recovery will lead to new highs or if, instead, the industry will struggle to continue in its stellar performance.
The Moving Average Convergence Divergence [MACD] momentum indicates that there might be more space for a pullback, while a positive crossing would increase the likelihood of seeing SMH reaching new highs. The relative strength of the semiconductor industry benchmark to the broader equity market, represented by the iShares Russell 2000 ETF (IWM), is still positive despite the steep fall that led to this indicator to invert in its trend. The On Balance Volume [OBV] hints at a possible peak in buying pressure, while it has stabilized above its 21-day moving average.
Where are we now?
In my last article on AMD, published on February 20, 2024, I downgraded the stock on my assumption of an imminent correction.
“While the current price action could simply signify a consolidation phase preceding further highs, my primary scenario anticipates a correction following the two substantial upward movements witnessed since October 2022.”
I described the possibility of AMD reaching prices around $200 but underscored the higher likelihood of seeing the stock retracing toward support levels.
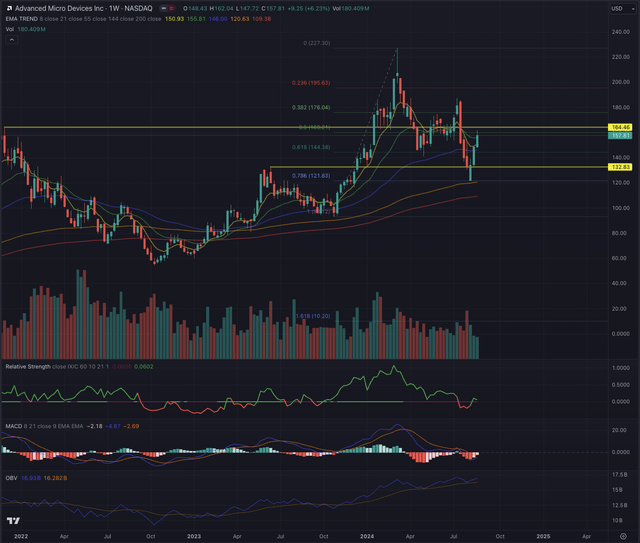
“AMD would breach the support of the price range, potentially targeting $157 as the initial level, followed by $145 and $133 as subsequent targets”.
The stock spiked up just two weeks later, ending on a beautiful shooting star, as shown in AMD’s weekly chart. This decisive price action resulted in a new ATH at $227.30 and was underscored by the two gaps marked before and after the peaking bar. The two gaps hint at a significant reversal, which led the stock to retrace exactly until the 78.60% retracement measured from the second leg up, which started on October 26, 2023, and almost to the 61.80% retracement measured from the bottom in October 2022.
The stock has since rebounded and has returned to the middle of the trading range defined by $132.83 and $164.46. The crossing of EMA8 under EMA21 and the price hovering below EMA21 have confirmed a short-term downtrend, but the stock’s recent price strength avoided a consistent crossing of the more long-term moving averages. A correction was overdue, but while these insights were observed from AMD’s weekly chart, it is crucial to zoom in and identify possible opportunities or threats on the daily chart. This timeframe will provide a more transparent assessment of the recent correction and the ongoing rebound, with the ultimate target to identify the most likely directional developments shortly.
What is coming next?
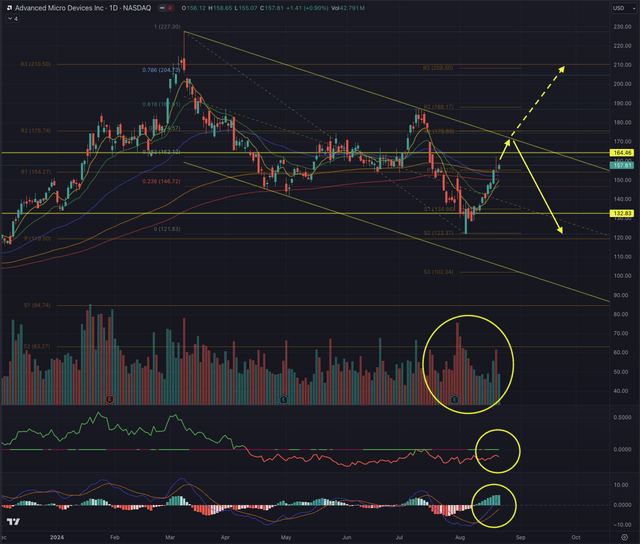
A closer examination of AMD’s daily chart reveals the formation of a descending trend channel, starting from the ATH and defined by the peak formed during July. This lower high showed the exhausting buying pressure, where buyers had to throw in the towel and allow the stock to drop further until bottoming on August 5, 2024. The actual momentum is supported by a positive crossing of AMD’s MACD, which led the stock to overcome its EMA200, reaching its EMA144 which is in confluence with the monthly pivot point at $155.27. An important achievement, which is offering some more upside potential in the short term. Despite the recent rebound, the stock’s relative strength is still weak compared to the technology index, represented by the NASDAQ Composite Index (COMP:IND).
AMD is in a descending channel, where it crossed its middle line while emerging towards essential price levels. The likelihood of seeing the stock testing the upper band of the channel is relatively high, given the momentum underscored by the rising MACD. Crucial to this development is the consistent overcoming of the weekly pivot at $155.27. If the stock achieves this, the next likely price level is around $175.75, which would see AMD sweeping above the channel in a breakout attempt. A possible attempt toward the ATH can be considered if the price overcomes $187.28 and breaks through the close resistance at $188.17.
However, the recent run-up is not accompanied by a significant increase in volume. Only a few market sessions have recorded a modest spike in buying volume, leading AMD to close above its weekly pivot point at $155.28, while a surge in volume has been observed during distribution days. Investors must observe these elements, as AMD’s stock needs support from institutional investors to climb consistently, and this participation is shown in the volume.
My base scenario is AMD testing the area around $165 and the overhead top of the channel, where the stock could likely be rejected to continue its descent towards the yearly pivot point at $119.50 and further towards the lower band of the trending channel. To reach the channel ceiling, the stock must overcome the recent gravestone doji candle at $162.04, as this could otherwise be a sign of reversal. Therefore, as a trader, I look closely into a selling opportunity in AMD, possibly toward $164.46 or, if the momentum continues, toward the channel upper band. Traders familiar with this strategy and robust risk management could consider shorting the stock at the discussed levels, while I would place my stop-loss above $190.
In an alternative scenario, AMD will continue its ascent and break through the overhead resistance towards its ATH. Here, other than the channel ceiling, precise levels between $187 and $188.20, as well as between $208.50 and $210.50, are of particular importance and should be observed closely, as the stock’s price reaction would hint at either continuation or rejection of the trend.
Implementing a stop-loss strategy could be prudent for investors who entered the recent lows and are seeking to protect their gains. One option is to set a stop-loss below the bottom of the trading range, specifically under $128 or below $119. Alternatively, a more prudent stop-loss could be set below the EMA200 or EMA55, with the latter allowing for less risk tolerance. These measures can help mitigate potential losses in the event of a downward reversal in AMD’s price.
Although I continue to recognize AMD’s potential in secular growth trends, the observed price action reflects a more cautious environment. From a technical and short-term perspective, the risks outweigh the opportunities, leading me to continue rating AMD as a sell position.
The bottom line
Technical analysis is a valuable resource for investors, providing direction rather than guaranteed results, similar to using a map or GPS for navigation. It acts as a strategic guide I consider in my trading activity that guides me through the complexities of the stock market, employing methods based on the Elliott Wave Theory and Fibonacci principles to evaluate likely outcomes based on probabilities. By examining elements like sector, industry, and price action, technical analysis helps investors confirm or challenge potential entry points to assess an asset’s status and estimate probable outcomes thoroughly.
The technology sector, particularly in semiconductors, has seen significant growth driven by digitalization and AI, reaching high valuations. However, recent corrections reveal vulnerabilities. The semiconductor industry benchmark has shown volatility, with a recent recovery uncertain. After reaching a new all-time high, AMD’s stock is now in a descending channel, with potential for further decline despite short-term rebounds, leading me to continue rating AMD as a sell position. Investors should consider protective strategies, as the risks currently outweigh the opportunities.
Analyst’s Disclosure: I/we have no stock, option or similar derivative position in any of the companies mentioned, and no plans to initiate any such positions within the next 72 hours. I wrote this article myself, and it expresses my own opinions. I am not receiving compensation for it (other than from Seeking Alpha). I have no business relationship with any company whose stock is mentioned in this article.
All of my articles are a matter of opinion and must be treated as such. All opinions and estimates reflect my best judgment on selected aspects of a potential investment in securities of the mentioned company or underlying, as of the publication date. Any opinions or estimates are subject to change without notice, and I am under no circumstance obliged to update or correct any information presented in my analyses. I am not acting in an investment adviser capacity, and this article is not financial advice. This article contains independent commentary to be used for informational and educational purposes only. I invite every investor to do their research and due diligence before making an independent investment decision based on their particular investment objectives, financial situation, and risk tolerance. I take no responsibility for your investment decisions but wish you great success.
Seeking Alpha’s Disclosure: Past performance is no guarantee of future results. No recommendation or advice is being given as to whether any investment is suitable for a particular investor. Any views or opinions expressed above may not reflect those of Seeking Alpha as a whole. Seeking Alpha is not a licensed securities dealer, broker or US investment adviser or investment bank. Our analysts are third party authors that include both professional investors and individual investors who may not be licensed or certified by any institute or regulatory body.


