Summary:
- AbbVie is a quality BBB+ S&P credit rated healthcare stock with a 3.9% yield.
- It has 11 years of a rising dividend and an amazing 5-year dividend growth rate of 17.7%.
- Price valuations are shown from Morningstar, Value Line, CFRA, and Yahoo Finance analysts.
- FAST Graphs charts are used to show valuation, earnings, and P/E with a recommendation made.
- It is one to own, hold on to, and know it could offer an even better value and yield as 2023 progresses.
gesrey
AbbVie (NYSE:ABBV) has been a quality power healthcare stock in Rose’s Income Garden “RIG” portfolio since 2015. I added to it, on and off through the years, as the price was volatile and many become concerned it had taken on too much debt to acquire Pharmacyclics, a leading hematological oncology company that owned the BTK inhibitor drug Imbruvica. Most of the purchases over the years were when the price was exceedingly attractive with a yield near ~4.5- 6%.
The pipeline is still strong; however, it is showing some weakness again with Humira going generic. I believe a wise investor can take advantage of what I perceive as some price weakness going to make it a compelling investment to hold and to watch for the price nadir and a higher yield.
It is important to know a bit about the company before I reveal the dividend growth and earnings projections.
ABBVIE
ABBV is a healthcare sector biopharmaceutical company that spun off from Abbott 10 years ago and is headquartered in North Chicago, IL.
The following are a few statistics:
-
$269 Billion market capitalization.
-
BBB+ S&P credit rating.
-
40.7% dividend payout ratio.
-
70.6% long-term debt/capital – it has generally always had a lot of debt and handles it well while maintaining an investable credit rating.
Earnings Will Decline
Question:
What do earnings look like with Humira sales declining?
Answer:
Lower, but still plentiful with some new recently-launched drugs, a maturing pipeline, and the acquisition of Allergan with Botox.
AbbVie has a strong quality portfolio of currently new marketed and pipeline drugs. Unfortunately, its key drug Humira is meeting competition, which will slow the growth of the company. Humira is a major provider of total sales and earnings with its high-margin revenue and usually is the primary determinant for performance in the past, which should also carry it upward for a few more years. That income will not disappear immediately. Great news is AbbVie derives enormous cash flows from its current product portfolio and now it has recently launched the next-generation immunology drugs, Skyrizi and Rinvoq, that target the IL23 and JAK pathways, which seem to offer better efficacy and an improved side effect profile over Humira. Both of these are leading new effective and safe treatment options that should replace much of the Humira missing earnings. Then there is Imbruvica, which is the next-biggest sales contributor showing strong clinical uses for forms of blood cancer, which could offer earnings near $5 billion. Other drugs in AbbVie’s pipeline are new cancer and immunology drugs, which should be able to use the effectiveness and positive results from all its most recently launched drugs to help achieve positive upwards results as well.
Allergan, a recent acquisition, at what some would say a great value price, has numerous new products, and includes the well-known and strong brand name Botox used for both cosmetic and therapeutic uses. Botox alone should provide great and welcome future earnings.
Complex old mature drugs in its portfolio with patent expiration might also provide specific dosing and formulation complexities, which make generic competition less likely, as it discovers new dosing and uses for them.
AbbVie also keeps its dividend payout ratio level to ~50%, which is within normal levels for the sector. With that dividend, it offers a nice safe 3.9% yield, which is admired and desired by many investors.
Risks
The Largest risk is primarily for lost sales for Humira and generic competition. It has planned to play earnings makeup with the recently launched Skyrizi and Rinvoq, but it will be difficult to compensate quickly for it.
Some other risks involve R&D costs, possible pipeline drug failures, and government pricing mandates, along with reimbursement challenges from large payer groups. Inflationary headwinds are also to be expected. However, these are risks and challenges for all healthcare drug providers.
Analyst Pricing
Morningstar and Value Line analyst prices are from a premium paid subscription obtained through a library source.
The following abbreviations are used in the chart that follows:
Curr Pr/Sh = Current price per share
M* FV = Morningstar fair value
M* Buy = Morningstar lowest and very inexpensive price to buy
VL = Value Line safety score: 1 is the safest/ best and 5 would be very unsafe
VL Mid PT = Value Line 18-month future price target or Mid 2024
YF PT = Yahoo Finance 1-year future price target
CFRA = TD Ameritrade analyst price target
52 wk Low = current 52-week price low
52 wk High = current 52-week price high
|
Stock |
Curr |
M* |
M* |
VL |
YF |
PT |
52 wk |
52 wk |
|
|
Ticker |
Pr/Sh |
FV |
Buy |
VL |
Mid Pt |
PT |
CFRA |
Low |
High |
|
ABBV |
152.57 |
120 |
72 |
2 |
154 |
161.63 |
151 |
$128.26 |
$175.91 |
AbbVie has come down in price most recently and is still now sitting near its estimated future analyst-suggested prices, but still way above the M* suggested fair value.
Maybe FAST Graphs technical analysis can offer a better view with a longer-term look at it to determine if a lower price is relevant.
FAST Graphs – FG
FG shows in one picture graph statistics and numbers that help visualize price, dividend attractiveness, and much more. The FAST part of FG, just in case you were wondering means, Fundamental Analyzer Software Tool, which was developed and introduced by Chuck Carnevale, a writer at SA. I have a grandfathered subscription price and enjoy using it.
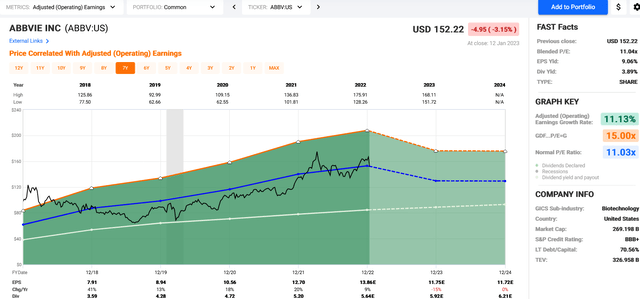
The following colors/lines on the chart represent the following:
Black line = price
White line = dividend
Orange line = Graham average of usually 15 P/E “price/earnings” for most stocks.
Blue line = Normal P/E
Dashed or dotted lines are estimates only.
Green Area represents earnings.
Statistics by year are noted for high and low prices at the top of each chart in black and for earnings and dividends at the bottom of it. The % shown is for the change from year to year for earnings.
Shown below is a 7-year chart representing the last 5 years along with 2 years of future estimates (dotted lines).
AbbVie FAST Graphs technical analysis Jan 13 (FG Chuck Carnevale 2023)
Earnings and Price
Current price of $152.22 shows it sells at an 11.04x P/E (earnings of $13.86), which is almost exactly where the price is today as I write this and sits on the normal P/E of 11.03x, which is actually called Fair Value. But, hold on, the chart does show decreased earnings, -15% for 2023, and an estimated fall in price coming too if it follows the normal blue line P/E of 11.03x. If the $11.75 earnings are correct, the price would = $129.60. So perhaps, M* is closer to a buy price than thought. The chart also estimates no earnings growth for 2024, so the price most likely will stay at a lower level.
Dividend Growth
The 5-year DGR is 17.7%; however, the 2-year is 9.3%, which is still significant for a 3.9% yielding stock. The last announced raise was to $1.48 from $1.41 per quarter, which represents about a 5% raise; disappointing from previous higher raises. $5.92 per year dividend and wishing and hoping for a 5% yield would = a price of $118.40 and it might just get there.
Summary/Conclusion/Recommendation
A trading alert was issued at the service to trim the position to <5% size seeing the revenue dip approaching and most likely a price decline. It continues to have a safe and rising dividend with a yield almost at 4%. The dividend growth rate is still 9.2% for the last 2 years and that is reason enough alone not to sell, but hold on to it. Thus, I am keeping at least 4% position size as yet.
Watch for price volatility most likely lower as earnings are revealed if they come close to the estimations suggested in FG. Therefore, I recommend to wait buying now, as you should be able to obtain this quality company at a lower price as 2023 progresses.
Happy Investing All!
Disclosure: I/we have a beneficial long position in the shares of ABBV either through stock ownership, options, or other derivatives. I wrote this article myself, and it expresses my own opinions. I am not receiving compensation for it (other than from Seeking Alpha). I have no business relationship with any company whose stock is mentioned in this article.
Additional disclosure: Rose’s Income Garden “RIG” has 80 stocks that are owned by Rose and listed at the Macro Trading Factory.
Macro Trading Factory is a macro-driven service, run by a team of experienced investment managers.
The service offers two portfolios: “Funds Macro Portfolio” & “Rose’s Income Garden”; both aim to outperform the SPY on a risk-adjusted basis, in a relaxed manner.
Suitable for those who either have little time/knowledge/desire to manage a portfolio on their own, and/or wish to get exposed to the market in a simple, though more risk-oriented (less volatile), way.
Each of our portfolios, spanning across all sectors, offers you a hassle-free, easy to understand and execute, solution.
