Summary:
- AbbVie has strong growth potential in various therapeutic and aesthetic markets, driven by novel drugs and market penetration.
- The company has raised its full-year earnings guidance and expects high-single-digit revenue growth until 2030.
- Technical analysis suggests that the stock may not see a significant breakout in the short-term, but mid-term momentum is showing promise of a major move.
deniskomarov/iStock via Getty Images
Investment thesis
I have analyzed AbbVie (NYSE:ABBV) from the perspective of the business opportunities stemming from global demographic developments, together with the state of the stock price based on the technical analysis. Although I find AbbVie to be a very strong business that will not go anywhere any time soon, its stock pricing does not indicate any short- or mid-term swing opportunity. I give it a “Hold” recommendation, based on the income potential (yielding 3.9% with the payout ratio at 46%) and a healthy single–digit revenue growth expected by the management till 2030, but not a momentum opportunity.
Many tailwinds and fighting its own headwind
I believe that AbbVie has a huge growth potential based on the dynamic growth of their novel drugs which offset the loss of the market to their blockbuster drug Humira. What I gathered from listening to the Q2 earnings call recording is rather a positive story of the potential of the therapies based on market penetration ahead of guidance, positive results from clinical trials, and obtained approvals.
AbbVie has a big potential to grow its revenues from the markets of gastroenterology, immunology, and aesthetics 5Allergan, producer of Botox, is an AbbVie company) markets, not to mention hematologic oncology. We need to be aware that in therapeutical domains we speak about non-communicable diseases (rheumatoid arthritis, systemic lupus erythematosus, IBD, atopic dermatitis, etc.), and very much related to the lifestyle and modern environment, which also means that the patients will be expected to live longer and need drugs for a longer period. Besides, for aesthetics, China is the 2nd biggest market for AbbVie and the company expects to roll out a number of new products there in coming years. Moreover, even the weight loss market can benefit AbbVie when people who lose fat wish to refill their hollowed skin. This may sound abstract to many Seeking Alpha readers but becomes common sense when one extrapolates the growth expectations of the middle class and the lifestyle that comes with the income. Already benefiting from the Chinese market, I would be interested to see how AbbVie will approach the Indian and Nigerian markets in the coming decades, where populations are expected to grow exponentially. I wish to mention a few of the highlights for both therapeutical and aesthetical business segments for those who are allergic to medical terminology:
-
Net revenues for Skyrizi and Rinvoq grew 50% YoY (to $1.883 B and $918 B, respectively) – I find it a mind-blowing rate. The US market share for psoriasis is now at 32%, double the share of the next closest biologic therapy.
-
Skyrizi provides promising CT results for vitiligo and ulcerative colitis, while a head-to-head trial against Otezla for moderate psoriasis shows hopes for better outcomes and patients’ compliance thanks to the model of quarterly injections for Skyrizi vs. two daily oral doses of Otezla, and also less gastrointestinal distress.
-
The FDA approved Rinvoq (upadacitinib) for adults with moderately to severely active Crohn’s disease.
-
Therapeutic Botox is hoped to tap into to European market for episodic and chronic migraine treatments.
-
Out of ca. $600 M lost on Humira, around $200 M was lost to AbbVie’s own new therapies, so this money was recaptured.
-
Having received the U.S. approval for Epkinly the first bispecific antibody for the treatment of adult patients with relapsed or refractory (r/r) diffuse large B-cell lymphoma (DLBCL), the company anticipates approval and commercialization in Europe and Japan later this year.
-
The FDA approved SkinVive, the first hyaluronic acid filler in the U.S. for improved skin smoothness of the cheeks. SkinVive and the recently launched Volux filler for jawline contouring are drivers of the company’s leadership position in the U.S. filler market.
It has to be admitted that some portfolios had decreased revenues, offset by growth in others. Based on positive outlooks, AbbVie raised the full-year adjusted earnings per share guidance by $0.23 and now expects adjusted earnings per share between $10.90 and $11.10. The total net revenues are estimated to reach approximately $53.4 billion, an increase of $1 billion. The long-term growth (till 2030) is expected to be in the high-single digits. The outlooks for the growth are explained
This guidance includes the following updated assumptions with more than half of the sales improvement attributed to our ex-Humira growth platform. We now expect Skyrizi global sales of approximately $7.6 billion, an increase of $200 million due to continued strong performance across all approved indications. We now expect neuroscience sales of approximately $7.7 billion, an increase of $300 million, reflecting robust prescription growth for Vraylar following the MDD approval as well as better-than-expected performance of Botox Therapeutics and Qulipta. And for aesthetics, we now expect global revenue of approximately $5.4 billion, an increase of $100 million, primarily reflecting momentum from Botox Cosmetic.
Last February the overview of the pipeline was presented. It’s worthwhile to see the spread of the R&D across the 5 domains:
2023 R&D Pipeline (AbbVie IR)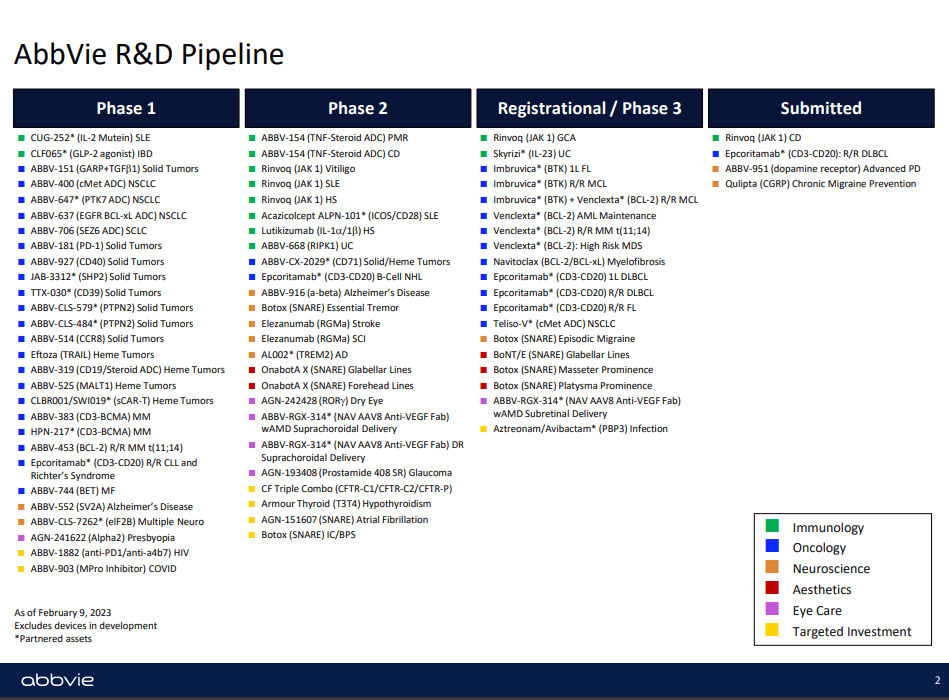
I cannot evaluate competently the scientific value of the pipeline, but as a layperson I find the applications of new products to be a significant bet on the demographic trends in the developed and developing economies, where people live longer and in stress, and spend disposable income on aesthetic treatments based on the world’s leading brand as Botox. I think the current pipeline and international markets provide AbbVie with an enviable moat. At the September 13 Morgan Stanley 21st Annual Global Healthcare Brokers Conference 2023, AbbVie announced also the news about the upgrade from Moody’s, having essentially paid off all the incremental financing from the Allergan transaction.
Technical analysis
I will analyze AbbVie from the perspective of a number of technical analysis tools and show the screenshots on the monthly and weekly Heikin-Ashi candles charts – each timeframe presented through two separate sets of indicators which I bundled in views called Chart 1 and Chart 2.
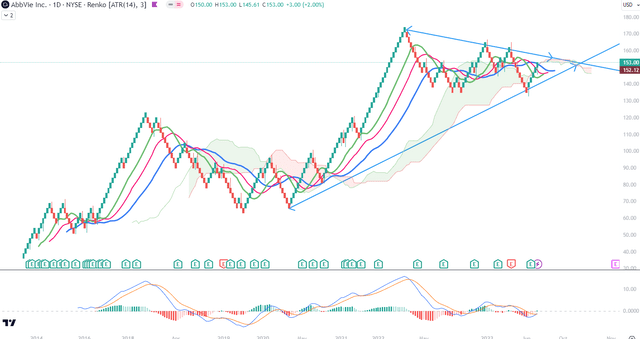
Those two timeframes will be complemented with a simplified daily Renko chart to reflect the price momentum. The details of my methodology can be found in my previous articles as those on Salesforce or Adobe.
-
The Long-Term Trend
For long-term trend analysis, I use monthly charts. In Chart 1 setup, we see the September green Heikin Ashi candle starting already above the level of the red line of Alligator, which is the Teeth line. The lines are in the bullish order, since the Lip line is above Teeth (red) and the top one is Jaw (blue), and all three of them are pointing upwards. The Ichimoku Cloud is green and has quite a stable upper edge despite two significant corrections since the beginning of 2022. Awesome Oscillator is above zero but it has been dropping since February which signals a bearish momentum. The On Balance Volume (OBV) line is rising but without dramatic shifts, marking similar intermediate highs and lows ever since the high of April 2022. The bottom pane indicates Revenues.
Chart 1 – Monthly (TradingView)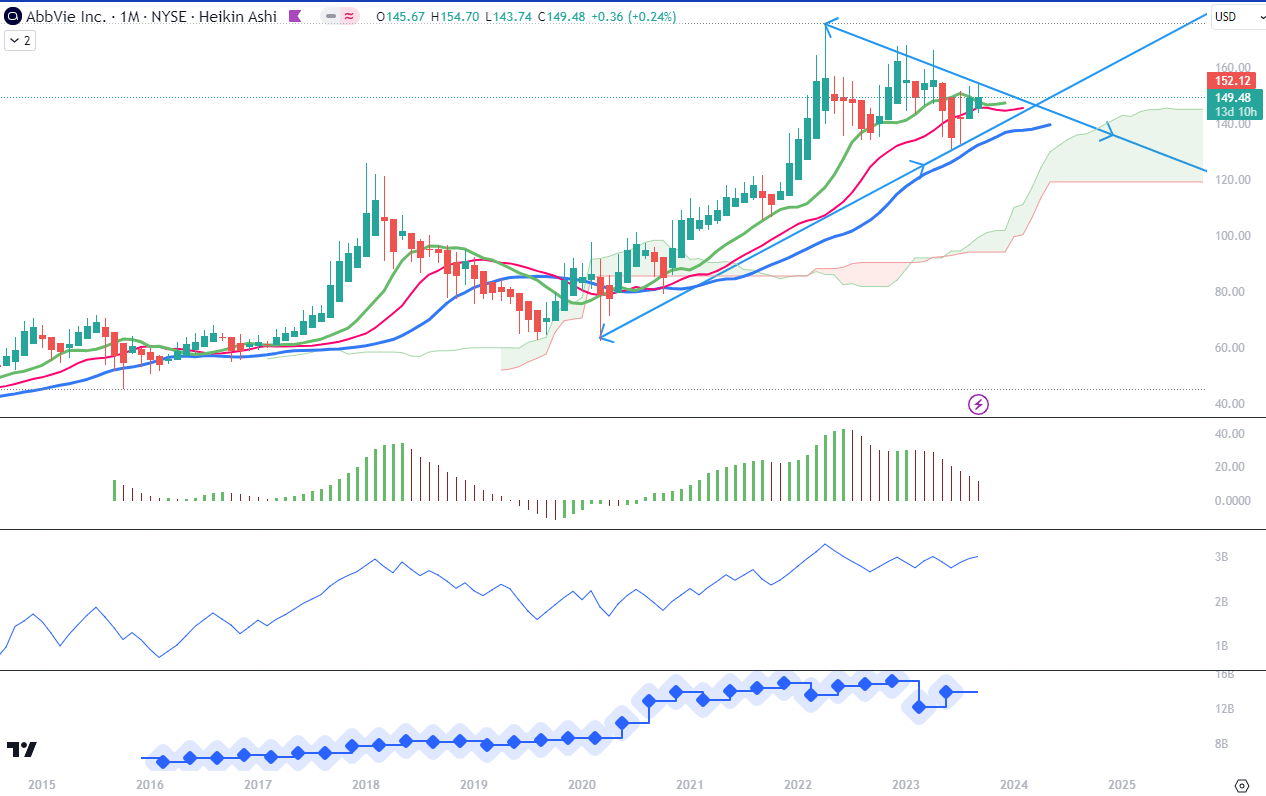
In Chart 2 setup, we see that the recent two monthly Heikin Ashi candles have not managed to open above the 10-month Moving Average, which by itself is also showing a flattening position, possibly to turn downward towards the 50-month MA. The Composite Index Divergence Indicator (CIDI) is showing the most positive setup from all the indicators on this chart where the CIDI line (purple) is on the cusp of crossing above the fast (green) moving average. But the fast average is still below the slow one and has to bounce back up towards and above the slow average (orange). Moving Average Convergence Divergence (MACD) is currently above zero but below its signal. It is flattening, as we also see the values of the histogram rising towards zero level. The crossing of MACD above its signal will be a positive signal. The Positive Direction Indicator (DI+) line moving parallel to the Negative Direction Indicator (DI-), does not show any significant drop but does not give positive signals of pick-up either.
Overall, I see technical signals that are not yet fully aligned but do not contradict each other. On this timeframe and on both chart set-ups, I could not be predicting a dynamic breakout any time soon. At this moment, a picture of indecision. Potentially, a more decided move could come by Spring 2024, where the trend lines I drew on Chart 1 are meeting. I started the lower trendline at the bottom of the March 2020 candle, at the level of $63. Since then the stock has tripled and this could mean that the movements of 2023 are meaning the distribution from strong to weak hands.
Chart 2 – Monthly (TradingView)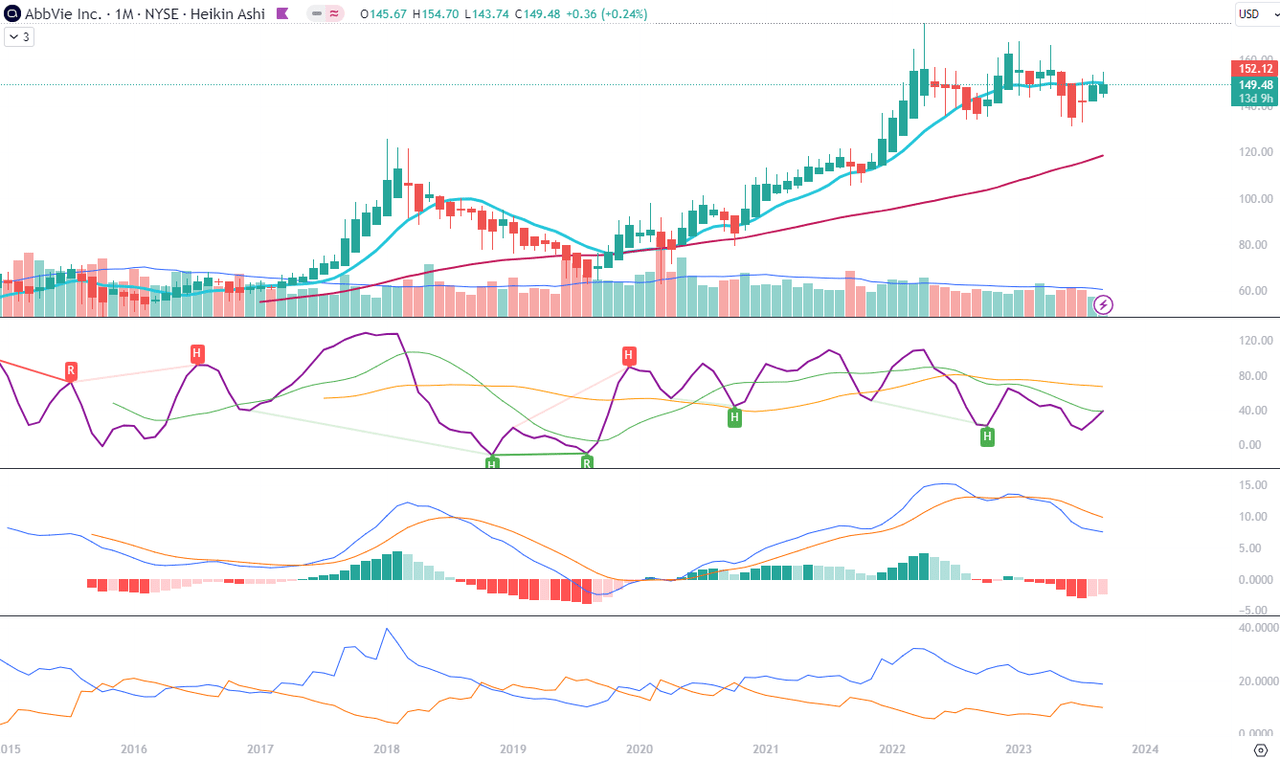
-
The Mid-Term Trend
For the mid-term trend analysis, I use weekly charts. As we see in Chart 1, there are visible some significant signs of weakening of momentum at the tops of prices. The highs and lows of the weekly timeframe swings mark lower and lower levels. Ichimoku Cloud has turned red and its upper edge oscillates around a resistance level of $150. Alligator’s lines are in a bullish setup but their levels are dropping. Combined with the lower tops of AO when above the zero level and deeper lows when below the zero level, I am reading an exhaustion of momentum for the last 12 months. The same loss of steam is visible in the lower levels of OBV.
Chart 1 – Weekly (TradingView)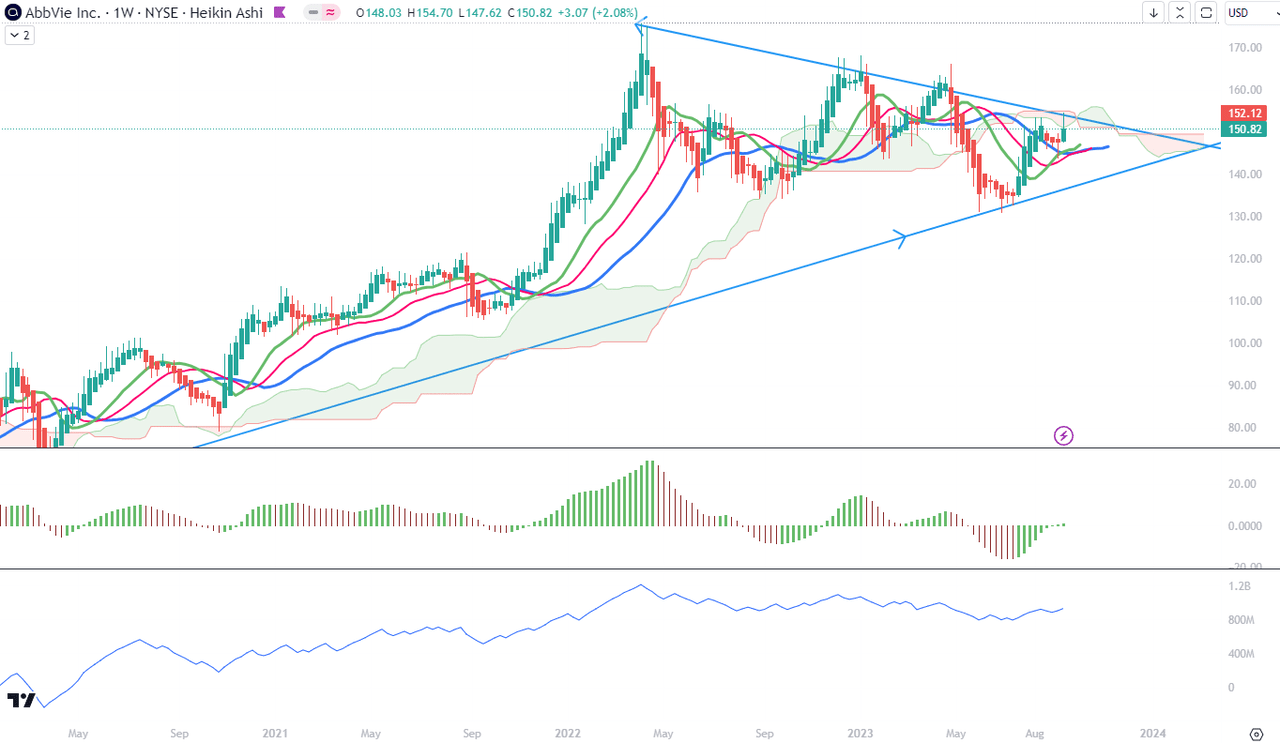
On Chart 2 we see the most promising and positive technical picture of both timeframes. We can appreciate the sharp bounce of the 10-week MA towards the 50-week MA and a possible crossover in the coming weeks. CIDI is picking up while staying above both fast and slow averages, and the former has recently crossed above the latter. MACD is crossing the zero level from below, but the signal line has to also approach this level to become more convincing. The DI+ line has just crossed above the DI- line, also presenting a promise of a starting mid-term swing. I think it will be quite telling when the top of the next swing will land: higher or lower than the previous tops of $162-166.
Chart 2 – Weekly (TradingView)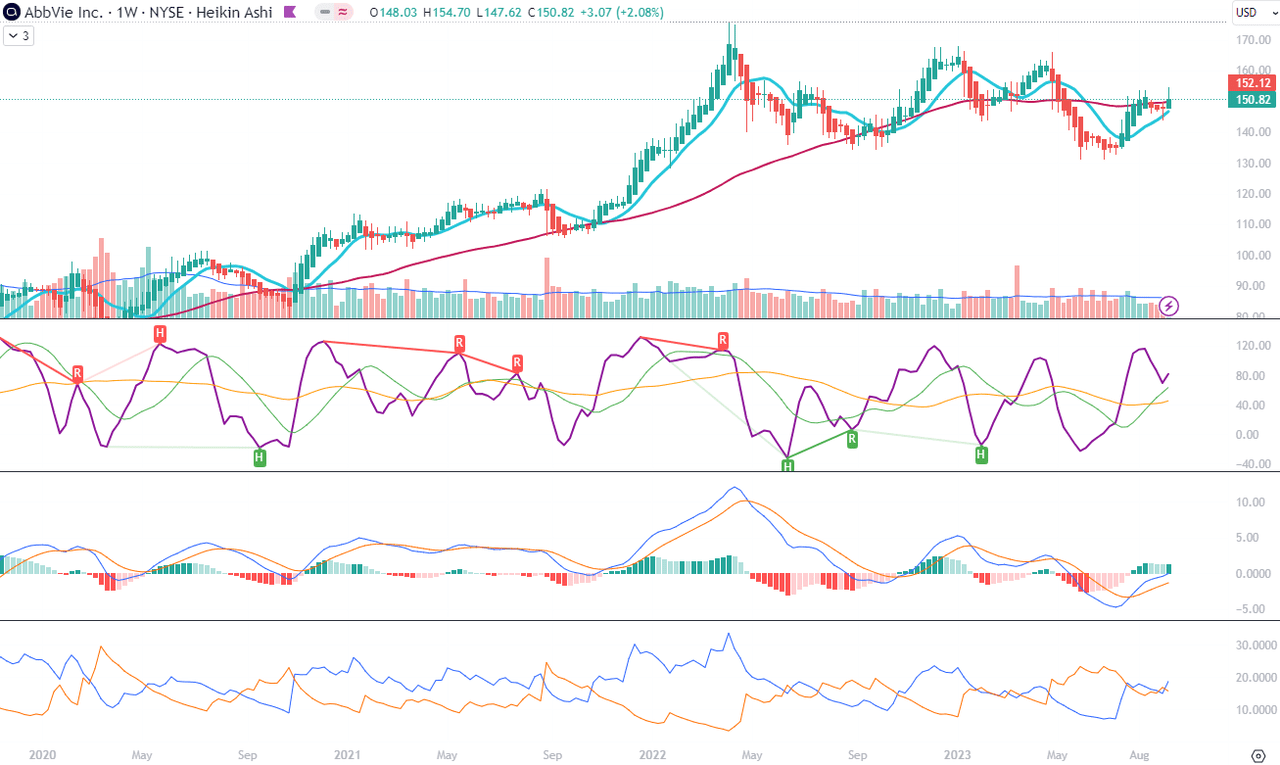
- Price Momentum
The daily Renko chart presents the most promising picture of the price momentum of the stock. In fact, it indicates a high probability of a breakout coming sooner than next year, on the basis of MACD crossing above its signal. However, this crossing is taking place below zero level, and Ichimoku Cloud is still red ahead. I would remain cautious regarding the volatility of the stock in coming months, especially if the price drops below $136 which is the level of the last three corrections on this chart.
Conclusions
AbbVie has a strong business but stock may not be the best bet currently. If you own it, keep on collecting the dividend but I suggest no dramatic changes to the position.
Analyst’s Disclosure: I/we have no stock, option or similar derivative position in any of the companies mentioned, and no plans to initiate any such positions within the next 72 hours. I wrote this article myself, and it expresses my own opinions. I am not receiving compensation for it (other than from Seeking Alpha). I have no business relationship with any company whose stock is mentioned in this article.
Seeking Alpha’s Disclosure: Past performance is no guarantee of future results. No recommendation or advice is being given as to whether any investment is suitable for a particular investor. Any views or opinions expressed above may not reflect those of Seeking Alpha as a whole. Seeking Alpha is not a licensed securities dealer, broker or US investment adviser or investment bank. Our analysts are third party authors that include both professional investors and individual investors who may not be licensed or certified by any institute or regulatory body.

