Summary:
- Despite his reputation as a growth investor, Peter Lynch offers valuable insights into dividend stocks, too.
- These insights are often overlooked by many of us due to his success with high-growth stocks.
- This article examines two healthcare stalwarts, AbbVie Inc. and Amgen Inc., through the lens of Lynch’s approach.
- The results show why I prefer AbbVie better.
- The analysis also reveals aspects of the stocks that are often ignored by many dividend investors, such as buyback yield and inventory management.
Richard Drury
Thesis
Peter Lynch is renowned for his success in identifying high-growth stocks (aka, 10-baggers) – so successful that his other insights are overshadowed. He offers invaluable insights into a variety of investments, encompassing stalwart stocks, turnaround situations, and of course fast growers. For many individual investors, stocks with stalwart status are far more manageable (say than turnarounds) because evaluation stalwarts often do not demand specialized expertise (say to evaluate key personnel) or extraordinary risk tolerance.
Another key advantage for stalwarts is that they typically can afford to pay (and many do) dividends. If you are familiar with our approach, you know that dividends provide a reliable backdoor for ordinary investors to gauge the finances and operation of a business reliably. This leads me to the thesis of this article. In this reminder of this article, you will see:
- How Lynch’s approach can be applied to two healthcare stalwarts: AbbVie Inc. (NYSE:ABBV) and Amgen Inc. (NASDAQ:AMGN).
- Why the results show ABBV to be a better dividend stock (which I own myself).
- And the unusual insights provided by the Lynch approach about these stocks such as buyback yield and inventory management. These aspects are often overlooked, yet they are so easy to check, so immune from subjective interpretation, and thus very telling of the business fundamentals.
For readers who cannot wait, here is the final scorecard of the comparison. And I will go over the points one by one next.
Lynch’s guidelines for dividend stocks
The approach used here is the guidelines that I gathered from Lynch’s various writings related to dividend stocks. The approach is summarized below as a checklist. The list is detailed in my earlier article and a brief recap is provided here for easy reference. I also intentionally: A) limited the items to those that involve as little subject judgment as possible; and B) picked guidelines to paint a holistic picture of the business ranging from dividend safety to valuation, financial strength, and operation efficiency.
- Dividend Track Record: A long history of consistently increasing dividends is highly valued by Lynch. His guides are to look for companies with a track record of stable dividends for at least 20 years.
- Valuation: Lynch popularizes the concept of the PEG, price-to-earnings growth, ratio. It is less well-known that he introduced a modified version of the PEG ratio just for dividends stocks. The modified ratio is called the PEGY ratio and is computed as the P/E ratio divided by the sum of the earnings growth rate and dividend yield. The concept is simple yet effective. If the dividends are high enough, investors should not expect (and do not need either) a high growth rate anymore. Just like the PEG ratio, Lynch favors PEGY ratios below 1x.
- Payout Ratio: It is common knowledge that a lower payout ratio is safer. However, later on, you will see that Lynch offers a few good points for interpreting the payout ratio.
- Share Buybacks: This is an aspect where Lynch’s insights can be helpful. Share buybacks are just as valuable for total returns as cash dividends (even more so if you consider tax implications). Yet, it is overlooked by many dividend investors. Plus, share buybacks are a strong indicator of financial strength (that a company has excess cash flow beyond capital expenditures and dividend obligations) and also management’s confidence in their own business.
- Inventories: This is another area most investors overlook yet crucially important and simple to check. As we will see later, Lynch has good reasons and shows a practical approach to using inventories to monitor the health and efficiency of the target business.
1. Dividend record
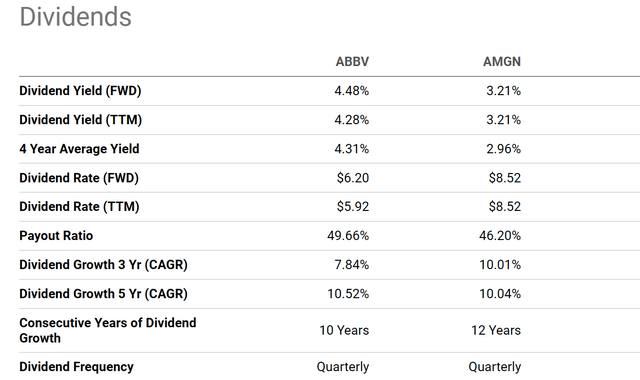
As just mentioned, Lynch favors stocks with a long track record of dividends (at least 20 years). AMGN is approaching this requirement, with 12 years of consecutive dividend payments behind itself (as you can see from the chart below).
Although, ABBV’s track record far exceeds this requirement. ABBV is a member of the S&P Dividend Aristocrats index, which tracks companies that have increased their dividends for at least 25 consecutive years. The chart below (and many other websites) quotes a shorter dividend history for ABBV only because it was a spinoff from Abbott Laboratories in 2013. As a result, many websites only track its dividend history since the spinoff. In my view, AbbVie’s record as part of Abbott Laboratories should be included when evaluating its dividend history.
If you agree with this view, then ABBV is the clear winner in this first round and is 1 point ahead of AMGN.
2. Valuation – P/E, PEG, and PEGY ratios
We are of course all familiar with P/E ratios. However, for stalwart stocks with long and stable dividend records, dividends serve as a much better measure of the true economic earnings. Thus, dividend yield and dividend growth serve as more reliable indicators for valuation and growth than accounting EPS, which can be subjective to accounting ambiguity.
Against this background, I will use the dividend growth rate in the past 3 years to represent their earnings growth in the calculation of PEG and PEGY ratios. As you can see from the chart above, ABBV has been growing its dividend at 7.84% in the past 3 years while Amgen is at 10.1%.
AMGN’s faster growth comes at a P/E premium. As seen in the chart below, AbbVie’s FY1 P/E ratio is about 12.37x while AMGN is at 14.29x. As a result, if we compute the PEG (P/E growth ratio), AbbVie’s PEG ratio would be 1.58x, both higher than Amgen’s 1.41x and also higher than Lynch’s ideal 1x.
This is where Lynch’s insights kick in. He promotes the use of PEGY (Price-to-earnings-to-growth and dividend yield ratio), rather than the common PEG ratio, for dividend stocks. The reason is quite straightforward and intuitive (and thus makes good sense). The return from dividend yield is an important part of the return driver. Thus, the PEGY ratio, by including the dividend yield as part of the valuation metric, provides a more accurate measure of the stock’s valuation. For stocks that pay a higher current dividend, investors can enjoy a good level of return even if they grow slower.
Based on this insight, you can see from the following table that ABBV’s PEGY ratio is exactly 1x, lower than AMGN’s 1.07x because of its higher current dividend yield. As a result, I view ABBV as the more attractively priced stock here, too, and assign it another point.
3. Dividend payout ratios
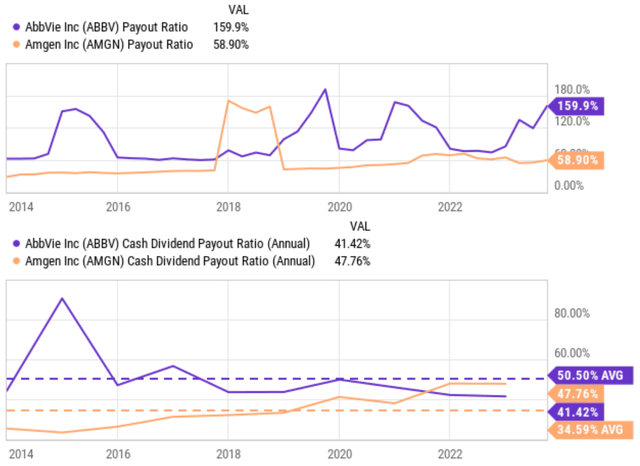
As aforementioned, accounting EPS can be subjective to accounting ambiguity. As a direct consequence of such ambiguity, earnings-based payout ratios can be volatile, and it is indeed the case here for both ABBV and AMGN. As you can see from the top panel of the chart below, earnings payout ratios for both stocks have fluctuated so widely that render their ratios to be meaningless.
Cash-based payout ratios can be a more accurate measure of their ability to pay dividends in this case (as seen in the bottom panel of the chart). The cash payout ratio is based on the company’s cash inflows from organic operations, which is less sensitive to accounting ambiguity. As seen, both AMGN and ABBV have been doing a great job managing their cash payout ratios. Their current cash payout ratios are in the 41% to 47% range, both very reasonable. These levels are already very close to ABBV’s long-term average of around 50% in the past 10 years. AMGN started paying dividends about 12 years ago, and it started with a very low payout ratio as seen. As a result, I don’t think its current 10-year average payout of ~35% is representative, and I expect the payout to stabilize around 50% in the longer term.
Given the comparable cash payout ratios and my above projections, I think it is a tie for ABBV and AMGN on this front with each getting 1 point.
4. Share repurchases
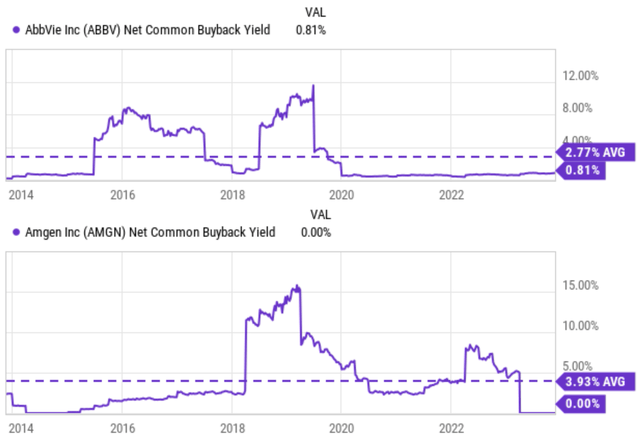
Historically, both ABBV and AMGN are regular buyers of their own shares, a good sign for their capital allocation flexibility and also management’s confidence in their own company. More specifically, as you can see from the chart below, ABBV has maintained an average buyback yield of 2.77% over the past decade. Its current buyout yield stands at 0.81%, lower than its historical average. AMGN, in contrast, has the opposite picture. Its historical average buyback yield (3.93%) is a lot higher than ABBV, but its current buyback (or the lack of it) is lower than ABBV.
Considering that A) they are both regular buyers in the past of their own stock, and B) the mixed comparison between their long-term average and their current buyback yields, I think it is another tie on this front, with each earning 1 point.
5. Inventory management
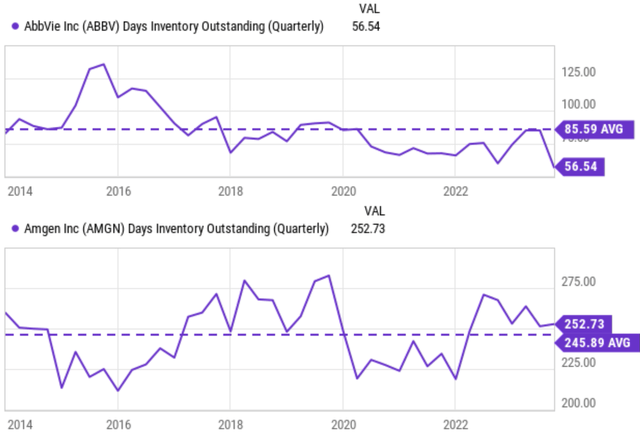
Finally, I will use their inventory levels as an indicator of their operation. As aforementioned, inventory is an area that most investors overlook. Yet inventory is one of the most reliable data, least subjective to subjective interpretation, and yet provides crucially important information about the business.
The chart below compares the inventory, measured in DIO (days of inventory outstanding), for both ABBV (top panel) and AMGN (bottom panel). As seen, my conclusion here is that ABBV outshines AMGN in managing inventory efficiency. ABBV’s DIO has been averaging ~86 days in the long term, and its current level is 56 days, far below its historical average. In contrast, AMGN’s DIO is far higher both in terms of the long-term average (245 days) and also the current level (252 days).
As such, I think ABBV is the clear winner on this front, and assign it another point.
Risks and final thoughts
As two popular tickers on the Seeking Alpha platform, risks associated with both ABBV and AMGN have been the subject of many other articles (including some of our own on them). Therefore, here I won’t repeat many of the discussions. Instead, I will focus more on the limitations of the approach I used here.
To start, this article obviously (and intentionally) ignored their pipeline, an important aspect of any pharmacy stock. The rationales are mainly twofold. Firstly, as just mentioned, their pipelines have been the subject of many other SA articles already. And secondly and more importantly, the purpose of this article is to limit the discussion to factors that are less sensitive to subjective judgment. Discussion of pipeline drugs involves a large degree of subjective judgement, or even speculations.
The second limitation of my approach involves the use of DIO to assess a company’s operation efficiency. While DIO certainly provides valuable insights into a company’s operation efficiency, it is subject to several limitations. The top two limitations in my mind are product-specific variations and management’s strategic inventory decisions. DIO can vary across different products due to production processes and sales cycles. For instance, companies with high-value and slow-moving products would have an inherently higher DIO than companies with low-value and fast-moving products. Also, companies may intentionally hold higher levels of inventory for strategic reasons, such as to ensure product availability, and buffer against supply chain disruptions, et al. My use of DIO above did not include these considerations. Nonetheless, higher inventory is higher inventory, which invariably causes higher costs, ties up more capital, and creates higher balance sheet risks.
Before concluding, let me clarify that both ABBV and AMGN are solid dividend stocks. I am not trying to argue that AMGN is a bad investment. My thesis is that, by the more objective metrics promoted by Peter Lynch, AbbVie Inc. is the more compelling investment under current circumstances (and again, it is the one that we actually hold ourselves). These metrics provide a rather comprehensive comparison of both stocks in terms of dividend safety, growth, valuation, capital allocation, and operation. ABBV outscores AMGN in most of these aspects.
Analyst’s Disclosure: I/we have a beneficial long position in the shares of ABBV either through stock ownership, options, or other derivatives. I wrote this article myself, and it expresses my own opinions. I am not receiving compensation for it (other than from Seeking Alpha). I have no business relationship with any company whose stock is mentioned in this article.
Seeking Alpha’s Disclosure: Past performance is no guarantee of future results. No recommendation or advice is being given as to whether any investment is suitable for a particular investor. Any views or opinions expressed above may not reflect those of Seeking Alpha as a whole. Seeking Alpha is not a licensed securities dealer, broker or US investment adviser or investment bank. Our analysts are third party authors that include both professional investors and individual investors who may not be licensed or certified by any institute or regulatory body.
As you can tell, our core style is to provide actionable and unambiguous ideas from our independent research. If your share this investment style, check out Envision Early Retirement. It provides at least 1x in-depth articles per week on such ideas.
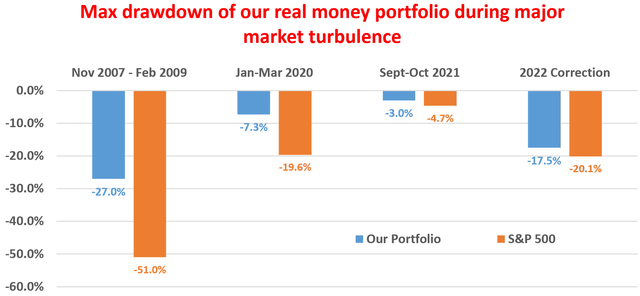
We have helped our members not only to beat S&P 500 but also avoid heavy drawdowns despite the extreme volatilities in BOTH the equity AND bond market.
Join for a 100% Risk-Free trial and see if our proven method can help you too.
