Summary:
- Accenture stock is overvalued by 9.2%, with a negative alpha of (2.1%) due to lower expected returns.
- Accenture is expected to maintain market share and profitability, with revenues projected to reach $106.2 billion by 2033.
- Despite strong financial stability and growth forecasts, current prices do not offer a good investment opportunity for Accenture stock.
HJBC
Executive Summary
Accenture, plc (NYSE:ACN) stock is currently trading slightly above their fair market price.
We expect Accenture to maintain its market share stable in the foreseeable future, securing its historically high profitability and solid free cash flow generation.
However, at current prices, our assumptions suggest that Accenture’s risk-reward profile has the potential to generate a slightly negative excess return (alpha 2.1%) as the implied required rate of return to justify current valuations (5.7%) is lower than the return investor should expect (7.8%) from investing in ACN stock.
Source – Analyst’s composition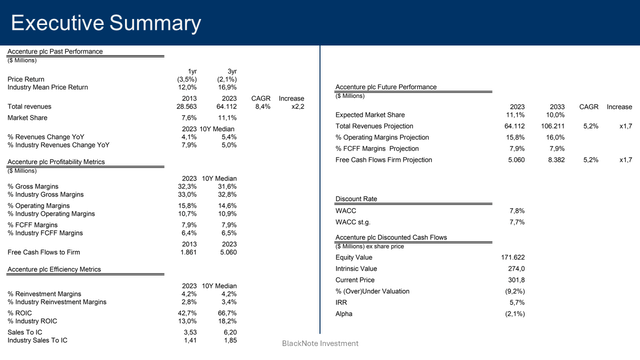
Business Model Analysis
Accenture is a U.S.-based company operating in the IT Services industry.
More specifically, it serves the Consulting and Digital Transformation segment, which involves companies providing consulting services to help businesses implement digital technologies to enhance their operations and efficiency.
In particular, Accenture business model is divided into five main segments: the Strategy & Consulting segment, offering consulting services to major businesses all around the globe; the Technology segment, offering a comprehensive set of solutions spanning from cloud, security, software engineering, data analytics, AI, and process automation; the Operations segment, offering outsourcing services related to accounting, supply chain, human resources, and other industry-specific operations; the Industry X segment, offering tailored services targeting unique clients’ needs; and the Song segment, tackling creative-oriented projects.
Revenue Analysis
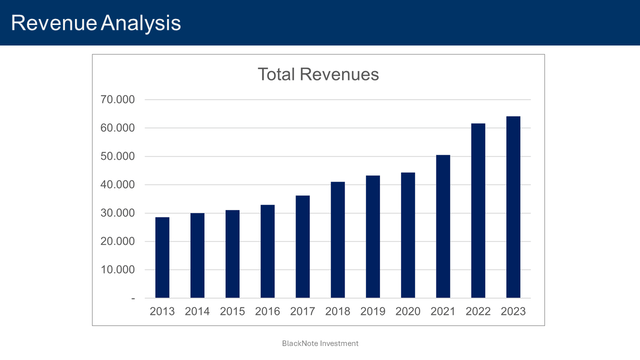
In 2023 FY Accenture’s total revenues increased by 4.1%, a worse performance when compared to the y-o-y industry growth rate of 7.9%.
Over the past decade instead, the company’s median revenue growth rate was equal to 5.4%, slightly higher than the industry median growth rate of 5% for the same period.
Over the most recent nine months of the 2024 FY revenues were stable registering a mere 0.75% increase, and declining (0.6%) in the Q3 y-o-y coming short by (0.38%)on analyst expectations.
Source – TrendSpider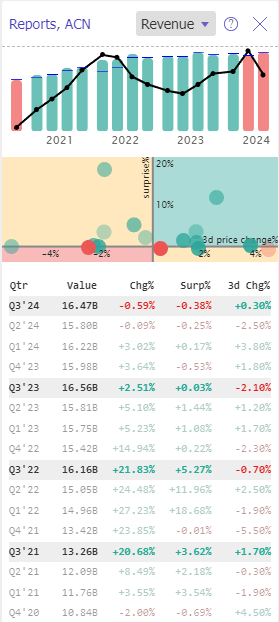
Profitability Metrics
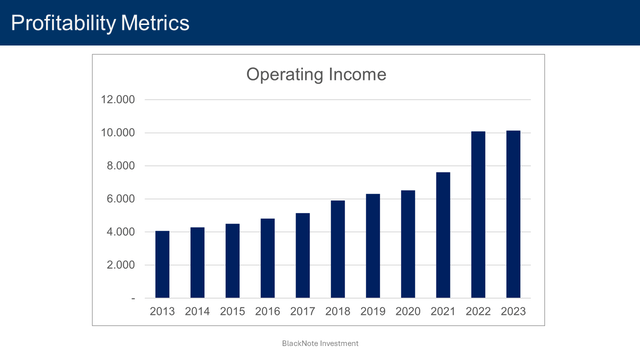
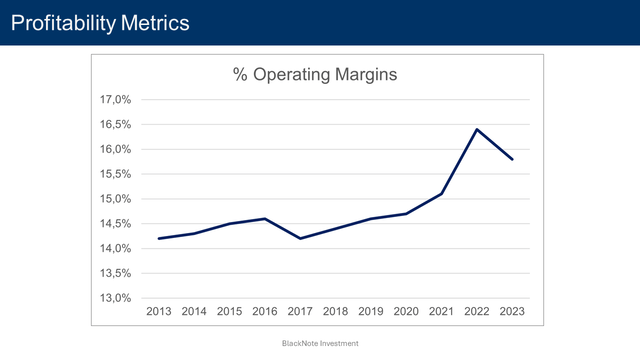
In 2023 FY, Accenture’s operating margin was 15.8%, better than the 2023 industry median value of 10.7%. The total operating profit was $10.1 billion, registering a timid increase of 0.4% y-o-y.
The median operating margin is equal to 14.6%, soundly better than the industry median value of 10% registered over the past decade.
Over the most recent nine months of the 2024 FY, the operating margin was equal to 14.9%, sliding (1.2%) in Q3.
From 2013 to 2023, Accenture has shown great profitability, well above the IT Services industry average values. Since 2017 the firm’s operating margin has undergone an encouraging upward trend, likely helped by the increasing demand for technology solutions implementation in the enterprise environment.
For such reason, Accenture’s operating margin is expected to remain pretty solid in the coming years and sit around 16% by 2033.
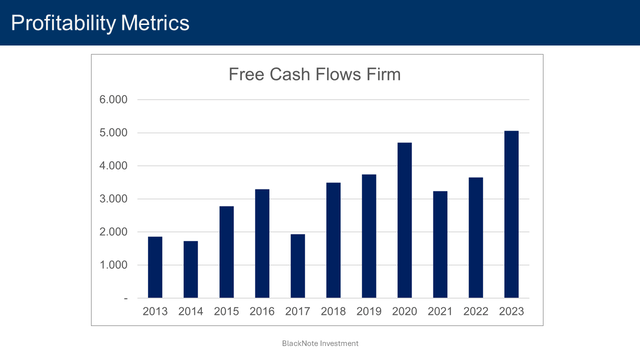
Looking at other measures of profitability, in 2023 FY the gross margin sat at 32.3%, in line with the median value of 31.6%, while the free cash flow margin was 7.9% – equal to the past decade’s median value of 7.9%.
Mimicking the positive trend of operating income, Accenture’s free cash flows to the firm have consistently improved over the past decade, registering a value of $5.06 billion in 2023 FY.
Reinvestments & Efficiency Ratios
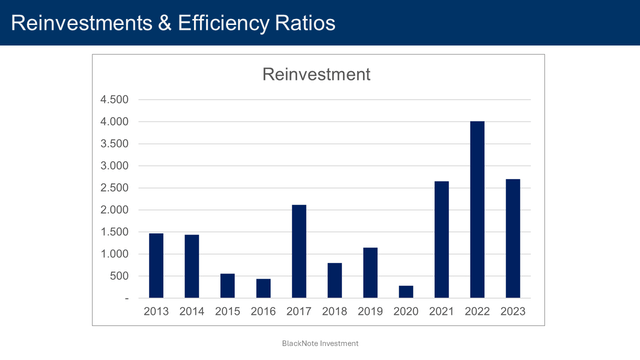
Over the past decade, the median reinvestment margin of Accenture stands at 4.2%, comprising net capital expenditures, acquisitions, and changes in working capital. When treating R&D expenses as capital expenditures due to their long-term value generation, this figure adjusts to 5%.
In terms of efficiency, during the period 2013-2023, Accenture boasts a median ROIC of 4.2% – compared to an industry median value of 3.4% – and a sales to invested capital ratio of 6.2, significantly higher than the industry median value of 1.85.
Financial Ratios
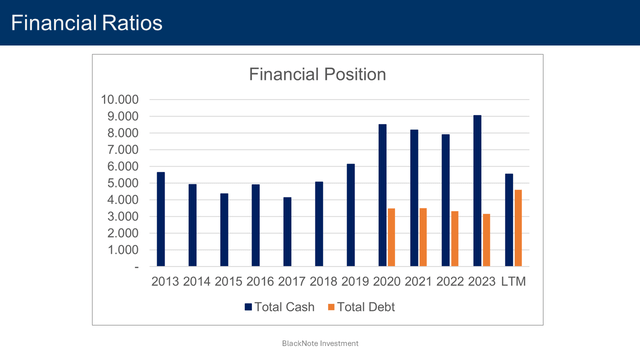
Briefly dwelling on financial ratios as of the most recent reporting period, the net cash position registers a positive value of $941 million.
The interest coverage ratio is a staggering 190.8 as of the LTM. The current ratio and the debt-to-equity ratio indicate solid financial stability sitting at 1.16 and 0.16, respectively – 2013-2023 median values 1.34 and 0.16 respectively.
Industry Overview
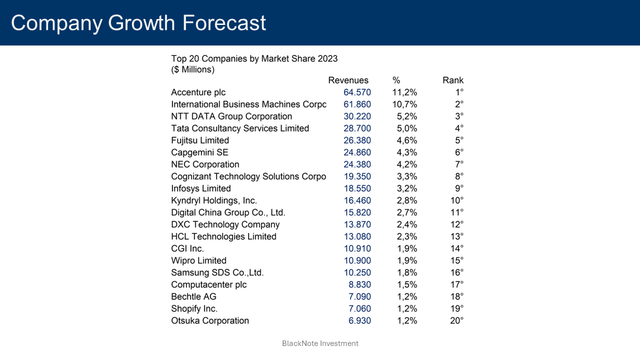
Accenture, with its $64.1 billion in revenues in 2023, has established a dominant presence in the IT Services industry, representing 11.1% of the industry’s total revenues of $578.1 billion.
Source – Analyst’s composition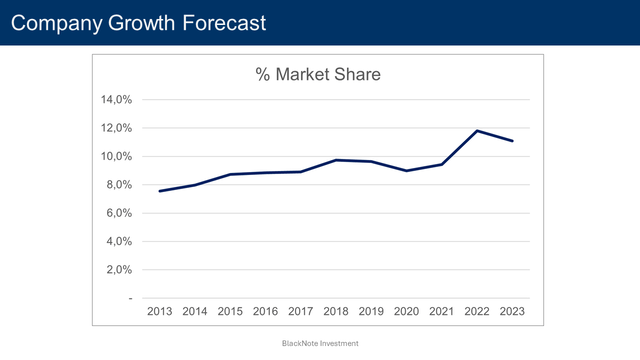
The IT Service industry is moderately competitive, especially as it is divided into three sub-segments: the Consulting and Digital Transformation segment, from which Accenture belongs; the Cloud and Infrastructure Services focused on providing cloud-based solutions to help business enhance their IT infrastructure; and the Industry Specific Platforms and Solutions segment, where also Accenture competes, which focuses on develop tailored solutions for specific industry needs.
The Cloud and Infrastructure Services segment is by far the most competitive of the three, comprising other than the big three cloud computing companies – namely Google, Amazon, and Microsoft – a myriad of small and medium-cap software companies targeting specific niches of the cloud industry.
However, the Consulting and Digital Transformation segment is far less competitive and more concentrated, with legacy players which have established a strong presence over the decades. Some of Accenture’s direct competitors are Capgemini SE, Infosys Limited, and Wipro Limited, as well as not listed companies like McKinsey, BCG, and Deloitte.
Industry Megatrends
From 2013 to 2023, the industry’s revenues grew at a CAGR of 4.3%, increasing 1.53 times from $378.3 billion to $578.1 billion.
Source – Analyst’s composition Source – Analyst’s composition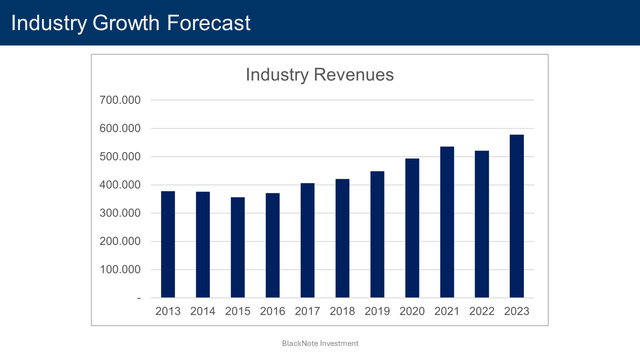
Thanks to the rapid emergence and evolution of new technologies, which disrupt and influence the way enterprises do business, the IT Services industry can rely on numerous catalysts to boost future growth.
Among the most prominent secular megatrends shaping the industry, we can find some of the most abused buzzwords when it comes to creating hype around stocks, such as Digital Transformation and Automation, Edge Computing, 5G, Cybersecurity, Big Data, Blockchain technologies, Industry 4.0, and Remote working.
Whether annoying buzzwords or not, it is undeniable that the world has long undergone the path towards digitalisation, and enterprises all around the globe can do nothing but adopt these new technologies to remain competitive.
Regulatory Compliance
Although the blossom of new and disruptive technologies benefits the IT Services industry, over the past years concerns for data protection and individual privacy protection have risen among governments and international institutions.
This led to the introduction of stringent regulations and frameworks that IT Services companies must comply with to ensure the protection of both their clients and their clients’ customers’ data and information from any potential threat.
Examples of regulations firms are obliged to comply with are Data protection and privacy regulations, like the EU GDPR and the Californian CCPA; Cross-border data transfer regulations, like the EU-U.S, a Data Privacy Framework providing a detailed mechanism for the transfer of personal data from the EU to the US; and Cybersecurity regulations.
Industry Growth Forecasts
To capitalize on such opportunities, over the past decade, collectively the industry registered a median reinvestment margin of 3.4%, which comprises investments made in capital expenditures, R&D, and acquisitions.
In terms of efficiency and return on investments, the IT Services industry median sales to invested capital in the period 2013-2023 is equal to 1.85.
Combining both the reinvestments made through the past decade and the industry’s ability to generate a return from the investments made, the 2024 expected growth rate for the industry is 8.7%.
The industry’s expected growth rate, and all the related industry assumptions, are based on my 2024 IT Services Industry Outlook.
By 2033, the IT Service industry revenues are expected to reach $1.06 trillion, increasing 1.83 times from the $578.1 billion registered in 2023 at a CAGR of 6.3%. We projected the industry’s expected revenues 10 years from now, applying the expected growth rate of 8.7% and allowing it to slowly decline as the industry approaches the economy’s perpetual growth rate, represented in this case by the USD risk-free rate.
Source – Analyst’s composition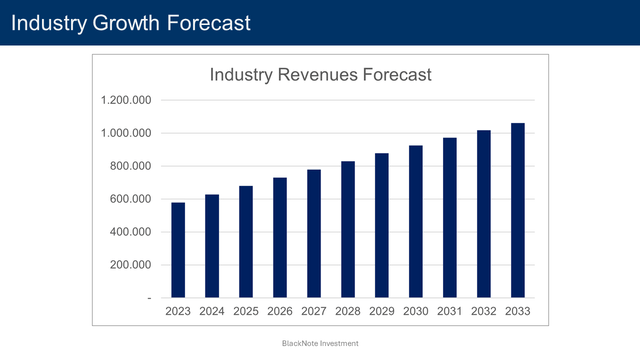
Company Growth Forecasts
Projecting Accenture’s future market share, over the period 2013-2023, its revenues grew at a CAGR of 8.4% increasing 2.2 times from $28.6 billion to $64.1 billion, while its market share improved from 7.6% to 11.1%.
Despite the secular trend boosting the IT Services industry growth, in the latest Q3 earnings call the management expressed their concerns about the consulting market’s short-term outlook:
Our client spending developed differently than we expected at the beginning of the fiscal year. And these conditions continue with clients prioritizing large-scale transformations, which convert to revenue more slowly, while limiting discretionary spending, particularly in smaller projects, with delays in decision-making and a slower pace of spending as well.
However, despite the temporary headwinds, given Accenture’s already strong presence in the market as a legacy consulting company, in the coming years, we can expect it to maintain a market share of around 10%.
With these assumptions, Accenture’s revenues are projected to reach $106.2 billion by 2033, representing an increase of 1.7 times from the 2023 revenues of $64.1 billion at a CAGR of 5.2%.
Free Cash Flows Forecasts
Moving on to projecting future cash flows, considering the already consolidated business model, and low capital investments to run its operations, we expected Accenture to maintain a FCFF margin around its historical level of 7.9%.
Synthesizing all underlying assumptions and strategic directions – $106.2 billion in revenues by 2033, 16% operating margin, and FCFF margin around 7.9% – Accenture’s free cash flows to the firm are anticipated to swell to $8.4 billion by 2033.
This projection represents an increase of 1.7 times from the $5.06 billion reported in 2023, reflecting a CAGR of 5.2%.
Source – Analyst’s composition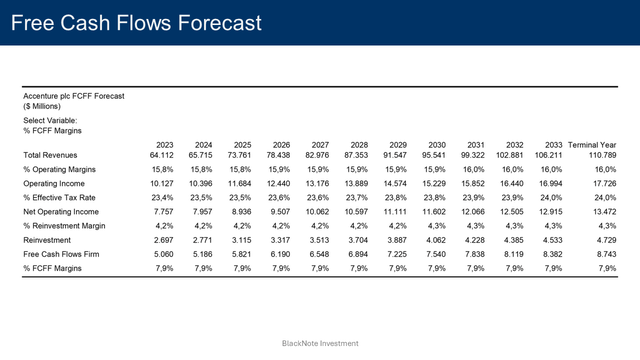
Valuation
Applying a discount rate of 7.8% for the next 10 years, and a discount rate of 7.7% in perpetuity, we obtain that the present value of these cash flows – after adjusting for debt and cash on hand – is equal to $171.6 billion or $274 per share.
Compared to the current prices, Accenture stocks are slightly overvalued by 9.2%.
To justify current stock prices, the implied rate of return would be equal to 5.7%.
It implies investing in Accenture at the current prices would deliver a negative alpha of (2.1%) as it would generate lower returns compared to the actual return investors should expect given the assumption on cash flows and risk made so far, equal to 7.8%.
Source – Analyst’s composition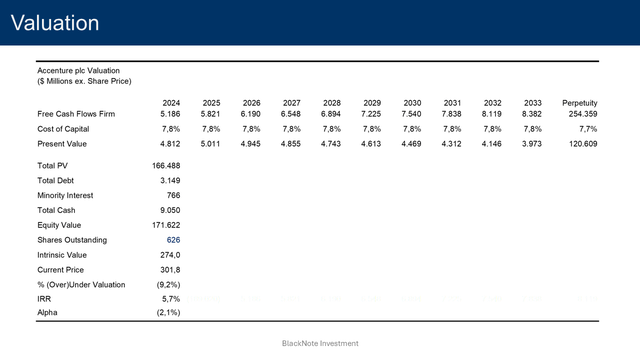
The street target for Accenture – based on 27 different analyst expectations – is sitting at $348.38 per share, as of the 10th of July 2024, with 13 street recommendations expressing the rating “Hold”.
Looking at the trading seasonality trend for Accenture, the chart shows that over a 6-year period, Accenture stock prices have on average a 71% chance of going up in July, indicative of a strong bullish trend in the short term.
Source – TrendSpider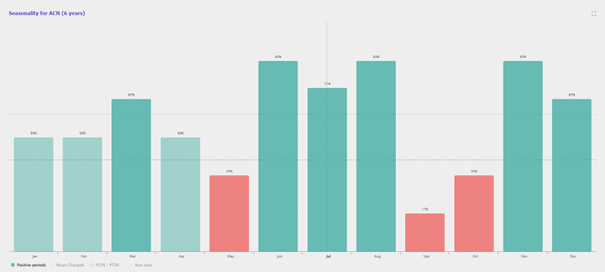
Discount Rate
To determine the appropriate discount rate, we employ the WACC method, which considers both the cost of equity and the cost of debt.
The cost of equity – 7.8% – is derived using the USA equity risk premium of 4.5% – as of July 2024 – the current USD risk-free rate of 4.3%, and the company’s beta of 0.79. The company’s beta is based on the IT Services industry’s unlevered beta of 0.72.
The cost of debt – 5% – represents the expected return demanded by debt holders and is influenced by the company’s specific risk profile and the broader market conditions. It is computed considering the current USD risk-free rate of 4.3%, the company’s default spread of 0.69%, and the USA default spread of 0%.
With a current Equity to Enterprise Value of 98.7% and a Debt to Enterprise Value of 1.3%, Accenture’s discount rate for the next 10 years is 7.8%.
As Accenture enters the steady state, both the company’s beta and company default spread are expected to approach the industry’s median values of 0.82 and 0.69%, respectively.
Mature companies often have more predictable cash flows and may change their financing strategies. We anticipate Accenture to adjust its Equity to Enterprise Value and Debt to Enterprise Value towards the industry median of 94.4% and 5.6%, respectively, reflecting a more typical capital structure for a stable company.
With these assumptions, the discount rate used to discount the cash flows in perpetuity is 7.7%.
Conclusion
In conclusion, despite the consulting firm is poised to maintain a strong presence in the market, while delivering strong profitability and cash flows to its shareholders, at current prices, our assumptions suggest that Accenture’s risk-reward profile has the potential to generate a slightly negative return not representing a good investment opportunity.
If and when Accenture’s stock prices correct towards its intrinsic value, at that point it has the potential to represent an interesting opportunity for investors looking for mature companies with solid and stable free cash flows.
Analyst’s Disclosure: I/we have no stock, option or similar derivative position in any of the companies mentioned, and no plans to initiate any such positions within the next 72 hours. I wrote this article myself, and it expresses my own opinions. I am not receiving compensation for it (other than from Seeking Alpha). I have no business relationship with any company whose stock is mentioned in this article.
Seeking Alpha’s Disclosure: Past performance is no guarantee of future results. No recommendation or advice is being given as to whether any investment is suitable for a particular investor. Any views or opinions expressed above may not reflect those of Seeking Alpha as a whole. Seeking Alpha is not a licensed securities dealer, broker or US investment adviser or investment bank. Our analysts are third party authors that include both professional investors and individual investors who may not be licensed or certified by any institute or regulatory body.
