Summary:
- Accenture reported strong financial performance in Q1 2024, highlighting its solid financial health and profitability.
- The company’s revenue, earnings per share, net income, and gross profit margin shows growth and potential for future profitability.
- Technical analysis suggests that the stock price has completed a price correction and is likely to continue higher, presenting investment opportunities.
Bloomberg/Bloomberg via Getty Images
Accenture plc (NYSE:ACN) reported strong financial performance in Q1 2024 which highlights the company’s solid financial health. The growth in revenue, operating margin, earnings per share, net income and gross profit margin indicates Accenture’s capability to boost profitability in the coming years. This article discusses the financial and technical performance of Accenture to project the next direction of the stock price and identify investment opportunities for investors. It is observed that the stock price remains within strong bullish momentum and is likely to continue higher.
Revenue and Profitability Trends
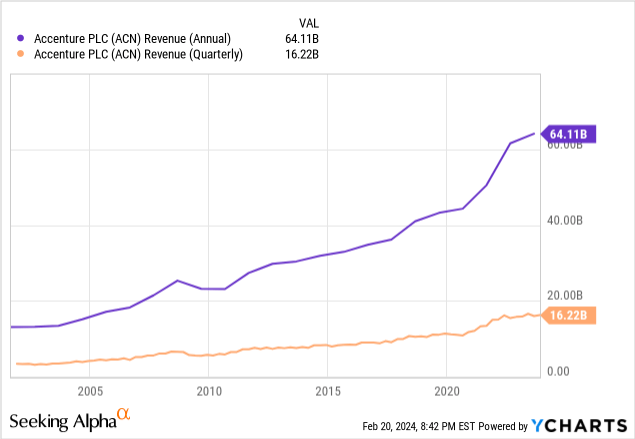
Accenture reported revenue of $16.22 billion for Q1 2024 as compared to the revenue of $15.75 billion in Q1 2023. The revenue for full year 2023 was also positive at $64.11 billion. The chart below presents the quarterly and yearly revenue for Accenture and shows a strong positive momentum during the past years. The strong positive momentum shows the company’s potential for profitability in the coming years. This revenue growth highlights the company’s financial strength in the challenging economic environment. The strong revenue growth indicates the strategic investment in future growth areas and maintaining strong client relationships. This is highlighted by the $450 million in new bookings related to AI technologies.
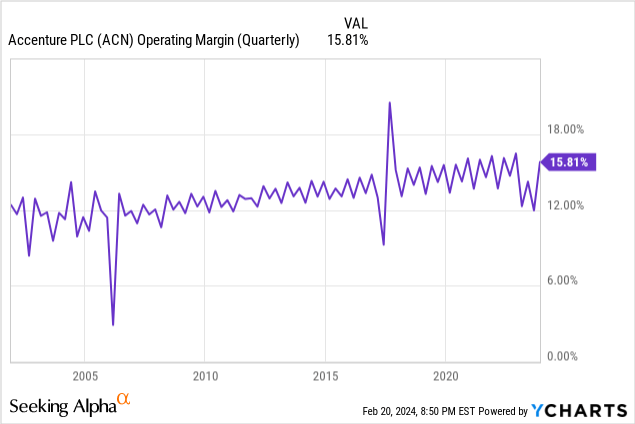
Despite the growth in revenue in Q1 2024, the operating margin of Accenture dropped to 15.81% from 16.5% in Q1 2023. This decline may be due to the increase in total operating expenses which increased to $13.66 billion in Q1 2024. However, the operating margin is significantly higher as compared to 12% in Q4 2023 as shown in the chart below. The slight year over year decrease in operating margin along with the strong improvement from the previous quarter indicate that despite facing operational challenges on annual basis, the company has started to recover and shows operational efficiency.
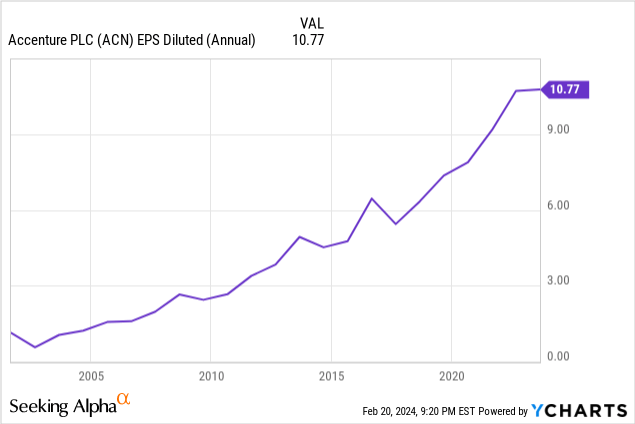
On the other hand, the earnings per share also increased by 6% to $3.27 compared to Q1 2023. The yearly numbers also show a strong growth in earnings per share as shown in the chart below. The earnings per share for 2023 was $10.77 as compared to $10.71 in 2022. This strong performance highlights the company’s ability to increase shareholder value within global business dynamics.
The company also shows strong growth in new bookings as compared to Q1 2023. The new bookings for Q1 2024 were $18.4 billion as compared to the $16.22 billion in Q1 2023. The strong growth in new bookings indicates that the company is delivering innovative solutions to clients.
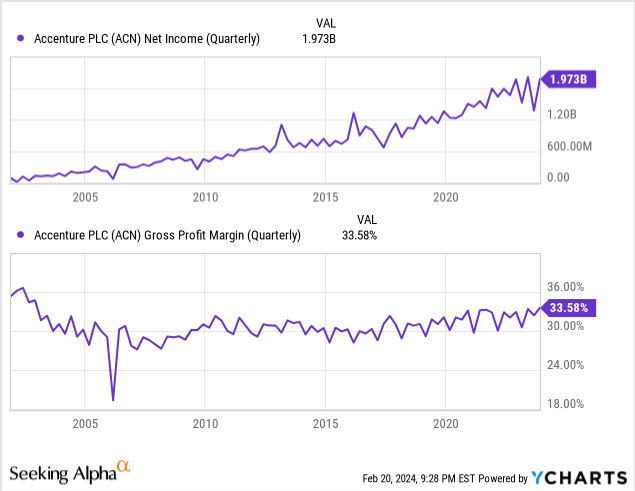
The company shows strong profitability potential as seen by the strong growth in net income and gross profit margin. This growth is evident in the chart below which shows that the net income has increased to $1.973 billion in Q1 2024 which is 43.74% higher than the net income in Q4 2023. Moreover, the gross profit margin improved to 33.58% from 32.9% in Q1 2023. The impressive surge in net income with the improvement in gross margin highlights Accenture’s financial health and its capability to increase profitability.
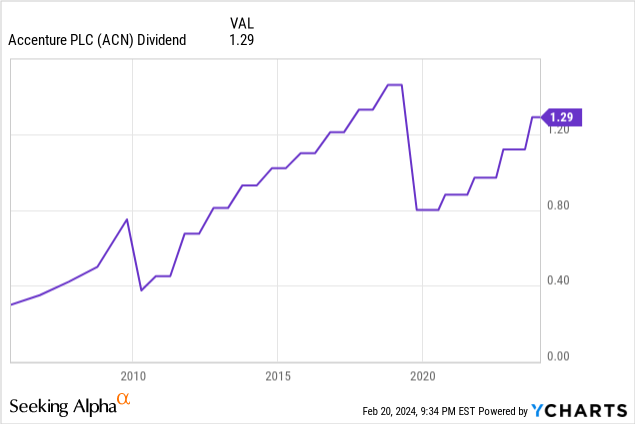
Accenture is also committed to deliver strong values to shareholders by using the dividend and share repurchase activities. The company has been increasing its dividend consistently in the past as seen in the chart below. The recent increment of the quarterly dividend was 15% to $1.29 per share which presents confidence in the financial health. Additionally, the company repurchased 3.8 million shares for a total of $1.2 billion during the quarter which further highlights the dedication to shareholder returns.
Accenture’s Strong Growth Expectations
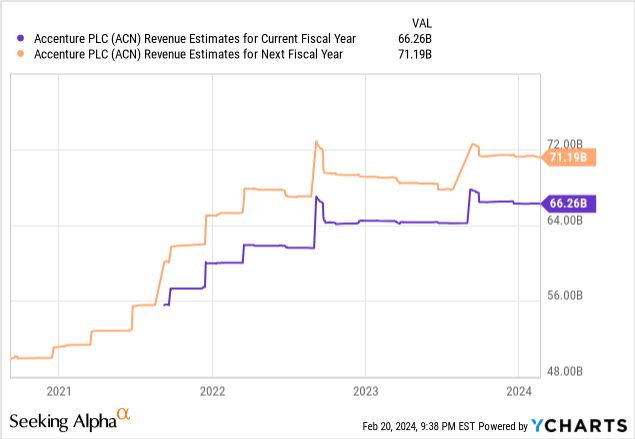
Accenture is expected to announce Q2 2024 earnings in March 2024 and expects strong profitability. The revenue for Q2 2024 is expected to be $15.90 billion. This strong growth expectation in Q2 is also translated into the full year as the revenue for 2024 and 2025 are expected to be $66.26 billion and $71.19 billion, respectively.
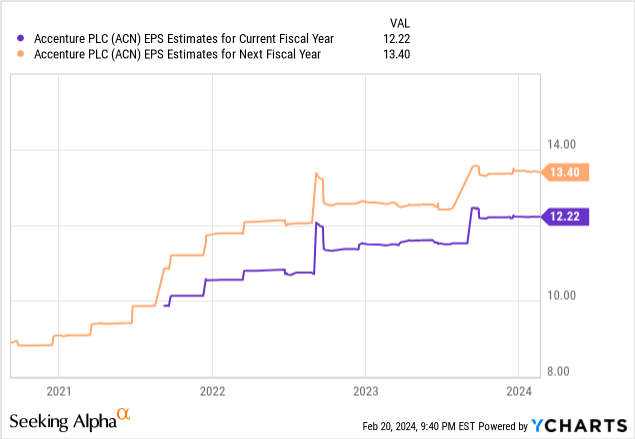
The chart below presents the earnings per share estimates for 2024 and 2025 which are expected to be $12.22 and $13.40, respectively. As per the Q1 2024 earnings release, Accenture also expects to return $7.7 billion to shareholders in dividends and share repurchases in 2024 which underlines a robust financial strategy and shareholder commitment.
The industry outlook for consulting and professional services in technology and digital transformation is optimistic, which is driven by the continuous demand for technological advancements. Accenture is continuously taking steps to remain successful within this changing industry by initiating strategic acquisitions. Accenture has recently completed the acquisition of Insight Sourcing and agreed to acquire GemSeek which signals strong growth potential using expansion and diversification of services. The acquisition of Insight Sourcing enhances the company’s capabilities in private equity, consumer goods, retail, technology and industrial sectors which strengthens the sourcing and procurement practices. Similarly, the plan to acquire GemSeek positions Accenture to benefit from the customer experience analytics market which is expected to grow significantly in coming years.
Moreover, Accenture’s study on 5G Spectrum Harmonization commissioned by CTIA, highlights the significant economic potential of 5G technology which shows the need for digital infrastructure to drive future growth. The focus on 5G industry also reflects the company’s potential in technology trends and positions it to diversify clients with 5G technology.
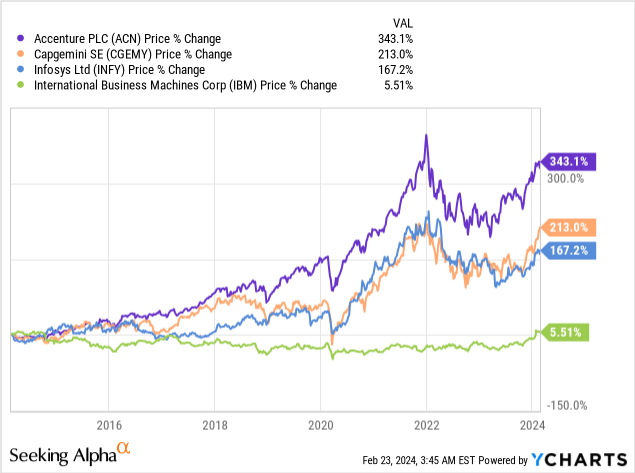
Furthermore, the chart below illustrates the percentage change in the price of Accenture relative to its competitors. It is observed that the company has grown 343.1% during the past decade which is much higher growth as compared to its competitors. This strong price increase reflects strong market performance and high level of investor confidence in Accenture’s business, strategies and future prospects. This growth also indicates that Accenture has strengthened its position as the market leader in consulting and professional services industry.
These strong growth expectations for 2024 along with the strategic acquisitions and focus on 5G technology indicate the company’s strategic positioning and the focus on growth areas of digital transformation and cloud services. The strong performance in first quarter sets the solid foundation for this strong growth and profitability in the full year.
Long Term Trends & Technical Levels
The strong financial performance of Accenture is also observed in the yearly chart below as the stock price remains within the parabolic pattern. The stock price is continuously moving higher from 2008 low of $18.67 to the record high of $403.84 in 2021. The drop in 2020 within this parabolic move was due to the market uncertainty and temporary slowdown in consulting and outsourcing service demand during Covid-19 crisis. The stock price of Accenture hit the bottom in 2020 due to the global economic downturn which led to the uncertainty and temporary slowdown in consulting and outsourcing service demand. However, this drop was offset by the strong surge in demand for digital cloud and security services. The company benefited from this demand and reported strong earnings during this period.
ACN Yearly Chart (stockcharts.com)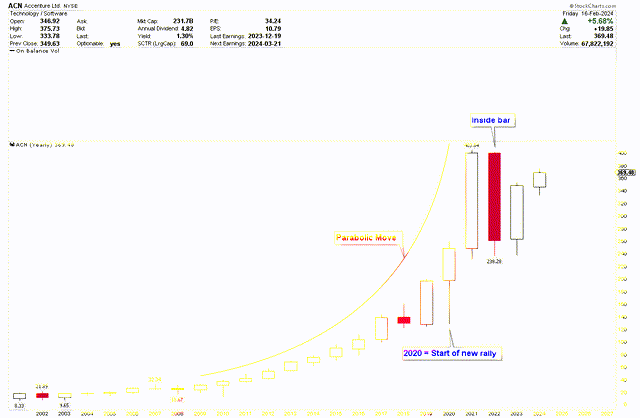
This strong surge in market demand resulted in the formation of bullish hammer for 2020 which highlighted the strong growth opportunities and produced a strong foundation for another strong rally in 2021. This price growth after the pandemic strengthened the parabolic pattern. However, the price correction in 2022 was deep but the yearly candle for 2022 formed inside bar which shows the price compression and indicates a strong move following the breakout above $403.84. Based on the strong earnings expectations, the probability of an upside breakout is high.
To further understand bullish price development, the monthly chart below illustrates the important levels using the Fibonacci retracement tool. The extension of this tool from the 2010 low of $13.76 to the record high shows that the 2022 price correction was supported at the 38.2% Fibonacci retracement. Normally, strong uptrending markets support at 38.2% before the continuation of the next strong rally. The price behavior after the support at this level is positive as seen by the multiple price reversal at the level.
ACN Monthly Chart (stockcharts.com)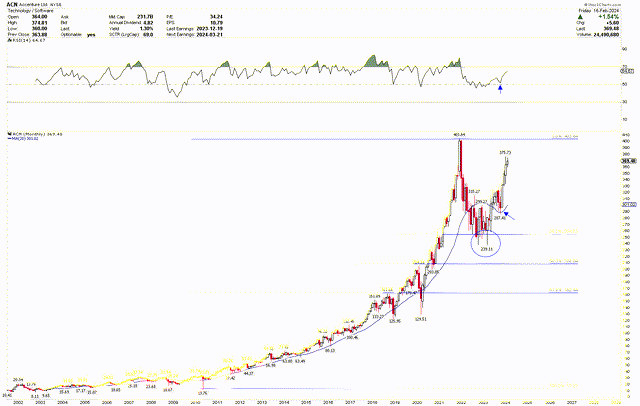
It is interesting to observe that the stock price also remains above the 20-month moving average which indicates the strength of this trend. The October 2023 low at $287.41 was reversed after hitting this moving average which highlights the continuity of the upward trend. It is interesting to observe that RSI was also supported at the mid-level when the price hit the 20 months moving average in October 2023. The strong months of November 2023, December 2023 and January 2024 indicate that the stock price is ready to move higher.
Investor Consideration
Based on the above discussion, the stock price is maintaining a strong bullish momentum and any price correction is viewed as a buying prospect for investors. The weekly chart below further strengthens this bullish outlook. The strong price correction in 2022 and the foundation at the 38.2% Fibonacci retracement are also observed in the weekly chart. This chart shows the price reversal by forming an inverted head and shoulder with the head at $238.28 and shoulders at $288.47 and $287.41. The neckline of this pattern lies around $330 which was already broken. This breakout indicates that the price has more potential to go much higher from these levels.
ACN Weekly Chart (stockcharts.com)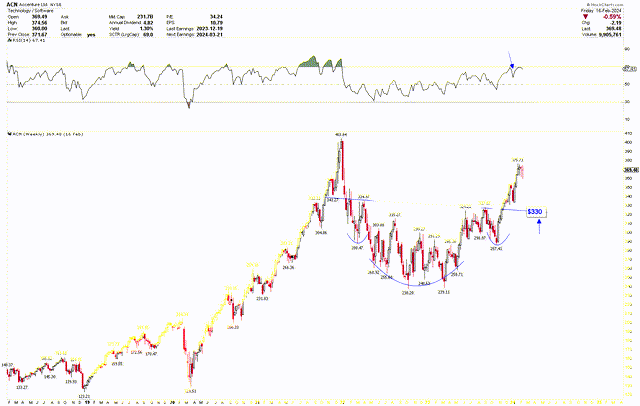
As the price is expected to go higher based on the strong fundamentals and technical, investors can consider buying the stock at current level and accumulate more positions if the stock price corrects back towards the neckline at $330.
Market Risk
Despite strong revenue growth, the company faces risks to maintain profitability trend due to the strong competition. The company’s strategic investment in AI which is highlighted by the $450 million in new bookings shows risks related to the recent development in AI technologies. The company needs to continuously adapt and innovate to remain competitive in the market. The acquisition of Insight Sourcing and GemSeek may be complex and time consuming in the short term. Moreover, the market drop in 2022 has resulted in an inside bar which shows the strong price volatility. If the stock price fails to break the record highs, it may consolidate within the wide ranges. On the other hand, a break below the neckline of $330 will negate the short term bullish outlook and could initiate further price correction. A monthly and quarterly close below $254.63 would indicate further price weakness.
Bottom Line
In conclusion, the financial performance of Accenture in Q1 2024 presents the company’s strong financial health and growth opportunities. Despite the slight dip in operating margin in Q1 2024, the company’s growth in new bookings positions the company for future growth. The increase in revenue, earnings per share, net income and gross profit margin in Q1 2024 further shows the company’s sustainability during economic downturns. On the other hand, the technical analysis also illustrates a strong bullish momentum with the price having bottomed at 38.2% Fibonacci retracement level. The strong price development after this bottom as seen by the formation of inverted head and shoulders, highlights the buying opportunities for investors. These price patterns indicate that the parabolic move is likely to remain intact in coming years. Investors can consider buying Accenture at current levels and add more positions if the stock price drops to $330.
Analyst’s Disclosure: I/we have no stock, option or similar derivative position in any of the companies mentioned, and no plans to initiate any such positions within the next 72 hours. I wrote this article myself, and it expresses my own opinions. I am not receiving compensation for it (other than from Seeking Alpha). I have no business relationship with any company whose stock is mentioned in this article.
Seeking Alpha’s Disclosure: Past performance is no guarantee of future results. No recommendation or advice is being given as to whether any investment is suitable for a particular investor. Any views or opinions expressed above may not reflect those of Seeking Alpha as a whole. Seeking Alpha is not a licensed securities dealer, broker or US investment adviser or investment bank. Our analysts are third party authors that include both professional investors and individual investors who may not be licensed or certified by any institute or regulatory body.
