
Summary:
- The special situation Activision Blizzard is going through provides an attractive investment opportunity for patient investors.
- The company has excellent business qualities and the current valuation makes it an attractive entry point given the company’s unique circumstances.
- Given the company’s ability to generate cash and its limited ability to dispose of it, the downside risk is expected to be limited even if the M&A deal fails.
Maksim Labkouski
Investment Thesis
Activision Blizzard (NASDAQ:ATVI) is a leading global game developer and publisher. The company possesses strong competitive advantages and as a result, it has been able to maintain sustainably high ROICs above 20% for the previous years. Furthermore, the company has ample reinvestment opportunities to make its businesses keep growing for years to come because the gaming industry is big and dynamic. You may not know that games are the largest revenue-generating form of entertainment. It is bigger than pay TV, streaming services, movies, music, or books.
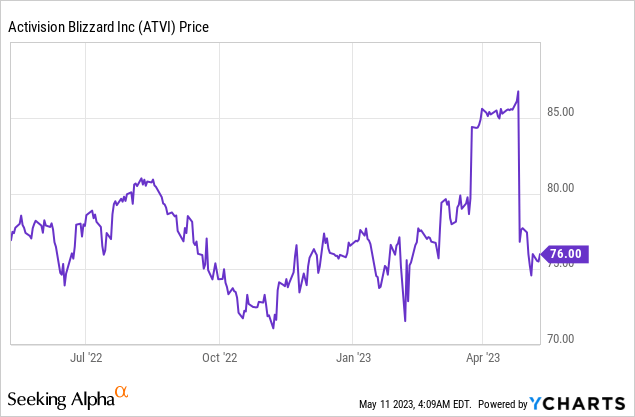
While the company has good qualities for investment, its share price has shown significant volatilities since the announcement of a merger agreement with Microsoft Corporation (MSFT) on January 18, 2022. MSFT agreed to acquire the company for $95.00 per share. So, the rationale of investing in the stock seemed simple. If you buy the stock now and the merger is complete, then you can make money. But whether the deal will be complete or not is getting uncertain. The deal is now under inspection by competition authorities across countries including the EU, UK, and the United States. The UK and USA did not approve the deal while the EU did. As a result, the share price has been moving up and down according to investors’ expectations about the deal. There are now both attractive opportunities and increased risks.
My investment thesis is not about betting on the deal completion. Given the company’s strong business and current valuation, I believe it could be a worthwhile investment even if the merger is not complete. It will take quite a long time to conclude in the current situation where the competition authorities of each country came to different conclusions. According to the details of the deal with Microsoft, the company has a limited ability to pay dividends and repurchase shares. Likewise, I assumed the company will not be able to spend large sums of money, such as acquisition or investment in the business, in the middle of the deal. Then the company’s cash is expected just to keep piling up, and with short-term interest rates remaining high, the value of the cash will increase significantly. A ton of cash piled up inside the company will provide the downside protection, even if the deal fails. Furthermore, large-scale dividends or share buybacks can be expected through the accumulated cash. If the deal is successful, significant capital gains can be obtained, so it gives a good investment opportunity for investors with patience in either direction.
Company Overview
The company is a game developer and publisher on a global scale with sales of over $8.8 and $7.5 billion in 2021 and 2022, respectively. The gaming industry is competitive, but the company operates with well-diversified business segments which help the business perform with stability.
Gamers usually enjoy game contents via consoles, PC and mobile. In the past each platform used to have a distinct market and characteristics, but recently, the difference became blurred because of the development of cloud gaming services, which enable gamers to play games using various devices regardless of the differences in processing power of the devices. So, consoles and PC games are increasingly converging but mobile games still have their distinct features due to the processing power and gaming styles that are more casual compared to consoles and PC.
The company has effectively catered to each platform by its franchises over the long time. As shown in the table below, each operating segment plays a role in each platform. According to CMA, the cloud gaming services market will grow approximately twice by 2025 or 2026. Given the company’s strong activity in each platform, the development of cloud gaming services will benefit the company in the long term.
| Revenue mix | Activision | Blizzard | King | Other | Total |
| Console | 22.1% | 1.2% | 0.0% | 0.0% | 23.3% |
| PC | 6.1% | 16.0% | 0.9% | -1.0% | 22.0% |
| Mobile | 6.4% | 4.3% | 36.1% | 0.0% | 46.7% |
| Other | 0.6% | 0.7% | 0.0% | 6.7% | 8.0% |
| Total | 35.1% | 22.2% | 37.0% | 5.7% | 100.0% |
Source: 2022 annual report
Furthermore, the company also generates revenues across the continents indicating its contents appeal all over the world. The revenue distribution by geographical regions is shown below.
| Geographic Region | Americas | EMEA | Asia Pacific | Total |
| Revenue ($M) | 4,208 | 2,237 | 1,083 | 7,528 |
| Revenue (%) | 56% | 30% | 14% | 100% |
Quality analysis
The gaming industry is big and dynamic, and it provides a great growth potential for the company. According to FTC, the gaming industry is the largest category in the entertainment industry, with revenues far exceed those of the film and music industries. It is estimated to be worth more than $170 billion in global revenues, five times greater than global movie box office revenues.
Thanks to the huge size of the industry, there are huge opportunities for game developers. For example, Call of Duty, one of the company’s long time top-selling franchises, delivered more than $800 million worldwide following the first three days from its release on October 28, 2022 according to the company’s press release. This accomplishment surpassed any of the biggest worldwide box office openings of 2022 such as Top Gun: Maverick, and Doctor Strange in the Multiverse of Madness.
However, few can achieve the same results as the company because economies of scale are very important in the game industry. Games are classified into AAA, AA, and indie games. AAA games are developed by large development studios and require significant budgets and time. AA games have significantly lower budgets and lack the scale and reach of AAA games. Lastly, small, self-financed and independent companies develop indie games. For AAA games, upfront investment increases the hurdles that competitors must overcome in terms of game content, development time, and budget. And since not only game development, but also publishing and marketing are important for a game’s success, the scale of a company that can make and publish AAA game content is critical in the game industry. The company has a history of releasing several AAA games such as Call of Duty, Warcraft, and Diablo for the past decades.
The value chain of the game industry has three stages, development, publishing, and marketing. The company participates in all value chains. One of the core activities of the company’s operation is its own gaming platform, Battle.net. It helps the company maintain competitive edges by reducing distribution costs and maximizing the effectiveness of marketing activities. Doing these, the company is able to make various promotion more visible to customers and increase gamers’ participation by adding social community functions.
These operating activities enable the company to benefit from economies of scale. Games are products that can easily maximize economies of scale because the company can increase the sales without incurring additional costs once developed. Furthermore, since games have high initial investment costs, it also creates a significant barrier to entry, protecting itself from competitors. Games can enjoy not only economies of scale but also network effects. This is because the more players play a game, the lower the cost of developing and operating the game, and the higher the value of the game, resulting in high switching costs to gamers. As a result, the company has enjoyed about four hundred million MAUs every year as shown below.
| FY17 | FY18 | FY19 | FY20 | FY21 | FY22 | FY23 | |
| MAU (millions) | 385 | 356 | 409 | 397 | 371 | 389 | 368 |
Source: SEC filings
Thanks to great economies of the company, its ROICs have shown exceptional performance.
| FY15 | FY16 | FY17 | FY18 | FY19 | FY20 | FY21 | FY22 | |
| ROIC | 16.0% | 13.7% | 13.6% | 21.9% | 17.3% | 29.5% | 33.3% | 16.5% |
| ROIC, adjusted | 19.6% | 20.0% | 17.8% | 17.6% | 12.0% | 20.2% | 22.2% | 13.1% |
| ROIC, adjusted without goodwill | 57.1% | 50.8% | 53.8% | 50.4% | 31.6% | 51.4% | 51.7% | 28.9% |
It is sustainable into the future because the company has strong intellectual properties that are well known worldwide like Call of Duty, World of Warcraft, Diablo, and Candy Crush Saga. New games are released every year, and there are not only active players but also dormant players expecting new games from the company. The list of the past game release is as follows and it shows the company’s ability to release game contents on a regular basis. The ability to consistently publish games will continue to help the company maintain the high ROICs in the future.
The list of the past game content release (ATVI)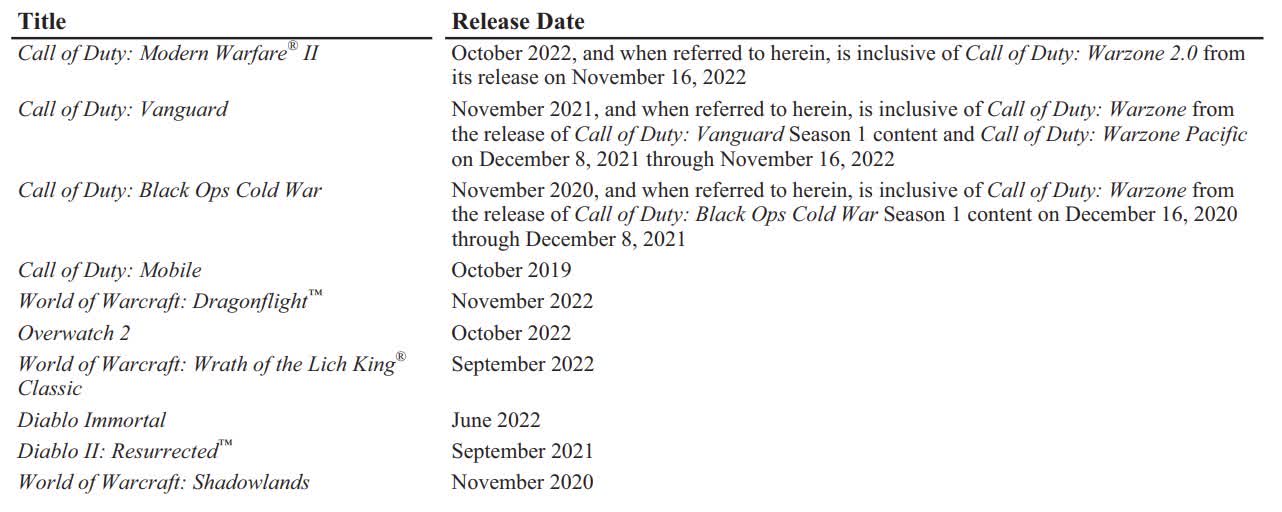
Valuation
The company’s ability to generate cash flows has been strong thanks to its competitive advantages I mentioned above. The company can generate recurring revenues but shows some fluctuation depending on the game release schedules. Furthermore, with economies of scale and high capital efficiency, the company can generate an excellent free cash flow. As a result, the company has more cash than the total debt. It is noteworthy the company has a limited ability to pay dividends and repurchases shares because of the deal with MSFT. Considering these facts, the company’s cash flows are very stable and comparable to treasury bonds.
I made several assumptions to estimate the company’s future cash flows. First, sales growth rate is estimated at 5.0% over the next 5 years. I took into account fluctuating trends in the past and a higher growth potential of the gaming industry than overall GDP growth rates. Next, the ratio of the cost of goods sold and operating expenses to sales were estimated by using the average over the past 5 years. Lastly, operating profits were adjusted by capitalizing expensed investments such as marketing and R&D expenses. My valuation results are below.
| (Unit: Million, %) | LTM | FY24 | FY25 | FY26 | FY27 | FY28 |
| EBIT | 1,991 | 2,464 | 2,587 | 2,716 | 2,852 | 2,995 |
| (+) Marketing | 1,243 | 1,206 | 1,267 | 1,330 | 1,397 | 1,466 |
| (+) R&D | 1,476 | 1,375 | 1,443 | 1,516 | 1,591 | 1,671 |
| (-) Marketing Amortization | (1,077) | (1,132) | (1,157) | (1,194) | (1,239) | (1,292) |
| (-) R&D Amortization | (1,020) | (1,111) | (1,164) | (1,220) | (1,279) | (1,341) |
| EBIT, adjusted | 2,613 | 2,801 | 2,976 | 3,149 | 3,322 | 3,499 |
| Current Enterprise Value | 50,843 | |||||
| Forward Earnings Yield | 5.1% | 5.5% | 5.9% | 6.2% | 6.5% | 6.9% |
| 5 Yr Treasury Yield | 3.5% | 3.5% | 3.5% | 3.5% | 3.5% |
My computed LTM earnings yield (EBIT / EV) is 5.1%, and then rising to 6.9% over the next 5 years. Given that the 5-year treasury yield is around 3.4%, this is a reasonable valuation level. Moreover, investing in the company gives us an option for significant capital gains upon approval of the acquisition. Therefore, I consider this an attractive investment opportunity.
Risks
Some might think that a merger failure will have a negative impact on the company’s share price, but as I explained, the company is a good company with strong economic moats in a high-return industry. I think investing in the company at the current valuation provides asymmetrical return/risk profiles even if the company is not going to be acquired by MSFT.
The company will not be able to spend big bucks to return cash to current shareholders by means of dividends or buybacks. It is also safe to say the company may not attempt to acquire other companies or invest heavily in something else. So, I expect the cash on hand will continue to accumulate until the deal is officially concluded. In addition, short-term interest rates have been consistently high, making the company’s cash more valuable. Thanks to the increased cash and high short-term interest rates, the company’s interest income increased from $5 million in 2021 to $165 million in 2022 according to the 2022 annual report.
The current valuation also provides an attractive margin of safety. Before the deal was announced, the share price was around $65 per share. At the time of writing, the price was up about 16% to $76 per share. In contrast, 2021 and 2022 operating profit, net income, and net cash (cash minus total borrowings) increased by around 20% each as shown in the table below.
| 2021 | 2022 | Change | |
| Operating income ($M) | 1,670 | 1,991 | 19.2% |
| Net income ($M) | 1,513 | 1,858 | 22.8% |
| Net Cash ($M) | 6,526 | 8,136 | 24.7% |
| Shares outstanding (#M) | 779 | 784 | 0.7% |
| Per share | |||
| Operating income | 2.1 | 2.5 | 18.4% |
| Net income | 1.9 | 2.4 | 22.0% |
| Cash | 8.4 | 10.4 | 23.8% |
Considering the share price before the deal announcement was depressed because of non-operating issues, the current valuation provides an attractive margin of safety.
Analyst’s Disclosure: I/we have no stock, option or similar derivative position in any of the companies mentioned, but may initiate a beneficial Long position through a purchase of the stock, or the purchase of call options or similar derivatives in ATVI over the next 72 hours. I wrote this article myself, and it expresses my own opinions. I am not receiving compensation for it (other than from Seeking Alpha). I have no business relationship with any company whose stock is mentioned in this article.
Seeking Alpha’s Disclosure: Past performance is no guarantee of future results. No recommendation or advice is being given as to whether any investment is suitable for a particular investor. Any views or opinions expressed above may not reflect those of Seeking Alpha as a whole. Seeking Alpha is not a licensed securities dealer, broker or US investment adviser or investment bank. Our analysts are third party authors that include both professional investors and individual investors who may not be licensed or certified by any institute or regulatory body.