Summary:
- This is a technical analysis article on Salesforce, Inc. We upgraded our previous article’s Hold signal to a Buy and added Salesforce to our 2024 Model Portfolio.
- Salesforce is still facing the challenges we outlined in our first article, but as you will see on the chart below, our signals have improved. Salesforce has just announced AI Cloud.
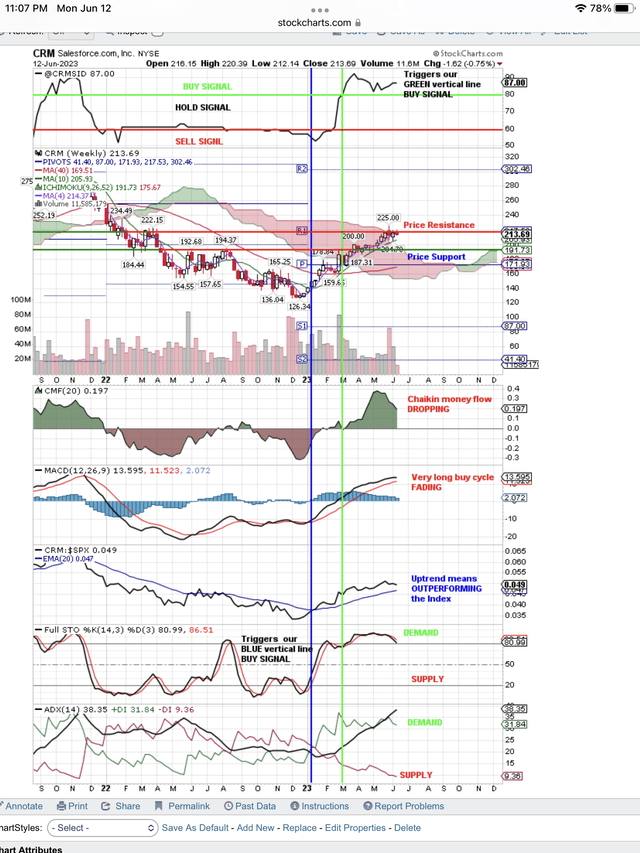
- At the top of the chart is our proprietary signal using both fundamentals and technicals. You can see that Salesforce has improved from Hold to a Buy Signal.
- Now we want to update our due diligence by using the articles and Quantitative ratings published by Seeking Alpha.
- Salesforce will stay in our Model Portfolio as long as it continues to outperform the Index because that is the goal of our Model Portfolio.
da-kuk
We added Salesforce, Inc. (NYSE:CRM) to our 2024 Model Portfolio because the Hold Signal, noted in our last article, improved to a Buy Signal using both fundamental and technical factors. At the top of the chart below, you can see our proprietary SID signal moving from a Hold to a Buy. We will continue to hold CRM in the model portfolio as long as it continues to outperform the Index, as indicated by the name of our service, “Daily Index Beaters.”
Every company will be affected by Artificial Intelligence, AI, and none more so than CRM. It just announced its new AI Cloud product, selling for $360,000. Everyone knows how difficult it is to prospect for new customers. AI improves the ability to do that, and likewise, the ability to keep a customer once you close that prospect. This is how CRM helps its customers and will continue to do it much better using AI. CRM’s customers will now become smarter in prospecting and customer service with the advance of AI Cloud. CRM is not new to AI and has a head start. Add this to the changes that CRM had already initiated to improve its bottom line results.
However, before we become too excited about CRM, we want to update our due diligence on the company and all its moving parts. We do that by reading articles on Seeking Alpha and digging into the fundamental metrics tracked by the Quantitative ratings on SA.
If you go to these SA ratings, you will see it gets good grades for Growth, Revisions, Momentum and Profitability, but a weak grade for Valuation. Our proprietary Buy Signal is a lagging indicator because it dislikes overvalued stocks. You can see this at the top of the chart below. Our vertical, blue line, purely technical Buy Signal, leads our lagging proprietary Buy Signal, a green vertical line, because this signal uses both fundamentals and technicals and has a bias against overvalued stocks.
Here is the chart showing our green, vertical line Buy Signal at the top and our much earlier, purely technical, blue line Buy Signal triggered by the Full Stochastic signal at the bottom of the chart:
Salesforce Blue and Green Vertical Line Buy Signals (StockCharts.com)
At the top of the above chart is our proprietary SID Buy Signal, and you can see the green, vertical line we drew when the signal went from Hold to Buy. That enabled us to put it in the 2024 Model Portfolio shown below. It is a lagging signal, but much more reliable than a purely technical signal.
Near the bottom of the chart is the purely technical Buy Signal that triggered our vertical, blue line Buy Signal. This is an early, leading indicator, but not as reliable as the SID Buy Signal at the top of the chart.
As you can see where price is shown, using the color-coded candlestick, that we have drawn horizontal lines identifying Resistance and Support levels. You can see price is at a Resistance level and that is creating some short-term push back on the rising price.
Below that is Chaikin Money Flow, in the green, but dropping, and that is a sign of price weakness. We will watch this signal carefully to see if it stops the move-up, by continuing to drop.
Next is the MACD signal, and it also is weakening as the bars continue to drop, indicating this buy cycle is fading. However, the rising lines show a continuing Buy Signal and have not turned down yet to trigger an MACD Sell Signal.
Next, is the most important signal for us because it determines when we delete CRM from the Model Portfolio. That uptrend indicates it is outperforming the Index. If it turns down, we automatically eliminate it from the Model Portfolio. Our Sell discipline creates high turnover in the portfolio.
Below this important signal, is the Full Stochastic and this triggers the early technical Buy Signal that gives us the heads-up to watch this stock. It triggers the early, blue line Buy Signal that is purely technical. It also creates a red line Sell Signal, indicating to us that price is going down to retest support.
We use both the Full Stochastic and the ADX signal at the bottom of the chart to identify Demand and Supply direction. The direction of Demand and Supply tells us where price is going, as do candlesticks, moving averages, money flow and the MACD. On our Model Portfolio report below, you will see a 20-day bar chart tracking Demand in green and black bars, with Supply shown in red bars.
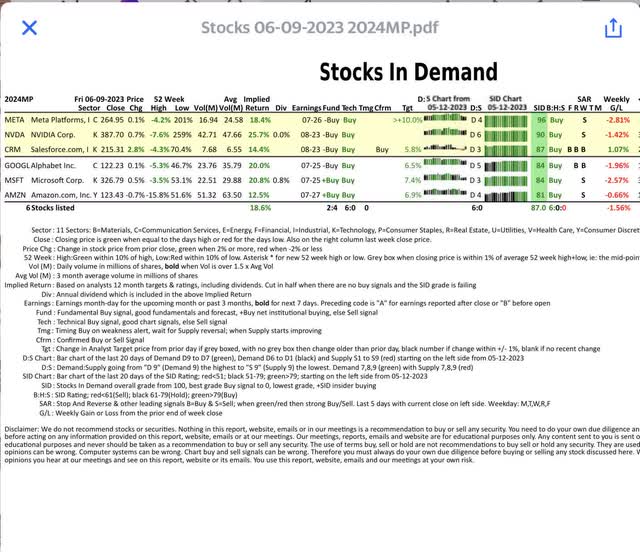
Here is our daily Model Portfolio report that we send out, and you can see CRM is on the report. You can also see all the signals we use to track CRM every day.
Salesforce in our Model Portfolio with all our signals. (Daily Index Beaters)
In the above report, we have highlighted our most important SID Buy Signal, in the SID column and color-coded green. Also notice we have a 20-day bar chart for the SID score, and we color code the bars green.
The 20-day bar chart for Demand and Supply shows green bars when Demand is high and buyers are chasing price. You can see the black bars of Demand dropping for CRM, then for one day a red bar, followed by black bars of increasing demand. This change from Supply to Demand triggered a Confirmed Buy Signal in the Cfrm column.
The footnotes explain the other columns, if you are interested in all the Fundamental and Technical signals we are using to track CRM every day for changes.
Analyst’s Disclosure: I/we have no stock, option or similar derivative position in any of the companies mentioned, but may initiate a beneficial Long position through a purchase of the stock, or the purchase of call options or similar derivatives in CRM over the next 72 hours. I wrote this article myself, and it expresses my own opinions. I am not receiving compensation for it (other than from Seeking Alpha). I have no business relationship with any company whose stock is mentioned in this article.
Disclaimer: We are not investment advisers and we never recommend stocks or securities. Nothing on this website, in our reports and emails or in our meetings is a recommendation to buy or sell any security. Options are especially risky and most options expire worthless. You need to do your own due diligence and consult with a professional financial advisor before acting on any information provided on this website or at our meetings. Our meetings and website are for educational purposes only. Any content sent to you is sent out as any newspaper or newsletter, is for educational purposes and never should be taken as a recommendation to buy or sell any security. The use of terms buy, sell or hold are not recommendations to buy sell or hold any security. They are used here strictly for educational purposes. Analysts price targets are educated guesses and can be wrong. Computer systems like ours, using analyst targets therefore can be wrong. Chart buy and sell signals can be wrong and are used by our system which can then be wrong. Therefore you must always do your own due diligence before buying or selling any stock discussed here. Past results may never be repeated again and are no indication of how well our SID score Buy signal will do in the future. We assume no liability for erroneous data or opinions you hear at our meetings and see on this website or its emails and reports. You use this website and our meetings at your own risk.
Seeking Alpha’s Disclosure: Past performance is no guarantee of future results. No recommendation or advice is being given as to whether any investment is suitable for a particular investor. Any views or opinions expressed above may not reflect those of Seeking Alpha as a whole. Seeking Alpha is not a licensed securities dealer, broker or US investment adviser or investment bank. Our analysts are third party authors that include both professional investors and individual investors who may not be licensed or certified by any institute or regulatory body.

Use our free, 30-day training program to become a successful trader or investor. See all the stocks that have our proprietary Buy Signal every day. Use our Model Portfolio or see the Buy Signal stocks by style of investing like Growth, Value, Dividends, Sector Rotation etc.
