
Summary:
- The expected growth rate for Adobe is in mid-teens and leads to richer valuations.
- According to annually recalculated regression models for multiples, Adobe seems overpriced on book values but undervalued on growth numbers.
- Technical analysis indicates a high chance for the return of the uptrend after some profit-taking and stabilization in the near weeks.
Galeanu Mihai/iStock via Getty Images
Thesis
This article analyzes the target multiples which Adobe Inc. (NASDAQ:ADBE) should have, if it were priced correctly in relation to the whole market’s data in order to evaluate whether the stock is relatively cheap or expensive. I will complement it with the technical analysis of the stock. My recommendation is a Buy based on momentum and stable growth of revenues and EPS.
Predicting Multiples from Regression Models
I base this analysis on the January 2023 regression models provided by Professor Aswath Damodaran on his site. The models are calculated each January for the key global markets, with the US market as a separate one.
According to this approach, a company is compared neither to sector peers nor other companies with similar risk, growth, and cash flow (which is Professor Aswath Damodaran’s definition of comparable firms) but to the whole market in which it operates. The approach uses the data for all the firms in the given markets and produces models with statistically significant variables – in this case, a selection of fundamental statistics which prove to have the strongest relationship with the multiple. The approach assumes that the relationship between the multiple and the variables is stable. As a result, a company that trades at a ratio lower (higher) than the one predicted from the market regression, is undervalued (overvalued) relative to how much it should cost according to the market’s aggregate data. In practical terms, whether an investor takes a top-down approach and follows a sector rotation, or a bottom-up approach and starts from the company level, the application of the regression serves both of these approaches by juxtaposing a company against the data of the other firms in the whole market to gauge whether the market prices the stock correctly. The weakness of the regression lies in the assumption that the relationship is linear, which may or may not be the case. I am choosing to use this approach with a conscience that most of the stock analyses rely on models that depend on subjective judgments and timing, as well as the availability of information, training, tools, and time to provide an accurate analysis.
From amongst six models that Professor Damodaran provides on his site, I will use those four ones with the highest R-squared, that is to say, for Price-Earnings to Growth (PEG), Price to Book Value (PBV), Enterprise Value to Invested Capital (EV/IC) and Enterprise Value to Sales (EV/Sales). Quoting Professor Damodaran’s textbook “Investment Valuation” (Wiley, 3rd Edition, p. 585)
“The R-squared indicates the percentage of the difference in the […] ratios that is explained by the independent variables. […] regression itself can be used to get predicted […] ratios for the companies in the list.”
Hence, the higher the R-squared, the more stable the model. PEG, PBV, EV/IC, and EV/Sales models have the R-squared ratio of 56.6%, 36.9%, 56.7%, and 30.6%, respectively. In the calculations, I will order them in the descending order of R-squared, to respect their explanatory powers.
Regressions of Multiples on Fundamentals: Market Wide – January 2023 (Aswath Damodaran’s site )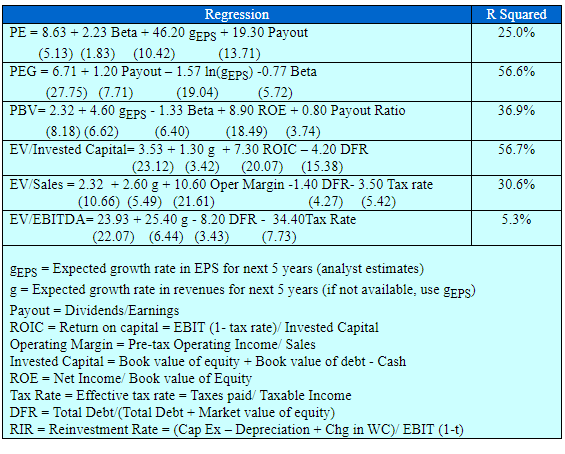
The inputs for Adobe for this analysis are:
|
Inputs |
Value for ADBE June 13, 2023 |
Source |
|
Payout ratio or “1- g/ROE” |
0.5785587714 |
calculated alternative due to the null payout |
|
gEPS – 5 years forward growth prediction by analysts/ to use also as a proxy for g of Sales on EV/IC |
0.1427 |
Finviz |
|
LN of gEPS for the PEG calculation |
-1.9470 |
own calculation |
|
B – beta of the company |
1.3 |
Morningstar |
|
ROE = NI/ BV Equity TTM |
0.3386 |
Morningstar |
|
ROIC – Return on invested capital = ROC = EBIT (1-t) / (BV of Debt + BV of Equity-Cash) TTM |
0.2626 |
Morningstar |
|
DFR = Debt to capital ratio = Total Debt/(Total Debt + Market value of equity) Q1 2023 |
0.0184504565 |
own calculation data from Morningstar (Market Cap $219.7127 B; Total Debt Q1 2023 $4.13 B) |
|
Tax rate = Effective tax rate = Taxes paid/ Taxable Income FY 2022 |
0.2250 |
|
|
Operating Margin = Pre-tax Operating Income/ Sales TTM |
0.3391 |
Morningstar |
Adobe does not pay dividends. According to the fundamental relation between implied growth, payout ratio, and ROE, the payout can be replaced with a formula “1 – (g/ROE)”. I decide to use this formula in order to keep the predicted multiple conservatively higher. If I were to use zero for payout, the predicted multiple would come out lower. I prefer to err on the side of caution and have a statistical prediction that rather warns me of a potential overvaluation than undervaluation.
Another modification I made is using an analyst’s consensus growth rate prediction of EPS for the next 5 years in place of the prediction of Sales growth due to the uncertain availability of information for the latter. This replacement is allowed in Damodaran’s model so I will use the EPS forward growth rate prediction numbers taken from the same source (Finviz) for consistency for all companies in the future articles.
For ROE, ROIC, and Operating Margin I am using the Trailing Twelve Months values from Morningstar, whereas the effective tax rate is sourced from Adobe’s press release for the Fiscal Year 2022. The second value I calculated independently is DFR (Professor Damodaran explained to me that it stands for “Debt to Capital” so I guess that the abbreviation “DFR” stands for “Debt to Funds Ratio”), where I used the reported Total Debt value of Q1 2023 against the market cap at the time of writing.
The predicted multiples for Adobe according to the regression models are as in the second column from the left. I sourced the publicly available sources of valuation statistics and compared the regression-predicted values to those current values in order to estimate whether the company is undervalued or overvalued in comparison to all the firms in aggregate in the whole US market.
|
Multiple |
Predicted multiples |
Currently (June 13) trading at |
Source of current multiple |
Undervalued or overvalued relative to the US market |
|
EV/IC |
5.554998083 |
n/a |
own calculation |
n/a |
|
PEG |
9.46007741 |
2.07 |
Undervalued |
|
|
PBV |
4.723807017 |
15.47 |
Morningstar |
Overvalued |
|
EV/Sales |
5.472149361 |
12.02 |
Yahoo |
Overvalued |
The results of the regression application suggest that at least in two of three cases (PBV and EV/Sales), where we have easily available comparable multiples at which the company is currently trading, we can consider Adobe as overvalued in comparison to how whole US market’s data suggests the company should be priced. Adobe has returned nearly 50% YTD, so obviously its PEG and PBV value have increased with the rise of the stock price. They were potentially much closer to the regression-based values of the multiples in the beginning of 2023. Only for PEG does Adobe seem to be cheaper than what comparison to the market pricing suggests, since its current PEG is only just above 2, while the regression suggests a value of 9.46. We need to be aware that the regression for PEG uses the natural log (ln) of the expected growth rate, to make the relationship more linear and intuitive. Hence, we cannot calculate the target P/E back from the formula “P/E divided by Growth”. If we were to take the predicted PEG of 9.46 and the consensus expected growth rate of 14.27% for the next 5 years, it would seem that Adobe should trade at a P/E ratio of nearly 135, vs. the current P/E of 47.19, which is nearly 3 times more (almost 200% upside). Moreover, my calculation is based on a quite low future outlook of the growth in comparison to the historical 5-year average for EPS growth of Adobe of nearly 25%. As I mentioned above, I have chosen to skip the prediction of P/E for the reason of a low R-squared. But for a curious reader, the regression-predicted P/E would be around 28.8, which would be the third multiple indicating the current overvaluation of Adobe.
I realize that the readers may find it of little use that there is no comparable value of the EV/IC ratio. However, according to the research of Prof. Damodaran, this ratio brings results similar to PBV. It can be also used in the future for comparing the valuations of other companies.
Technical analysis
This is my first article after a long while, so this time I will bring up a full explanation of my technical analysis approach but in the following articles I will skip it and make reference to the latest article with the full explanation.
I will analyze the Adobe stock chart from a perspective of a number of technical analysis tools and show the screenshots on the monthly and weekly Heikin Ashi candles charts – each timeframe presented through two separate sets of indicators – which I will complement with a simplified daily Renko chart to reflect the short-term price momentum
The first chart setup (I will call it Chart 1) uses Bill William’s Alligator indicator and Awesome Oscillator, as well as Ichimoku Clouds and On Balance Volume indicator line. For fundamentals, I show the quarterly revenue trend which I use for quick visual triage.
The Alligator technical analysis tool uses three smoothed moving averages that are based on thirteen, eight, and five periods, called also Jaw (blue line), Teeth (red line), and Lips (green line), respectively. Due to the smoothing of each moving average, the Jaw makes the slowest turns and the Lips make the fastest turns. The Lips crossing down through the other lines signals a short opportunity while crossing upward signals a buying opportunity.
William’s Awesome Oscillator (AO) is a market momentum tool that visualizes a histogram of two moving averages, calculated on median prices of a recent number of periods compared to the momentum of a larger number of previous periods. If the AO histogram is crossing above the zero line, that’s indicative of bullish momentum. Conversely, when it crosses below zero, it may indicate bearish momentum.
As for the Ichimoku Cloud – I am not using a full set of lines of Ichimoku lines, only the Leading Spans A and B, whose crosses dictates the color of the cloud and whose individual lines provide levels of the strongest support and resistance lines. Ichimoku averages are plotted into the future which in its own right provides a clearer picture but has no predictive powers.
On-Balance-Volume (OBV) indicator is a volume-based tool and is supposed to indicate the crowd sentiment about the price. OBV provides a running total of an asset’s trading volume and indicates whether this volume is flowing in or out, especially when viewed in divergence with the price action.
The second chart setting (Chart 2) uses 2 moving averages (10- and 50-period), volume, and volume’s 20-period average. On the screenshot from top to bottom, you will see the Composite Index Divergence Indicator (CIDI), which I learned from the book of Constance Brown, as well as J. Welles Wilder’s Directional Movement Indicator (DMI). I also use MACD (Moving Average Convergence Divergence) which is well known to everybody: I seek crossovers of MACD and signal, as well as above/below the zero level.
CIDI comes from a combination of RSI with the Momentum indicator. For more literature, see Brown’s paper or read her book. CIDI has been developed to solve the problem of RSI not being able to show divergence. I personally use the CIDI’s crossover above and below its slow and fast-moving averages, as well as the position of the averages against each other.
As for DMI, I skip the ADX line because it doesn’t give me anything. Instead, I focus on the crossovers of the Positive Direction Indicator DI+ and Negative Direction Indicator DI-. When the DI+ is above DI-, the current price momentum is upwards. When the DI- is above DI+, the current price momentum is downwards.
On the use of Heikin Ashi candles and Renko boxes, I use them as tools for trend reversal and continuation identification. Renko charts do not have a time scale and they are built on price movements that must be big enough to create a new box or brick. Similar to Heikin Ashi, Renko charts filter the noise.
The Long-Term Trend
For long-term trend analysis, I use monthly charts. As we can see in Chart 1, June started strong for Adobe. It is the seventh green Heiking Ashi monthly candle in the row and the current candle’s wick reaches above the Jaw (blue) line of the Alligator. It also has shot above the edge of the Heiking Ashi cloud. The cloud is still red but the red area is narrow and its edges are getting closer with the lower edge rising, which can indicate an upcoming change of color back to a long-term trend of green. The Alligator’s lines all turn up, with the Lip (green) line touching the Teeth (red) from below. Awesome Oscillator (AO) is still in the negative territory but it’s rising and going in sync with the On-Balance-Volume (OBV) line, which has been picking up since November 2022. It is a positive picture of hope for a long-term uptrend. The bottom panel indicates the revenue trend, which is a part of this chart view. The company has been showing steady growth in revenues.
Chart 1 – Monthly (TradingView)
In Chart 2, we see that the June candle has crossed above the 50-month Moving Average. The 10-month MA is flattening and may still take some 4-5 months to cross above the 50-month MA. The Composite Index Divergence Indicator (CIDI) crossed above both fast (green) and slow (orange) moving averages, and the fast average is coming close to the slow one from below. I could expect that the CIDI line (purple) will top in the nearest future but remain above the slow average. Moving Average Convergence Divergence (MACD) is now crossing its signal line, but both lines are below zero level. It is not impossible that they will go both above the zero level without switching sides, but I would wait until the crossover of MACD over the signal takes place together with the crossover of 10-month MA over the 50-month to count on a much stronger signal. Positive Direction Indicator (DI+) and Negative Direction Indicator (DI-) and it’s one more positive signal.
Chart 2 – Monthly (TradingView)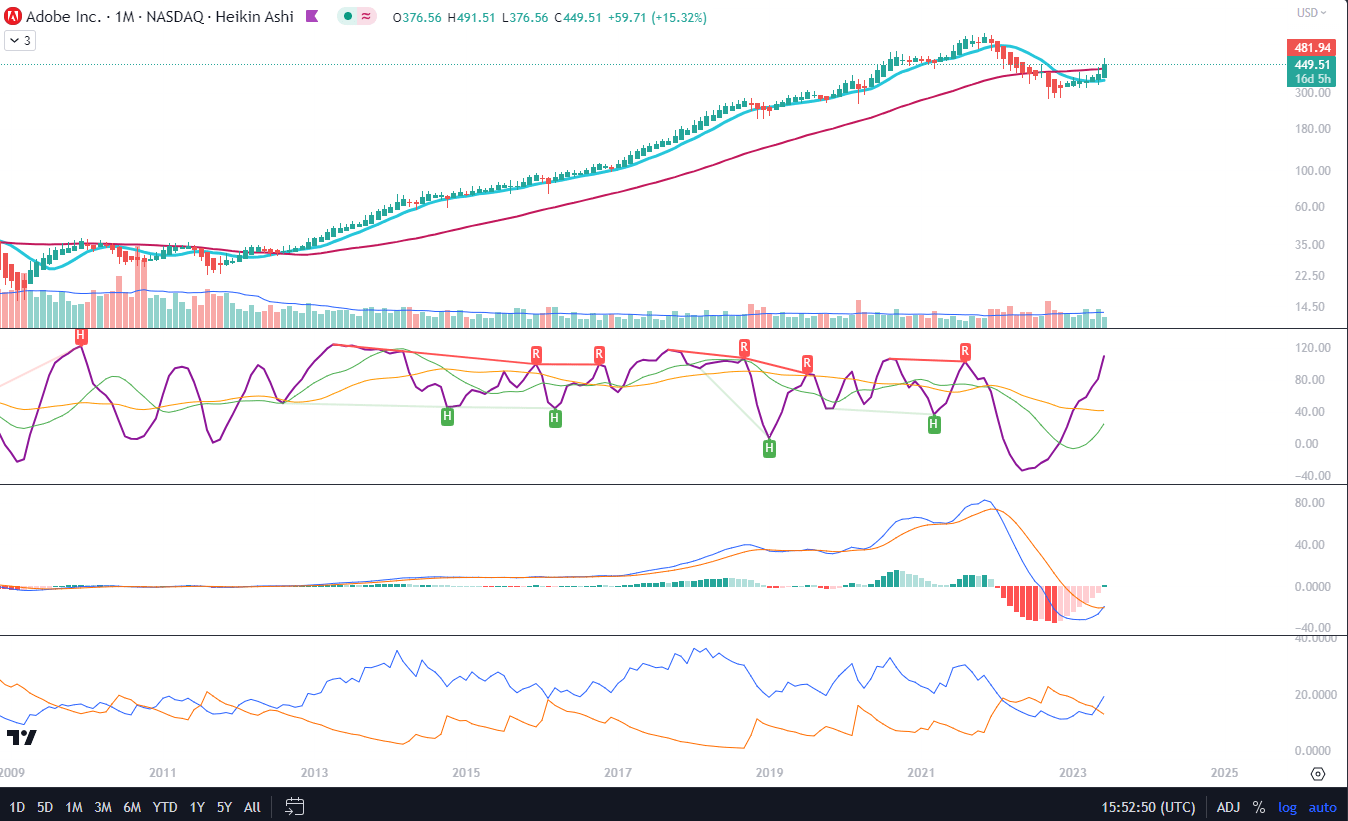
The Mid-Term Trend
For the mid-term trend analysis, I use weekly charts. As we can see in Chart 1, the technical signals are all positive: the Ichimoku cloud has turned to green, the Alligator’s lines have all crossed in a positive way and are facing up, AO crossed the zero level in January and the current bar is green, as well as OBV is trending upwards. What I added to this chart are two S/R lines which I find to be the closest to the YTD high, one on the level of $405, and another at $445. I believe that this will be the zone of any next retracement after the expected profit-taking from the current rally which started mid-May and brought over 47% return. Potentially the next lower S/R line could be at $387 which is the zone of the high of February 2020 before the big crash happened that year.
Chart 1 – Weekly (TradingView)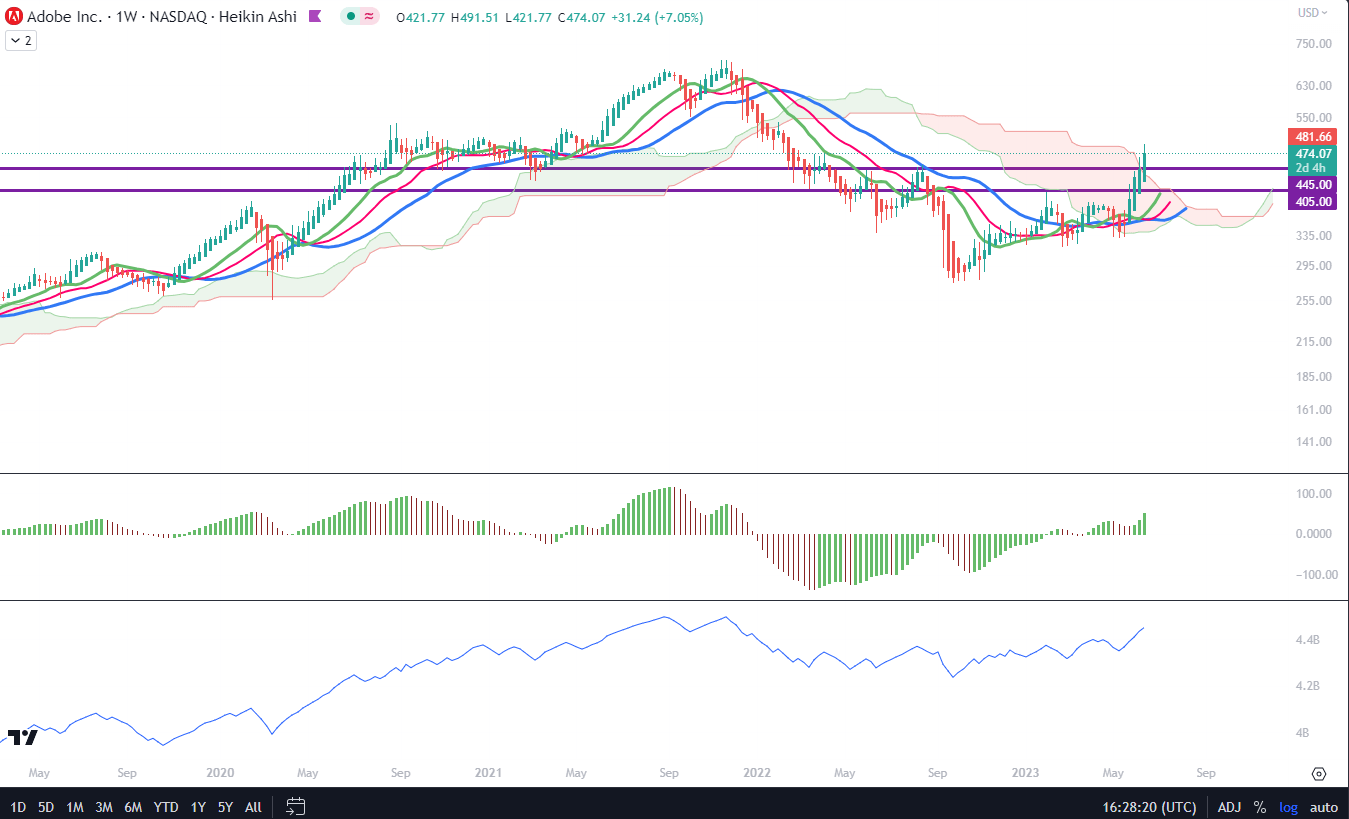
In Chart 2, we can appreciate that all technical signals are positive as well: 10-week MA has a rather sharp slope above the 50-week MA; CIDI is above its both averages, while the fast one is crossing above the slow one; MACD and its signal have both raised above the zero level; and last but not least, DI+ gaps wide above the DI-.
Chart 2 – Weekly (TradingView)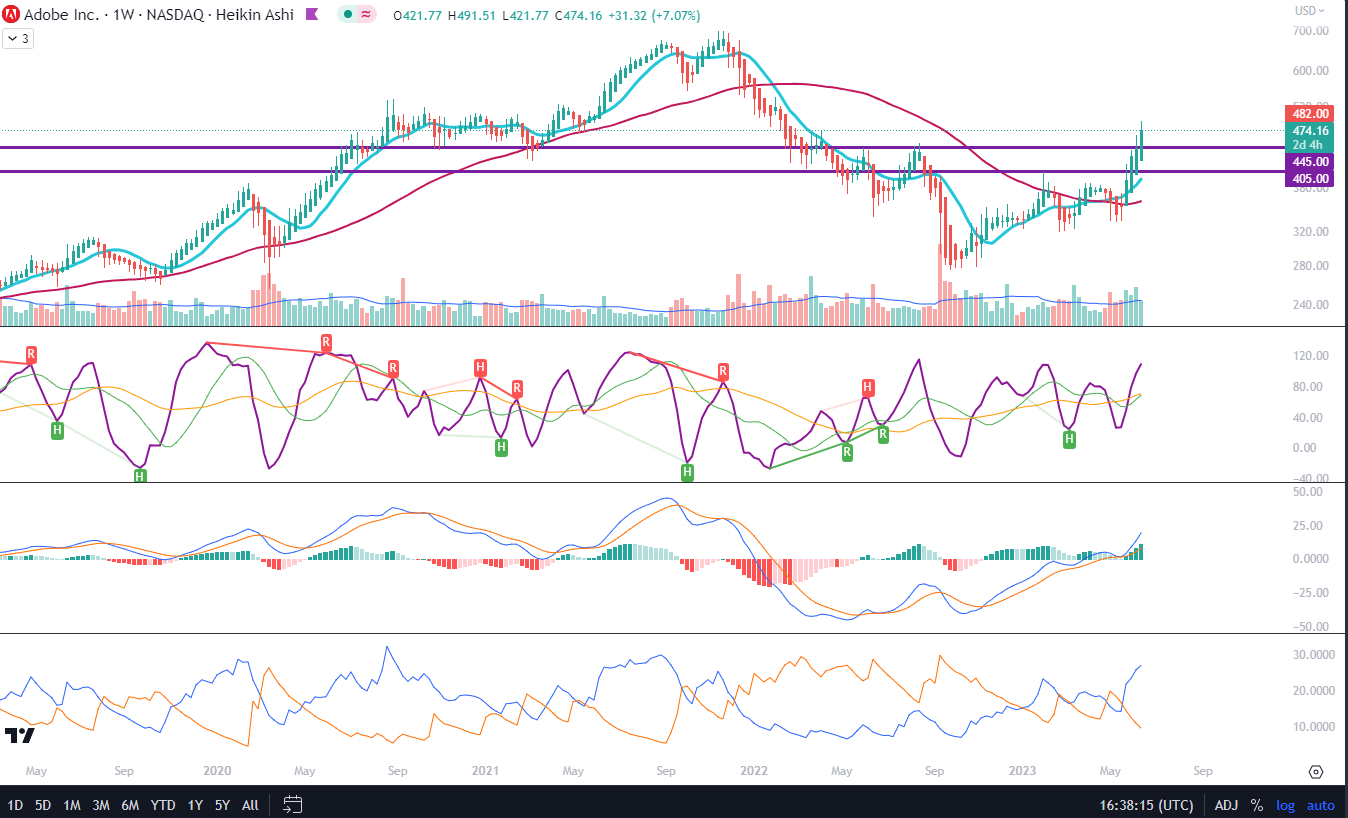
Price Momentum
The Renko chart is, according to me, a very convincing picture of the momentum underway. The 10-box MA crossed the 50-box MA around May 19th, when MACD had also taken a sharp take-off above its signal, and both those lines crossed above the zero level. I have moved the S/R lines to the levels of $430 and $460 to reflect the tops and bottoms of Renko accumulation and distribution zones. Another strong S/R could be around $440.
Renko chart – Daily (TradingView)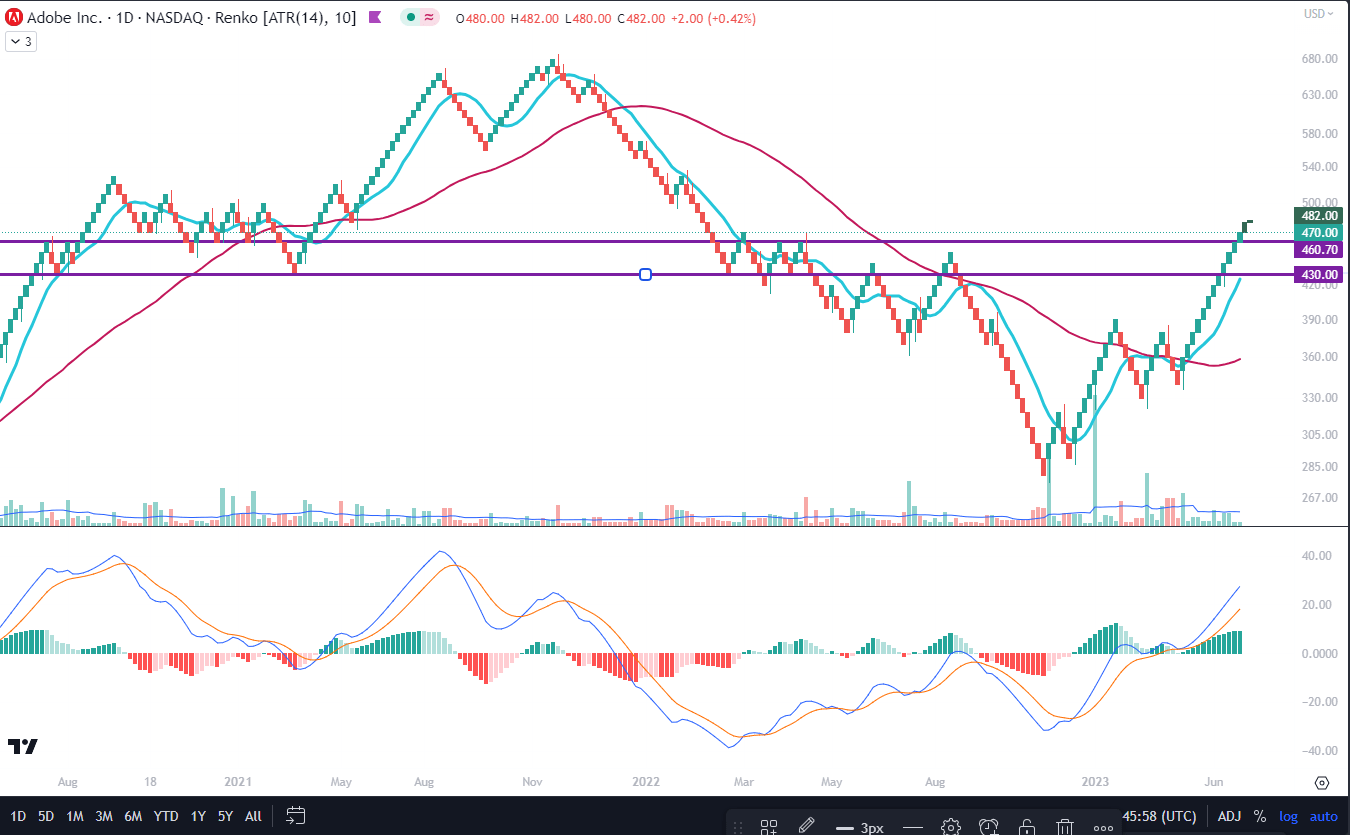
Conclusions
I realize that this article may provide the readers with seemingly contradictory messages which require personal judgment about factors that count the most when making investment decisions. On one hand, the fundamentals that affect the multiples suggest that the company is overvalued, however, one needs to recognize that the R-squared for the multiple PEG is the second (difference of 10 basis points) strongest which could indicate that Adobe is undervalued in the atmosphere of the current market. On the basis of the technical analysis, Adobe is on the cusp of recovery, although it may still take some time to sort out the major technical signals to all go in the same direction on both monthly and weekly timeframes. According to me, Adobe is a Buy that in the near future may go to Strong Buy. I would not be surprised if many investors added already now to the existing positions.
Analyst’s Disclosure: I/we have no stock, option or similar derivative position in any of the companies mentioned, and no plans to initiate any such positions within the next 72 hours. I wrote this article myself, and it expresses my own opinions. I am not receiving compensation for it (other than from Seeking Alpha). I have no business relationship with any company whose stock is mentioned in this article.
Seeking Alpha’s Disclosure: Past performance is no guarantee of future results. No recommendation or advice is being given as to whether any investment is suitable for a particular investor. Any views or opinions expressed above may not reflect those of Seeking Alpha as a whole. Seeking Alpha is not a licensed securities dealer, broker or US investment adviser or investment bank. Our analysts are third party authors that include both professional investors and individual investors who may not be licensed or certified by any institute or regulatory body.