
Summary:
- We evaluate if Adobe’s continued AI developments in Creative Cloud, Document Cloud, and Digital Experience segments have increased its competitiveness among its peers.
- We found that the company’s partnerships with major tech companies have enhanced its product offerings and examined specific partnerships in detail.
- Despite facing competition in the CRM market, we believe Adobe’s strong AI capabilities and product integration support a positive growth outlook for the company.
JHVEPhoto
In our previous analysis of Adobe Inc. (NASDAQ:ADBE), we focused on the generative AI developments in creative software which we expect could boost the market growth at a forecast CAGR of 16.7%, and we believed Adobe is positioned to capitalize on its strengths including a diverse product portfolio, massive scale & resources, market leadership and continued acquisitions.
We reevaluate the company to determine whether it could maintain its competitiveness in Application Software, specifically in creative, PDF and CRM software with new AI product developments spanning across its main segments including Creative Cloud, Document Cloud and Digital Experience segments, which account for 98% of its revenues. First, we assessed the company’s competitiveness by compiling recent AI developments and ranked the company against top competitors to derive a competitive factor score to project the company’s growth in creative, PDF and CRM software to estimate its excess market growth. Furthermore, we examined its profitability margins and determined how its new AI developments could affect its margins going forward, specifically focusing on SG&A and R&D which are its largest operating expenses by calculating average tech companies’ R&D and SG&A investment in AI to factor into our revised margins projections. Finally, we examined how its AI partnerships with major tech companies provide the company with advantages in its product offerings, distribution, and scale compiling the partnerships and determining whether it provides general benefits or specific benefits to Adobe and its top competitors.
AI Developments Across Segments
In this point, we examine how Adobe’s new AI developments affect the company’s overall competitiveness in the Application Software subindustry, which includes segments across Creative Cloud, Document Cloud and Digital Experience.
The company highlighted AI developments including AI Assistance, which has been employed across its Document Cloud and Digital Experience platforms, and Adobe Sensei, a machine learning framework aimed to be implemented across Adobe’s product suite in the Adobe Experience Cloud. Therefore, we examined each of the company’s segments for its AI developments.
Creative Cloud (59.3% of Revenue)
In our previous analysis, we focused on the Creative Cloud segment of Adobe in terms of AI developments and analyzed them in comparison with the top AI competitors including Midjourney, Dall-E 2, and DreamStudio regarding their respective popularity, user base, pricing, and AI models.
|
Metric ($ mln) |
2021 |
2022 |
2023 |
H1 2024 |
|
Creative Revenue |
9,550 |
10,460 |
11,517 |
6,200 |
|
Growth % |
9.5% |
10.1% |
10.5% |
Source: Company Data, Khaveen Investments
Creative Cloud revenue growth accelerated by 0.6% to 10.1% in 2023 following the introduction of “new Adobe Firefly models, Text-Based Editing in Premiere Pro, Generative Fill and Generative Expand in Photoshop, Generative Recolor in Illustrator and Text to Image and Text Effects in Adobe Express”. Furthermore, following its latest earnings release, H1 2024 Creative Cloud revenue growth further accelerated slightly by 0.4%. From the company’s latest earnings briefing, among the growth drivers highlighted for its performance was due to AI. For example, management cited that “higher ARPU Creative Cloud plans that include Firefly entitlements” benefited Creative Cloud growth. Additionally, Adobe’s CEO credited its “highly differentiated approach to AI and innovative product delivery are attracting an expanding universe of customers and providing more value to existing users”. Therefore, we believe the revenue growth acceleration could be an indication of its AI monetization starting to take effect.
Company Data, Khaveen Investments 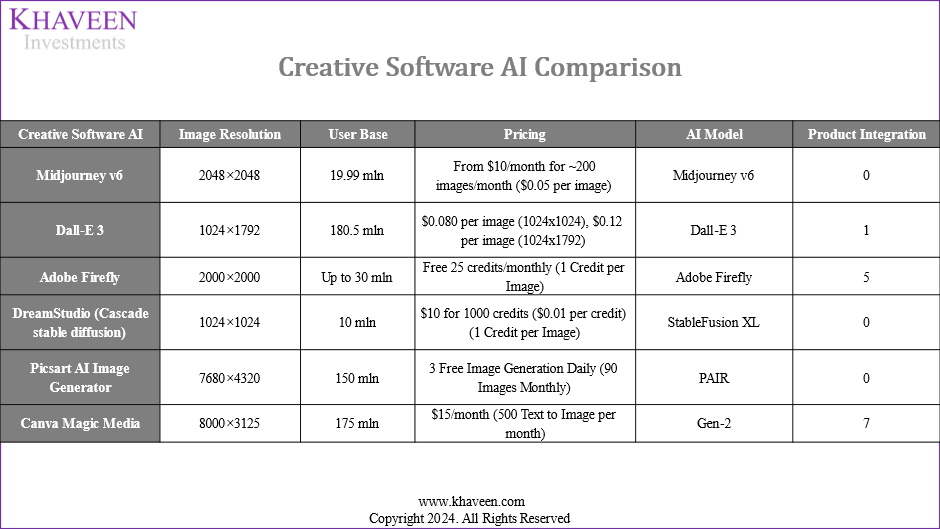
In our previous analysis, we identified competitors of Adobe’s Creative Software AI, including Midjouney v5, Dall-E 2, and DreamStudio (Stable Fusion), in this analysis, we further included software such as Picsart AI Image Generator and Canva Magic Media due to their relatively large revenue. Additionally, we included another criterion for evaluation by identifying the total number of products of the company that integrate with its creative software AI.
|
Ranking |
Image Resolution |
User Base |
Pricing |
Product Integration |
Average |
Factor Score |
|
Midjourney v6 |
3 |
5 |
4 |
4 |
4.0 |
0.9 |
|
Dall-E3 |
5 |
1 |
5 |
3 |
3.5 |
1.0 |
|
Adobe Firefly |
4 |
4 |
2 |
2 |
3.0 |
1.1 |
|
DreamStudio (Cascade stable diffusion) |
6 |
6 |
3 |
4 |
4.8 |
0.8 |
|
Picsart AI Image Generator |
1 |
3 |
1 |
4 |
2.3 |
1.3 |
|
Canva Magic Media |
2 |
2 |
6 |
1 |
2.8 |
1.2 |
Source: Company Data, Khaveen Investments
Furthermore, we updated our ranking of the companies listed above based on the four criteria. For image resolution, we updated our previous ranking and positioned Picsart AI Image Generator as the top due to its largest total pixel count, followed by Canva. This differs from our previous analysis where Midjourney was ranked as the top, we now ranked Midjourney lower primarily due to its lower performance to be inferior to Picsart’s offerings. For the user base, we upgraded the ranking for Dall-E after its recent integration with ChatGPT, making it available on the platform and accessing a larger user base. For pricing, we ranked Picsart AI Image Generator as the top due to its 3 daily free image generation, which sums up to 90 free image generation monthly. Whereas previously we identified Adobe being recognized with the lowest pricing plan. Additionally, we further evaluated the total number of products that each company is leveraging on top of their creative software, and we ranked Canva being the top for leveraging its Magic Media AI Image generator across all 7 of its products, followed by Adobe Firefly, that leveraged its image generator across 5 of its products.
Overall, in this analysis, we ranked Picsart as the top followed by Canva and Adobe. Compared to our previous analysis, we identified Adobe Firefly now to be less competitive compared to the new rivals that we have added, this is reflected through its lower ranking across criteria such as image resolution, size of user base, and pricing. This is as Picsart leads across image resolution and pricing, and Canva Magic Media is ranked as the highest for product integration due to its extensive integration across Canva’s product suite. Additionally, Midjourney, which was overall ranked second in our previous analysis, has been ranked fifth due to the addition of the two rivals, pushing its ranking down to third for image resolution. Besides, Midjourney’s ranking for the size of the user base also dropped from second to fifth, primarily due to the integration of Dall-E with ChatGPT and the addition of the two new competitors.
Document Cloud (13.9% of Revenue)
G2, Company Data, Khaveen Investments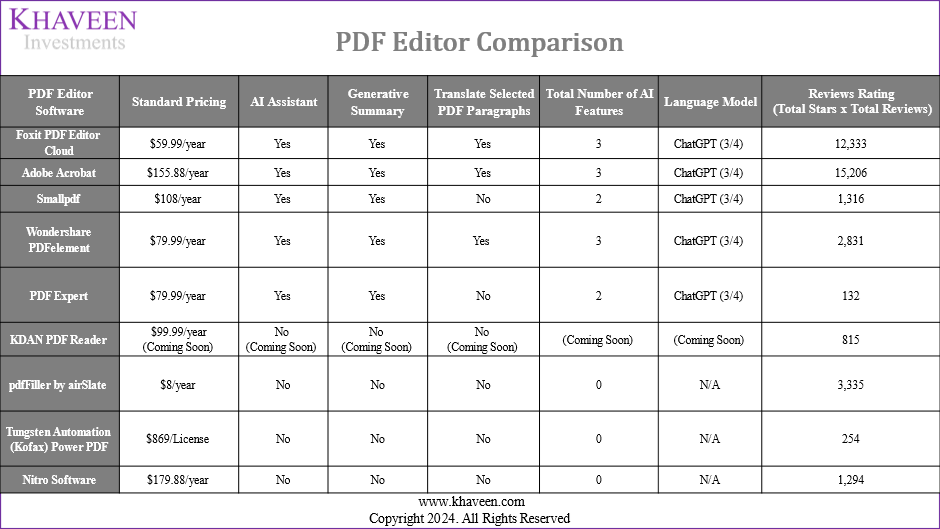
According to the above table, we have compiled 9 companies based on their respective revenue size. In the comparison table, we mainly evaluated the companies based on the criteria of pricing, the AI features within each PDF editor software (AI Assistant, Generative Summary, Translation), and the language model implemented. Additionally, we compiled a list of total reviews for the PDF editor software from G2, using this as an indicator of their popularity.
|
Ranking |
Pricing |
AI Feature |
LLM |
Reviews Rating (Total Stars/Total Reviews) |
Average |
Factor Score |
|
Foxit PDF Editor Cloud |
1 |
1 |
1 |
2 |
1.3 |
1.47 |
|
Adobe Acrobat |
5 |
1 |
1 |
1 |
2.0 |
1.38 |
|
Smallpdf |
4 |
4 |
1 |
5 |
3.5 |
1.19 |
|
Wondershare PDFelement |
2 |
1 |
1 |
4 |
2.0 |
1.38 |
|
PDF Expert |
2 |
4 |
1 |
9 |
4.0 |
1.13 |
|
KDAN PDF Reader |
7 |
6 |
6 |
7 |
6.5 |
0.81 |
|
pdfFiller by airSlate |
6 |
7 |
7 |
3 |
5.8 |
0.91 |
|
Tungsten Automation (Kofax) Power PDF |
9 |
7 |
7 |
8 |
7.8 |
0.66 |
|
Nitro Software |
8 |
7 |
7 |
6 |
7.0 |
0.75 |
Source: Company Data, Khaveen Investments
Furthermore, we ranked the nine companies in terms of their pricing plans, total AI features and capacities, the language models being leveraged, and the review ratings that we compiled from G2.
First, when evaluating the pricing of PDF editor software, we prioritized the software that possesses AI capabilities and subsequently ranked the remaining software that lacks AI features. Thus, we ranked Foxit PDF Editor Cloud as the top, with it being the AI software that offers the lowest price ($59.99 per year). Among the software options that offer AI capabilities, Adobe Acrobat stands out as the most expensive, being priced at $155.88 per year, followed by other AI-capable software like Smallpdf ($108 per year), Wondershare ($79.99 per year), PDF Expert ($79.99 per year), and Foxit ($59.99 per year).
In terms of AI capabilities, we have ranked the PDF editors that possess all three AI features at the top, which include Foxit PDF Editor Cloud, Adobe Acrobat, and Wondershare PDFelement. Other PDF software, such as Smallpdf and PDF Expert, does not possess AI capabilities for translating selected paragraphs, and we ranked last for software like pdfFiller, Tungsten Automation Power PDF, and Nitro Software as they do not possess any AI capabilities. However, we have ranked KDAN PDF Reader in the middle given that they have announced the upcoming implementation of AI capabilities across all 3 features discussed.
Additionally, in terms of AI models, we have ranked Foxit PDF Editor Cloud, Adobe Acrobat, Smallpdf, Wondershare PDFelement, and PDF Expert as the top due to their integration with ChatGPT (GPT3/4) which we covered in our previous analysis as the most powerful LLM, compared to the rest of the competitors which we could not identify any LLM integration.
Overall, we ranked Foxit PDF Editor Cloud as the top followed by Adobe Acrobat and WonderShare PDFelement. However, it is noticeable that although Adobe Acrobat possesses top ranking across all three criteria under AI features, LLM, and the Review Rating, its expensive pricing plan has positioned itself at a lower ranking, resulting in a lower factor score compared to Foxit.
Digital Experience (25.2% of Revenue)
Company Data, Khaveen Investments 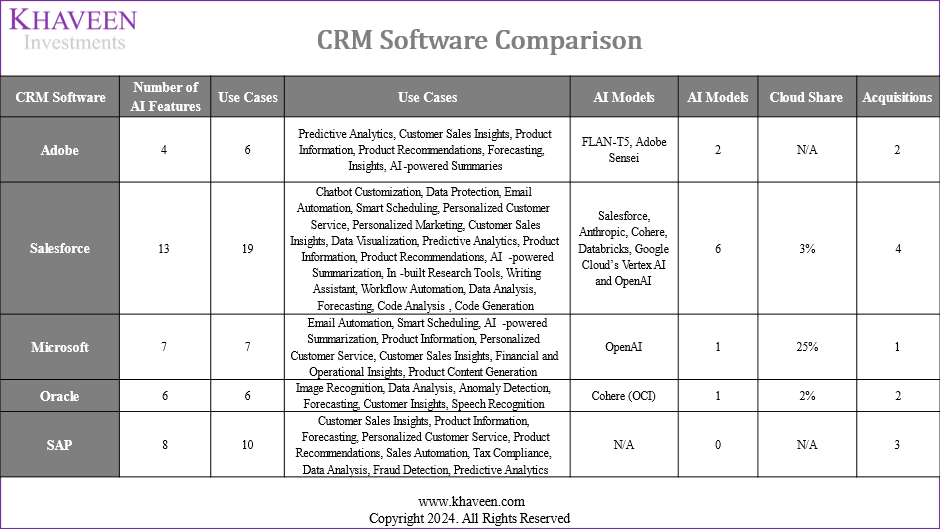
Based on our previous analysis of Salesforce (CRM) regarding the CRM market, we identified major competitors, including Adobe, Microsoft (MSFT), Oracle (ORCL), and SAP (SAP). Thus, in this analysis, we evaluate the competitiveness of Adobe’s products in the CRM industry. First, we updated our findings for the list of criteria including the number of AI implementations being leveraged, the number of AI applications/features, the total number of AI models being leveraged, and the cloud share and acquisitions.
|
Ranking |
Number of AI Features |
Use Cases |
AI Models |
Cloud Share |
Acquisitions |
Average |
Factor Score |
|
Adobe |
5 |
4 |
2 |
4 |
2 |
3.7 |
0.83 |
|
Salesforce |
1 |
1 |
1 |
2 |
1 |
1.2 |
1.45 |
|
Microsoft |
3 |
3 |
3 |
1 |
5 |
3.0 |
1.00 |
|
Oracle |
4 |
4 |
3 |
3 |
2 |
3.2 |
0.95 |
|
SAP |
2 |
2 |
5 |
4 |
4 |
3.4 |
0.90 |
Source: Company Data, Khaveen Investments
From the table above, Salesforce continues to lead with the extensive number of AI features and uses across its CRM product portfolio as well as its wide range of AI models implemented.
Compared to our previous analysis, we identified 2 more AI features (Low Code AI Builders, Dev and Admin AI) for Salesforce with an increase of 2 use cases (Code Analysis, Code Generation) accordingly. For Microsoft, we identified 3 additional AI features (Copilot in Dynamics 365 Business Central, Finance, Supply Chain Management) with an increase of 1 use case (Product Content Generation). In terms of Adobe, we identified another use case regarding the generation of summaries using its recent innovation of AI-Assistant. Furthermore, we also updated one additional AI-related acquisition for Adobe (Rephrase.ai), one for Microsoft (Inflection AI), as well as two more for SAP (WalkMe, LeanIX).
Overall, we ranked the top 5 companies according to their number of AI models, cloud share, and total number of AI-related acquisitions. We ranked Adobe as second regarding its AI models being implemented as well as its total acquisitions. Besides, we ranked Salesforce the first in AI features across the rest of the competitors due to its extensive AI applications and features across its CRM product portfolio.
Outlook
We believe the company’s AI developments could continue to support its revenue growth outlook, especially in creative where we determined the company’s strengths in terms of its pricing and product integration which trails behind new competitors in our analysis, Picsart and Canva. In PDF software, the company’s strengths include AI features, LLM and customer ratings. However, we believe Adobe faces tougher competition in the CRM software market with tough competition from market leaders Salesforce, Microsoft and Oracle which has an advantage over Adobe. Therefore, we believe Adobe’s revenue growth could outperform Creative Cloud and Document Cloud over the market while we projected its Digital Experience growth below the market growth.
We projected Adobe’s revenue growth across various segments by applying forecasted market CAGRs and factor scores derived from our comparison rankings. In the creative software market, we anticipate an 18.4% revenue increase for Creative Cloud due to Adobe’s expanding AI capabilities, supported by a factor score of 1.10x and our market CAGR of 16.7%. In Document Cloud, we projected it to grow by a CAGR of 17.1%, driven by AI advancements in the PDF software segment, based on a 12.4% market CAGR and a factor score of 1.38x. For the Digital Experience segment, we forecast Adobe’s revenue growth at 12.3%, using our previously derived CRM market CAGR of 10.7% and a factor score of 0.83x. For Publishing and Advertising, we based our forecasts on its past 5-year average of -18% as it “faces competition from large-scale publishing systems and Extensible Markup Language-based publishing companies” such as Microsoft and IBM according to its annual report. In total, we forecast a total forward average 3-year growth of 16.3% for the company.
|
Segment Projection |
2023 |
2024F |
2025F |
2026F |
|
Creative Cloud |
11,517 |
13,634 |
16,140 |
19,108 |
|
Growth % |
18.4% |
18.4% |
18.4% |
|
|
Creative Software Market Growth % |
16.7% |
16.7% |
16.7% |
|
|
Document Cloud |
2,699 |
3,159 |
3,698 |
4,328 |
|
Growth % |
17.1% |
17.1% |
17.1% |
|
|
PDF Software Market Growth % |
12.4% |
12.4% |
12.4% |
|
|
Digital Experience |
4,881 |
5,479 |
6,150 |
6,903 |
|
Growth % |
12.3% |
12.3% |
12.3% |
|
|
CRM Software Market Growth % |
10.7% |
10.7% |
10.7% |
|
|
Publishing and Advertising |
300 |
246 |
202 |
165 |
|
Growth % |
-18.0% |
-18.0% |
-18.0% |
|
|
Total |
19,397 |
22,518 |
26,190 |
30,505 |
|
Growth% |
16.1% |
16.3% |
16.5% |
Source: Company Data, Cognitive Market Research, Khaveen Investments
Profitability Margins
In the next section, we examined how Adobe’s AI developments could affect its major expenses including SG&A and R&D which represent its two most significant expenses accounting for 34.9% and 17.9% of revenue respectively.
Company Data, Khaveen Investments 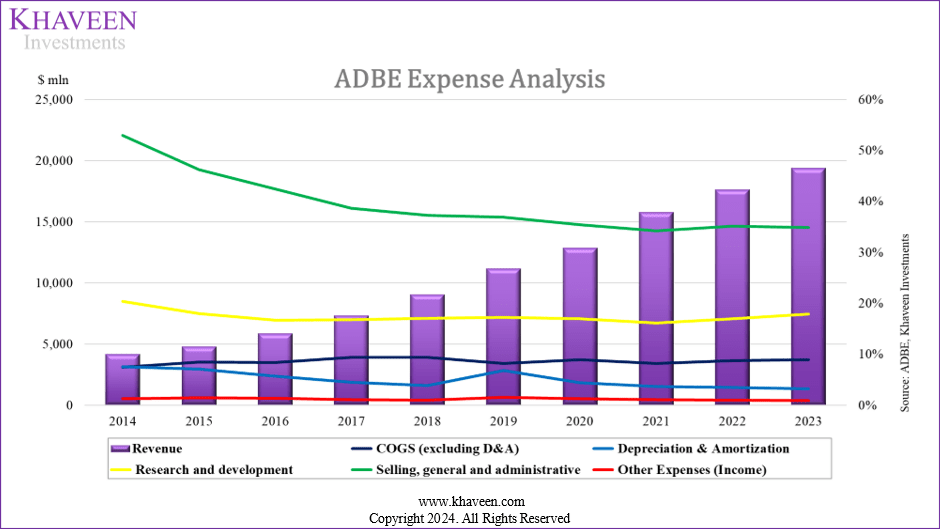
As seen in the expense analysis chart above, the company’s largest expense is SG&A, which has decreased as a % of revenue over the decade from 52.9% to 34.8%. The decreasing trend in SG&A has been more significant in the earlier years but has stabilized in the past 4 years. Moreover, R&D also saw a slight decrease over the period from 20.4% in 2014 to 17.9% in 2023. However, the past 2 years saw its R&D expenses as % of revenue rise the most over the period, rising by 0.9% in both years each. COGS, on the other hand, only accounted for 9% of revenue in 2023 and had been highly stable over the period. Depreciation only represents 3.2% of revenue and has been decreasing over the period with the company’s asset-light business model (capex averaged 3% of revenue).
Gross Margins
|
Adobe Gross Margins |
2014 |
2015 |
2016 |
2017 |
2018 |
2019 |
2020 |
2021 |
2022 |
2023 |
|
COGS (excluding D&A) % |
7.44% |
8.44% |
8.34% |
9.37% |
9.40% |
8.20% |
8.94% |
8.17% |
8.79% |
8.94% |
|
Depreciation & Amortization % |
7.56% |
7.08% |
5.66% |
4.46% |
3.83% |
6.78% |
4.44% |
3.65% |
3.51% |
3.18% |
|
Gross Margin % |
85.00% |
84.48% |
86.00% |
86.16% |
86.77% |
85.02% |
86.62% |
88.18% |
87.70% |
87.87% |
Source: Company Data, Khaveen Investments
The company’s gross margins remained stable in the past 10 years, with a slight increase that is attributable to the lower depreciation % of revenue over the period. Notwithstanding, COGS remained very stable. From our previous analysis of Salesforce, we highlighted the stability of high gross margins in software companies as we determined these types of companies generally do not benefit from economies of scale due to the unique business models of software companies differing from manufacturers whose margins benefit from increasing levels of production utilization by spreading out costs whereas software companies mainly incur upfront development costs. Other factors include volume discounts on cloud services which are passed on to customers as well as the easy replicability nature of software products. The company’s data center hosting costs are included under its Cost of Subscription which is categorized as one component of its cost of revenue. Despite the company’s AI developments, its COGS % of revenue continued to be in line with its 10-year average which suggests a limited impact on gross margins.
SG&A and R&D
|
Expense Analysis (% of revenue) |
2014 |
2015 |
2016 |
2017 |
2018 |
2019 |
2020 |
2021 |
2022 |
2023 |
|
SG&A |
52.94% |
46.22% |
42.47% |
38.65% |
37.28% |
36.93% |
35.43% |
34.25% |
35.14% |
34.85% |
|
R&D |
20.36% |
17.99% |
16.67% |
16.77% |
17.03% |
17.28% |
17.00% |
16.09% |
16.97% |
17.89% |
Source: Company Data, Khaveen Investments
In terms of SG&A, we previously analyzed its decreasing trend as a % of revenue indicating scalability which we believe was supported by factors such as its wide recognition by the industry and strong branding of its established network as a popular application. We projected its SG&A as a % of revenue to continue decreasing to 33.9% and 33.6% in 2022 and 2023, instead, it rose slightly over the period. However, Adobe’s branding continued to strengthen, based on Interbrand rankings seeing a rise in 2023, and has been awarded as among the “Top Rising Brands for the eighth year in a row”. Therefore, we believe its higher SG&A growth could be attributable to other factors. We calculated the R&D and SG&A comprising of S&M and G&A expense $ increase in the table below over the past 3 years from its annual report.
|
Category ($ mln) |
Detail |
2021 |
2022 |
2023 |
|
Research and Development |
Incentive compensation, cash and stock-based |
176 |
174 |
182 |
|
Base compensation and related benefits |
132 |
174 |
182 |
|
|
Hosting services and data center costs |
0 |
0 |
61 |
|
|
Professional and consulting fees |
44 |
50 |
0 |
|
|
Various individually insignificant items |
0 |
50 |
61 |
|
|
Total change |
352 |
447 |
486 |
|
|
Total R&D Compensation |
308 |
348 |
365 |
|
|
Sales and Marketing Expenses |
Base compensation and related benefits |
110 |
173 |
144 |
|
Incentive compensation, cash and stock-based |
183 |
129 |
144 |
|
|
Marketing spend related to campaigns, events, etc. |
365 |
216 |
0 |
|
|
Various individually insignificant items |
0 |
129 |
96 |
|
|
Transaction fees |
73 |
0 |
0 |
|
|
Total change |
730 |
647 |
383 |
|
|
General and Administrative Expenses |
Professional and consulting fees |
0 |
45 |
109 |
|
Base compensation and related benefits |
39 |
34 |
61 |
|
|
Incentive compensation, cash and stock-based |
88 |
45 |
36 |
|
|
Charitable contributions |
0 |
22 |
0 |
|
|
Bad debt expense |
-39 |
0 |
0 |
|
|
Charges related to the cancellation of corporate events |
0 |
-22 |
0 |
|
|
Software licenses |
20 |
0 |
0 |
|
|
Various individually insignificant items |
10 |
11 |
-12 |
|
|
Amortization of Intangibles |
0 |
0 |
0 |
|
|
Total change |
117 |
134 |
194 |
|
|
Total SG&A Compensation |
419 |
380 |
384 |
Source: Company Data, Khaveen Investments
Based on the table, in terms of R&D, the company’s annual report breakdown shows its R&D expense increase mainly contributed by employee-related expenses which have been rising over the period from $308 mln in 2021 to $365 mln in 2023.
Furthermore, in terms of SG&A, its total employee compensation over the past 3 years represented the largest dollar increase of its total SG&A increase. However, its total employee compensation is lower in 2023 at $384 mln compared to $419 mln. On the other hand, “Marketing spend related to campaigns, events, etc.” used to account for a large portion of the dollar increase in 2021 but had decreased through 2023 according to its annual report. In relation, the company’s advertising expenses decreased by 6.7% in 2023 to $970 mln and 20.2% in 2022 compared to the strong growth of 46.1% in 2021, indicating a cutback in advertising expenses. Furthermore, in G&A expenses, “Professional and consulting fees” increased in 2023 attributed to its failed acquisition of Figma which indicates a one-off expense according to its annual report.
Overall, the company’s employee compensation expense represented the majority of the company’s R&D and SG&A dollar increase. Furthermore, the R&D compensation had been rising each year through 2023, indicating the significance of employee compensation to the company.
|
Adobe Stock-Based Compensation ($ mln) |
2019 |
2020 |
2021 |
2022 |
2023 |
|
SG&A SB Compensation |
358 |
381 |
471 |
617 |
729 |
|
Growth % |
6.4% |
23.6% |
31.0% |
18.2% |
|
|
SG&A |
4,125 |
4,559 |
5,406 |
6,187 |
6,764 |
|
Growth % |
10.5% |
18.6% |
14.4% |
9.3% |
|
|
Stock-Based Compensation % of Total SG&A |
8.7% |
8.4% |
8.7% |
10.0% |
10.8% |
|
R&D SB Compensation |
375 |
467 |
549 |
726 |
874 |
|
Growth % |
24.5% |
17.6% |
32.2% |
20.4% |
|
|
R&D |
1,930 |
2,188 |
2,540 |
2,987 |
3,473 |
|
Growth % |
13.4% |
16.1% |
17.6% |
16.3% |
|
|
Stock-Based Compensation % of Total R&D |
19.4% |
21.3% |
21.6% |
24.3% |
25.2% |
Source: Company Data, Khaveen Investments
As seen by its stock-based compensation above the company’s SG&A stock-based compensation outpaced the growth of its total SG&A expenses in the past 3 years. Furthermore, the company’s stock-based compensation related to R&D also saw outpacing growth compared to its total R&D expenses and accounted for a significant 25.2% of its total R&D spending in 2023.
|
Top Application Software Number of Employees |
2019 |
2020 |
2021 |
2022 |
2023 |
Average (10-years) |
Average (5-years) |
|
Adobe Inc. |
22,634 |
22,516 |
25,988 |
29,239 |
29,945 |
||
|
Growth % |
6.0% |
-0.5% |
15.4% |
12.5% |
2.4% |
9.9% |
7.2% |
|
Salesforce, Inc. |
49,000 |
56,606 |
73,541 |
79,390 |
72,682 |
||
|
Growth % |
40.0% |
15.5% |
29.9% |
8.0% |
-8.4% |
19.2% |
17.0% |
|
SAP SE (SAP) |
100,330 |
102,430 |
107,415 |
111,961 |
107,602 |
||
|
Growth % |
4.0% |
2.1% |
4.9% |
4.2% |
-3.9% |
5.0% |
2.3% |
|
Intuit Inc. (INTU) |
9,400 |
10,600 |
13,500 |
17,300 |
18,200 |
||
|
Growth % |
5.6% |
12.8% |
27.4% |
28.1% |
5.2% |
9.0% |
15.8% |
|
Synopsys, Inc. (SNPS) |
13,896 |
15,036 |
16,361 |
19,000 |
20,300 |
||
|
Growth % |
4.9% |
8.2% |
8.8% |
16.1% |
6.8% |
9.1% |
9.0% |
|
Cadence Design Systems, Inc. (CDNS) |
8,100 |
8,800 |
9,300 |
10,200 |
11,200 |
||
|
Growth % |
8.0% |
8.6% |
5.7% |
9.7% |
9.8% |
7.0% |
8.4% |
|
Roper Technologies, Inc. (ROP) |
16,460 |
18,400 |
19,300 |
15,800 |
16,800 |
||
|
Growth % |
5.4% |
11.8% |
4.9% |
-18.1% |
6.3% |
6.0% |
2.1% |
|
Workday, Inc. (WDAY) |
12,200 |
12,500 |
15,200 |
17,744 |
18,800 |
||
|
Growth % |
16.2% |
2.5% |
21.6% |
16.7% |
6.0% |
22.5% |
12.6% |
Source: Company Data, Khaveen Investments
In the table above, we compare the employee headcount growth of the top 8 application software companies including Adobe. The company’s headcount growth slowed down to just 2% in 2023 which is lower compared to its historical averages. According to ResumeBuilder, “44% of companies using or planning on using AI believe it will result in layoffs in 2024”. As a tech company, we believe Adobe’s slower pace of hiring could be due to the industry nature and business model as AI adoption increases. Additionally, most of the top Application Software companies also had lower headcount growth which we believe further indicates it to be industry-specific. Therefore, we believe that as Adobe’s headcount growth slowed but employee compensation increased, this indicates higher compensation for existing and new employees. We believe this could be due to various factors. In terms of AI, “companies have to pay a premium to get good people on board for specialized AI projects” and “AI work requires specific specializations and skills” according to Techopedia.
According to a study by Access Partnership cited by AWS, companies are willing to pay 41% for R&D and 39% in sales and marketing more for AI-skilled employees. We projected the company’s SG&A and R&D based on compensation growth factoring in AI including 3 components which are employee growth (based on Adobe’s 5-year of 7.2%), wage growth (based on 10-year average wage growth in the U.S. of 3.56%) and premium of 41% and 39% in R&D and SG&A for AI skilled employees) factored by an assumption share of 20% of employees based on McKinsey’s study of enterprise employees needing to be reskilled for AI. In total, we forecasted its SG&A and R&D spending growth at around 15% and expect its SG&A and R&D revenue to be stable compared to our previous analysis where our estimates projected a decline.
|
Operating Expense Forecasts ($ mln) |
2024F |
2025F |
2026F |
|
SG&A |
8,092 |
9,680 |
11,581 |
|
Growth % |
19.6% |
19.6% |
19.6% |
|
SG&A % of Revenue |
35.9% |
36.9% |
37.9% |
|
R&D |
4,170 |
5,007 |
6,013 |
|
Growth % |
20.1% |
20.1% |
20.1% |
|
R&D % of Revenue |
18.5% |
19.1% |
19.7% |
* Growth = (1+ Adobe 5-year Average Headcount Growth) x (1+ AI Compensation Increase x Assumption Share of Employees Reskilled) x (1 + US 10-year Average Wage Growth)
Source: Company Data, Khaveen Investments
Free Cash Flow
Company Data, Khaveen Investments 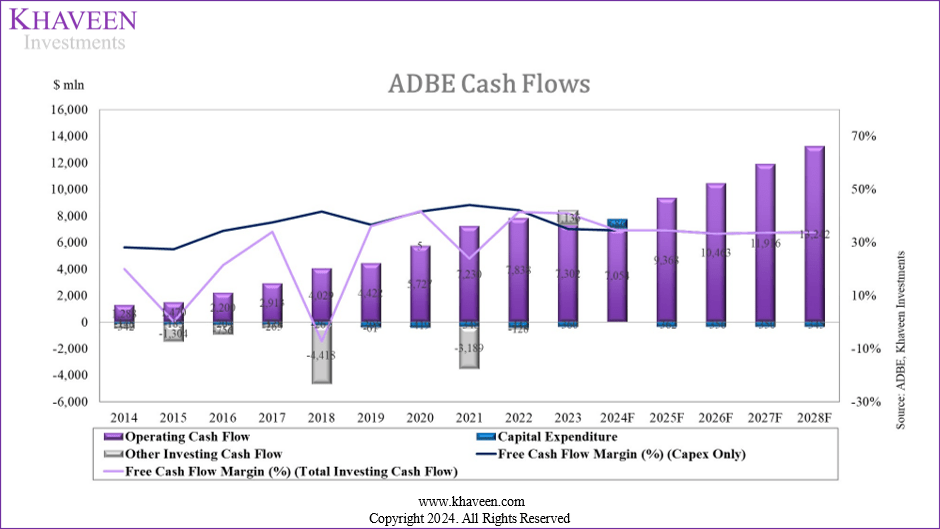
Additionally, in terms of cash flows, the company’s FCF margin had been robust though experienced a slight moderation in 2023 margin of 35.13% due to a slightly lower operating cash flow margin. However, its capex % of revenue remains low at only 1.9% of revenue, in line with its historical average despite its AI developments. This is because Adobe partners with cloud companies rather than depending on its own data centers. As mentioned above in the Gross Margins subsection, we highlighted its data center hosting costs are included as cost of revenue under the Cost of Subscription, rather than capex.
Outlook
Overall, after analyzing the major expenses that are impacted by its AI developments and determining the impact by projecting its R&D and SG&A expenses accounting for the expected rise associated with AI-skilled employees to factor into our revised margins projections, we updated our margin projections for the company at 3-year forward net margins and FCF margin of 25.21% and 34% respectively, compared to our previous analysis of 28.6% and 31% respectively, due to the estimated increase in expense associated with its AI developments for the lower net margin but we believe its highly capex lean business model bodes well for its FCF margins.
Partnerships Further Strengthen Creative and Document Cloud
Finally, we examined how Adobe’s AI partnerships with major tech companies provide the company with advantages in its product offerings, distribution and scale. We compiled a list of partnerships the company has announced related to AI below. We also categorized the partnerships into 3 types:
- Technology Integration partnership: A company and its partner develop and market a new integrated technology or integrate the company’s existing technology with its partners’ products for streamlined use. The benefits include technology capabilities sharing that may lead to more innovative solutions not possible by the company, leverage of the combined shared development resources with partners, improving customer satisfaction by streamlining technologies and interoperability enabling greater convenience and productivity, improving its competitive position in the market with differentiated products from competitors as well as promoting cross-adoption of innovations.
- Distribution partnership: A company collaborates with a partner who actively promotes, markets, distributes or implements the company’s products to the partner’s existing customer base. The benefits include increased sales and market penetration due to access to the partner’s customer base leveraging its distribution networks, leveraging the partner’s established relationships, expertise and reputation, enabling timely market entry despite lower market resources and cost requirements, enhancing the company’s brand credibility and trust among potential customers.
- Customer partnership: The partner company pays for and uses the company’s solutions for its own operations. The benefits include a stable revenue stream, endorsement of the company’s credibility and product quality which might attract other customers, a better understanding of customer needs, provide opportunities for upselling additional products or services leading to sustained revenue growth.
Khaveen Investments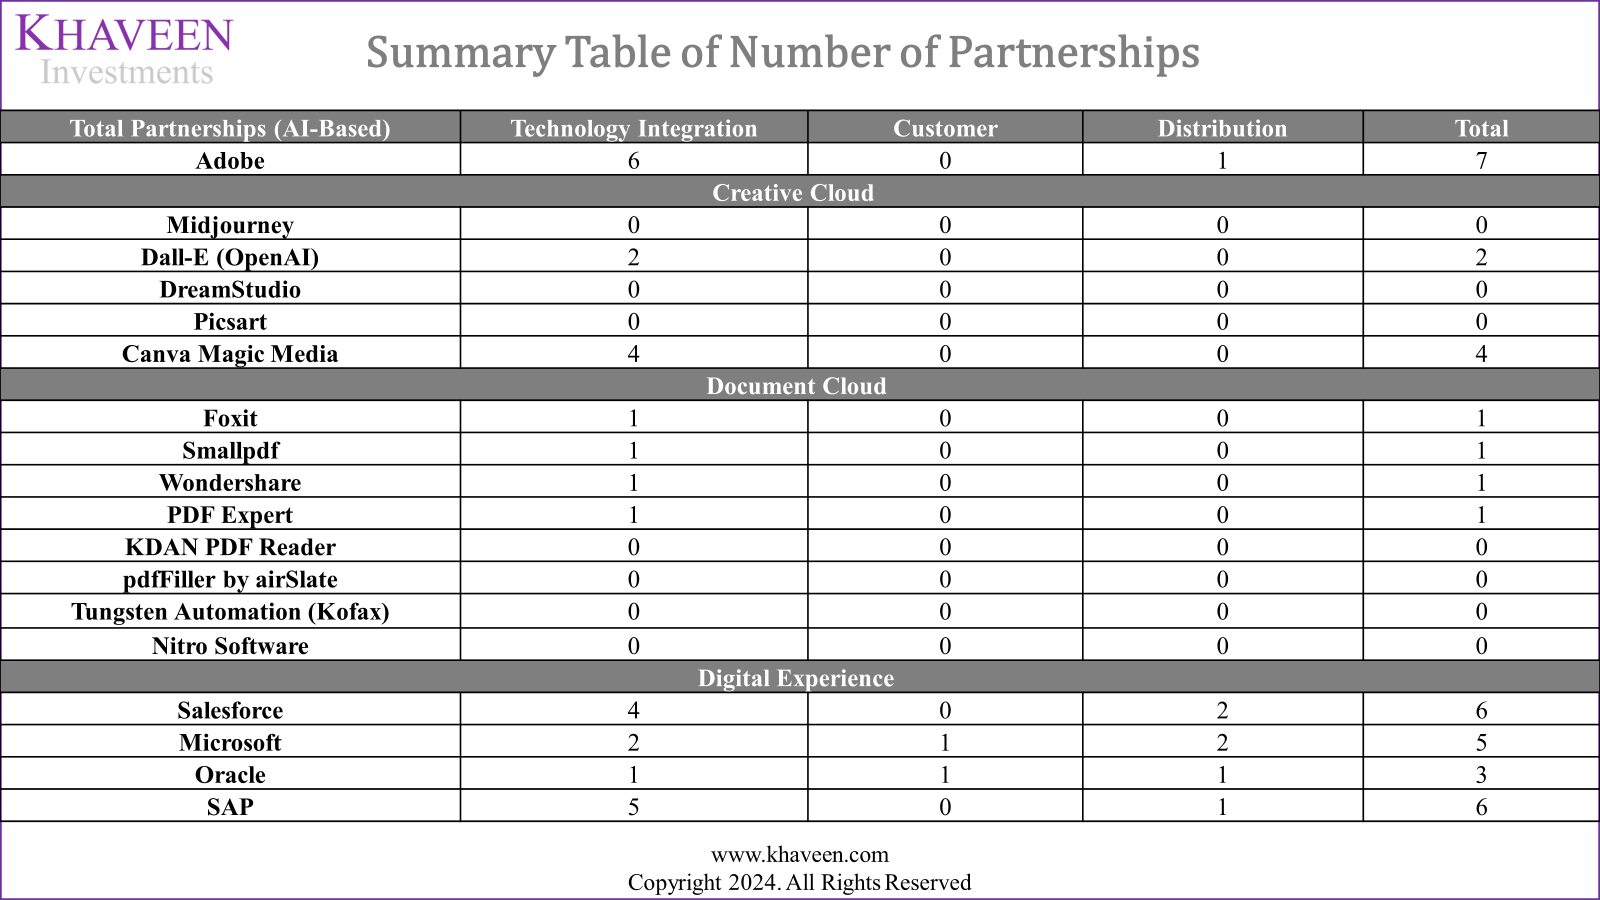
Based on the table summary above of the number of partnerships that we identified for Adobe compared with competitors in each of its segments including Creative Cloud, Document Cloud and Digital Experience, the number of partnerships identified for Adobe is generally higher compared to competitors in the Creative Cloud and Document Cloud segments while its number of partnerships are similar with competitors in the Digital Experience segment. In terms of the types of partnerships, the Digital Experience companies have more diverse partnerships across technology integration, customer and distribution partnerships, compared to creative cloud and document cloud competitors which we only identified technology integration partnerships and none for customer and distribution partnerships. We believe one of the factors for the more diverse partnerships among competitors in Digital Experience could be due to the sizes of the companies in the Digital Experience segment such as Microsoft, Salesforce, Oracle and SAP are much larger compared to companies in the Creative Cloud and Document Cloud segment which may reflect their brand reputation compared to smaller companies. Furthermore, we believe these large companies could be leveraging the networks of distribution partners through distribution partnerships to tap new avenues of growth to further grow their large existing customer bases. Additionally, we believe another factor for the higher customer partnerships in the Digital Experience segment, which relates to CRM software, could be due to the products having relatively more custom requirements tailored to the specific needs of their business customers due to the large product breadth offerings within CRM software. For example, Salesforce has a total of 16 various product categories which encompass different functionalities. According to Technology Evaluation Centers, “Salesforce and the average market solution support 246 features”.
Company Data, Khaveen Investments 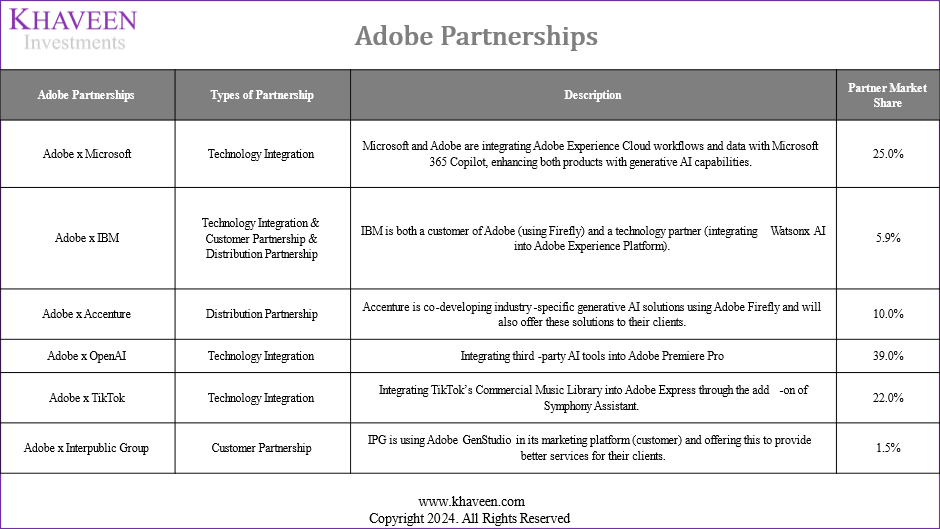
Based on the table of our compiled Adobe partnerships, we identified 6 partnerships that are related to AI. All of these partnerships include technology integration partnerships. Firstly, Adobe has a partnership with Microsoft to integrate Adobe Experience Cloud applications with Microsoft 365 Copilot to enable the streamline of workflow for marketers, this benefits Adobe due to the streamlined technologies of the two companies, providing convenience to Adobe customers who use Microsoft’s productivity and ERP software products which they are the leaders in with a market share of 30% and 11% respectively. Moreover, we note that Microsoft and Adobe already have other various technology integrations at a total of 59, highlighting the strong technology integration between the two companies. Besides, Adobe partnered with IBM (IBM) to integrate Adobe Experience Platform for its Acrobat AI Assistant with its hybrid cloud solutions such as Watsonx AI and data platform, allowing IBM’s hybrid cloud customers to access Adobe’s AI which we believe benefits Adobe by promoting cross-adoption of each companies technologies by integrating its CRM and IBM’s hybrid cloud.
Furthermore, Adobe also stated that it is exploring the integration of its video editing software, such as Premiere Pro, with third-party tools, including OpenAI. Therefore, we believe this could benefit Adobe by supporting the cross-adoption of OpenAI users with Adobe’s video editing software “to generate and use video within Premiere Pro”.
Besides, Adobe also has a partnership with TikTok to integrate TikTok’s Commercial Music Library into Adobe Express with its AI-powered “Symphony Assistant add-on” which benefits Adobe by enabling and promoting the adoption of Adobe Express among TikTok video creators while providing convenience to video creators to streamline the process and directly use Adobe software.
In terms of customer partnerships, Adobe’s partnership with IBM includes the company utilizing Adobe Firefly to increase efficiency by optimizing its “end-to-end process flow” in its “marketing and consulting teams” generating creative content which IBM highlighted, thus we believe benefits Adobe as an endorsement of Adobe Firefly’s capabilities. Not only that, IBM’s consulting business “also collaborates with clients to implement the content supply chain using Adobe Workfront and Firefly” benefiting Adobe by allowing it to leverage IBM’s established consulting client base to market and implement its AI products such as Firefly and Express.
Besides, Adobe’s customer partnership with IPG (IPG) ($10.89 bln revenue), has allowed the integration of Adobe GenStudio into the company’s marketing technology platform “IPG Engine” to streamline the customer experience. The integration helps improve the content supply chain within the IPG Engine, by enhancing functionalities across various products including Adobe Express, Adobe Firefly, Adobe Workfront, and Adobe Experience Manager. We believe that this partnership could serve as an endorsement of Adobe’s extensive capabilities within its Creative Cloud and Experience software suites.
Furthermore, in terms of distribution partnerships, Adobe has a partnership with IT consulting firm Accenture (ACN) to implement and deploy products such as Adobe Experience Manager (AEM), which has AI features such as Adobe GenAI, to its consulting clients such as Accor which benefits Adobe by allowing it to leverage Accenture’s customer base to deploy their products.
We then compared the company’s partnerships with its competitors in each of its 3 main segments below with the top 3 companies in the Software & Services, IT Services, IT Consulting and Interactive Media & Entertainment industries as well as the top 3 AI model companies.
Company Data, Khaveen Investments 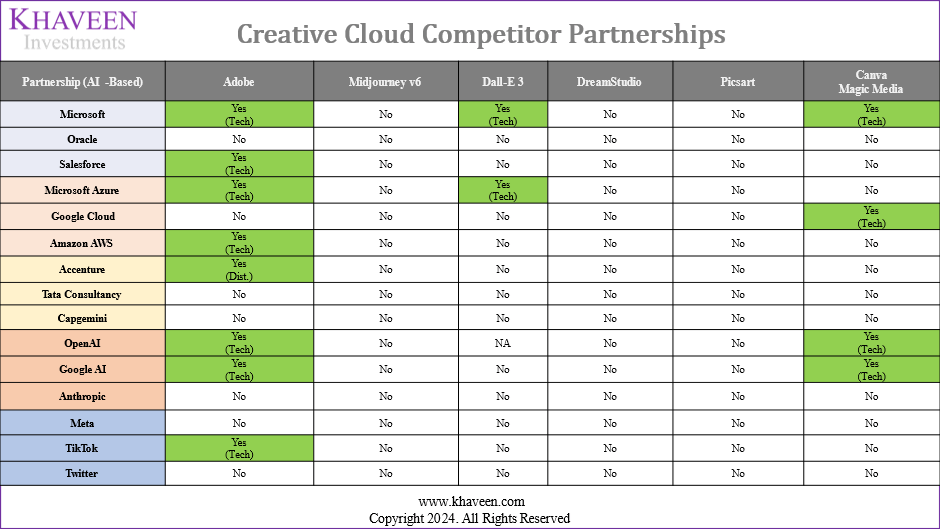
For the Creative Cloud segment, we see that Adobe has a higher number of partnerships compared to the rest of the smaller competitors with Dall E-3 and Canva the only companies we identified with 2 and 4 tech integration partnerships each.
Company Data, Khaveen Investments 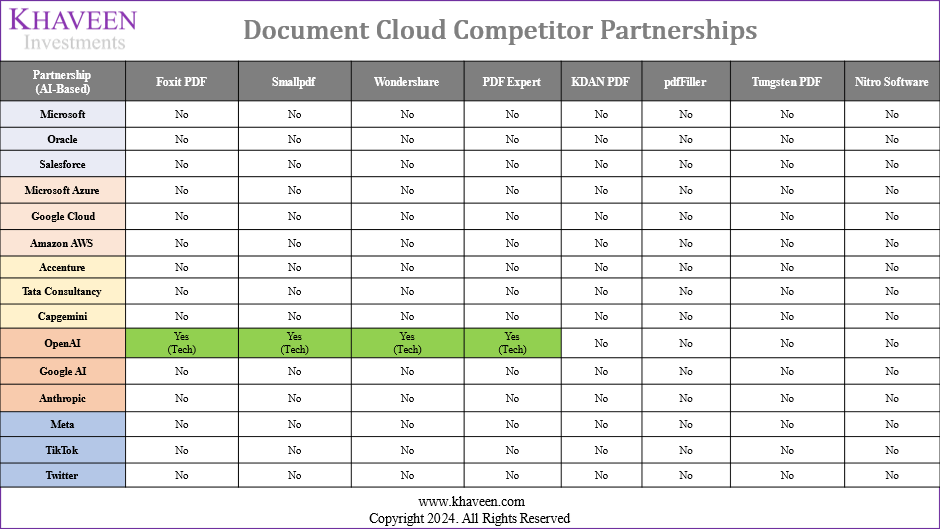
For the Document Cloud segment, we see that Adobe has a higher number of partnerships compared to the majority of its competitors. We did not identify a single partnership except for Foxit, SmallPDF, Wondershare and PDF Expert which only has tech partnerships with OpenAI for ChatGPT integration.
Company Data, Khaveen Investments 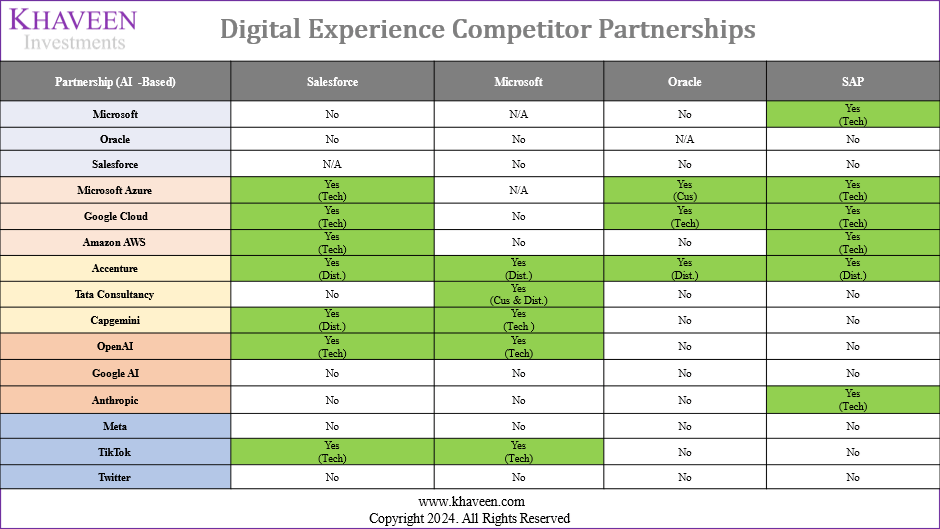
However, in the Digital Experience segment, several companies have partnerships including tech, distribution and customer partnerships.
Outlook
Overall, we believe Adobe’s partnerships indicate an advantage for Adobe over its competition within the Creative Cloud and Document Cloud segments. Adobe holds the highest total number of AI-related partnerships compared to competitors in both segments, further supporting our expectation in our first point where we derive a higher competitive factor score for Adobe to outperform the Creative Cloud and Document Cloud market. However, in terms of the competitive landscape within Adobe’s Experience segment, we believe the comparison of partnerships does not indicate a strong advantage for Adobe compared to large competitors in CRM (Digital Experience), since Adobe’s total AI partnerships do not stand out much compared to rivals such as Salesforce (7), SAP (6) and Microsoft (5). Besides that, we further observed that most of the AI-related partnerships are not exclusive to Adobe, which could see its competitors in the future entering into partnerships with similar Adobe partners thus we believe the small gap in the total partnerships in Digital Experience would not provide Adobe a significant competitive advantage, which is also in line with our expectations in the first point where we see the company underperforming the CRM market with a lower competitive factor score.
Risk: FTC Lawsuit
The U.S. Department of Justice and the Federal Trade Commission (FTC) have taken legal action against Adobe over its business practices for subscription licenses, alleging the company implemented concealed early termination fees on its online subscribers. Furthermore, the case outlined that the company’s subscription cancellation process was complicated, which could discourage customers from canceling their subscriptions. Adobe defended itself that it is being “transparent with the terms and conditions” of its subscription contracts and “have a simple cancellation process”. If the court rules against Adobe, the company could face financial penalties and may be required to amend its practices which could lead to lower customer retention if the allegations are material. However, we believe Adobe’s branding and customer partnerships remain a key strength of the company.
Valuation
adobe valuation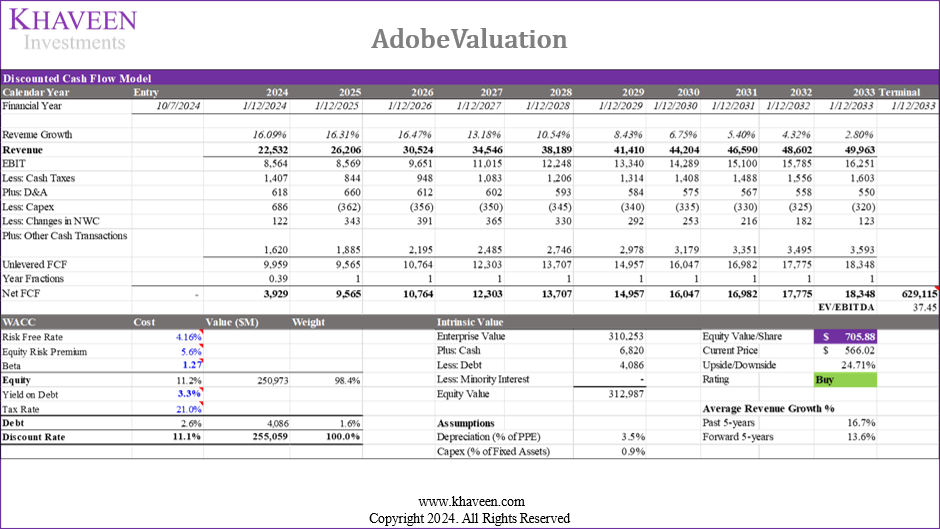
We updated our revenue projections for the company with a weighted 5-year forward average of 13.6%, reflecting our expectations for the company’s robust growth supported by its competitiveness in creative and PDF software with enhancements from its AI features. Based on a discount rate of 11.1% (company’s WACC) and terminal value based on the company’s 5-year average EV/EBITDA of 37.45x, we derived an upside of 24.71%.
Verdict
All in all, we believe Adobe’s AI developments could support a promising growth outlook for the company, especially within the Creative Cloud and Document Cloud segments, where we projected the company’s forward average growth of 18.4% and 17.1% respectively, outperforming the creative software and PDF market growth due to strong AI capabilities and product integration. However, we also highlighted increasing competition within creative software from smaller players such as Picsart and Canva but still believe Adobe maintains its strengths against other competitors. Whereas in PDF software, we expect its strengths in terms of AI features, LLM and customer ratings support to provide it a competitive advantage against competitors. Additionally, within the Digital Experience segment, we highlighted its AI developments but overall expect it to face tough competition in the CRM software market against larger players. We forecasted a total forward average revenue growth of 13.6%. In terms of profitability, we see its net margins and FCF margins remaining positive and strong at 25.21% and 34% respectively, despite an expected rise in expenses for its AI developments associated with R&D and SG&A. Moreover, we believe the company’s partnerships with key companies could further support our expectations for the company to perform strongly in the Creative Cloud and Document Cloud segments. Based on our revised DCF, we continue to rate the company as a Buy with a price target of $705.88, moderately higher (10%) compared to our previous analysis of $646.10 with a fairly in-line 5-year forward average growth (14.9%) and a lower discount rate previously (12.1%).
Analyst’s Disclosure: I/we have a beneficial long position in the shares of ADBE either through stock ownership, options, or other derivatives. I wrote this article myself, and it expresses my own opinions. I am not receiving compensation for it (other than from Seeking Alpha). I have no business relationship with any company whose stock is mentioned in this article.
No information in this publication is intended as investment, tax, accounting, or legal advice, or as an offer/solicitation to sell or buy. Material provided in this publication is for educational purposes only, and was prepared from sources and data believed to be reliable, but we do not guarantee its accuracy or completeness.
Seeking Alpha’s Disclosure: Past performance is no guarantee of future results. No recommendation or advice is being given as to whether any investment is suitable for a particular investor. Any views or opinions expressed above may not reflect those of Seeking Alpha as a whole. Seeking Alpha is not a licensed securities dealer, broker or US investment adviser or investment bank. Our analysts are third party authors that include both professional investors and individual investors who may not be licensed or certified by any institute or regulatory body.