Summary:
- Earnings act as catalysts, accelerating market movements projected by chart structures, crucial for both short-term traders and long-term investors in stocks like ADBE.
- Market sentiment, driven by human behavior in charts such as ADBE, leads stock prices, with fundamentals playing an underlying role, particularly at major turns.
- Our methodology points to a low-risk, high-reward bearish setup for ADBE, contingent on price staying below resistance.
- Successful trading requires a robust system to manage risk and capitalize on probable market paths, emphasizing capital preservation.
Moon Safari
By Levi at Elliott Wave Trader; Produced with Avi Gilburt
It has been said that earnings, and specifically profits, are the mother’s milk of the markets. Earnings can also provide a catalyst that will at times speed up what the charts were projecting before the announcement is released to the masses. This is one of the main reasons that we have a special feature in StockWaves that will cover most major tickers that are reporting and then provide updates once they do.
This can be a valuable feature to both short-term traders and longer-term investors, depending on how they wish to use the information given. We’re going to take a look back at the recent setup for Adobe (NASDAQ:ADBE). The structure of price on the chart was quite standout, showing a bearish slant with clear parameters for the risk versus reward. Then, we’ll see what the larger picture reveals going forward.
So, What Moves Stock Prices?
Is it earnings, or is it something else? The answer you hear to this query will be quite varied. And, it will likely depend on the point of view of the one giving the response. Catalysts. That is one main way that we view earnings season. It happens at most 4 times a year and will provide multiple opportunities across the markets for outsized moves in some stocks. We search for the higher probability setups and emphasize those for our members, and readers when possible.
Keep in mind that markets are not omniscient nor all-seeing. They are much more primal than that. Markets don’t really ‘know’ anything. They ‘feel’. It is sentiment, i.e. human behavior, that leads stock prices. Yes, fundamentals are important. But it is feelings that lead, especially at the major turns. Catalysts just tend to speed up what was going to take place.
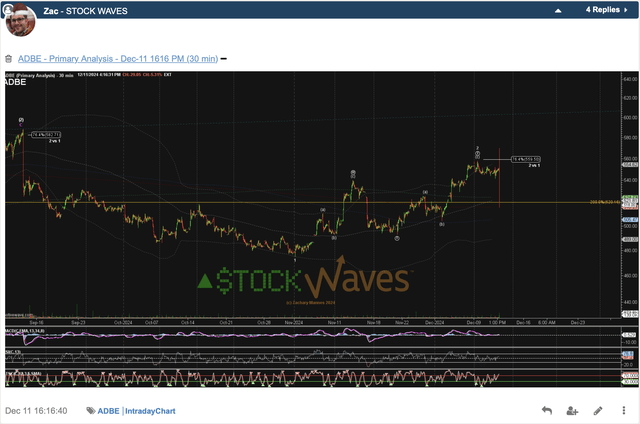
Here’s what we saw in ADBE pre-earnings and what ended up taking place. Inside of StockWaves there is a feature denominated “Earnings Calls”. Each major stock that is reporting will be updated a day or two before the news release. Yes, this makes for quite a workload, but our team can handle it. Here is the pre-earnings update on ADBE posted the morning before the release:
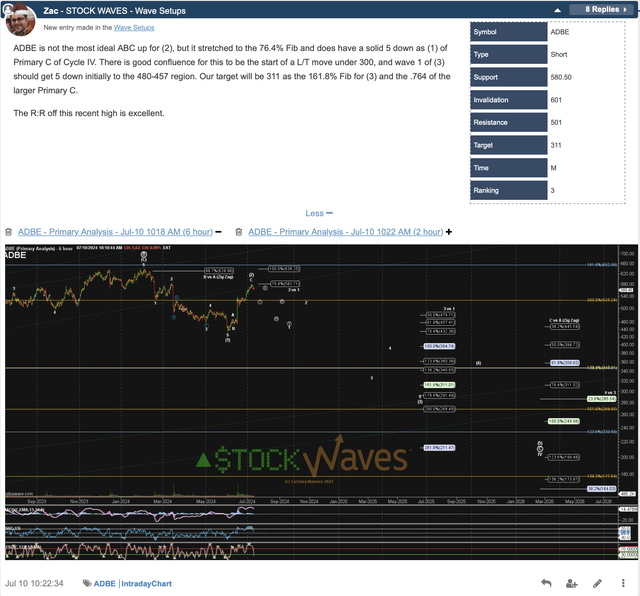
Note that this was a further update to an ongoing Wave Setup that we had been tracking since the summer. The original setup was from July:
As the setups manifest themselves, we will update them as necessary given the structure of price filling out each chart. ADBE was tracking as anticipated into the earnings release, and we had a pivotal moment in place just before the bell. If you were following this one, then you know what happened post-release.
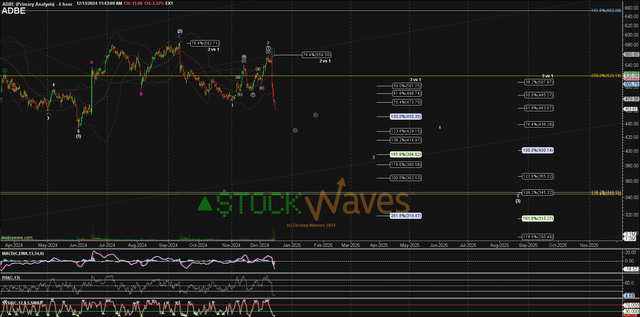
You can see the spike and strong downside reversal. Then, as the days continued, price kept on filling out the primary projected path illustrated on the charts shared pre-earnings release.
What Is Likely Next For ADBE?
Let’s look at the latest updates from Zac Mannes.
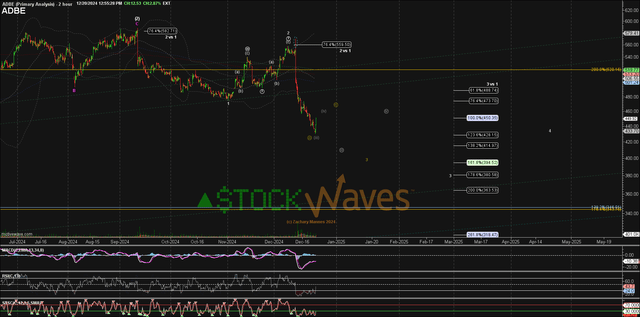
From the bigger picture on the first chart, it would appear that 2025 will be a lackluster year for the bulls. And if we zoom into the 2-hour chart just below that one, note that there is some question as to how the smaller subwaves will actually form inside this pullback. But the bigger picture remains the same.
Where might the chart turn more immediately bullish? This is where the Wave Setups table will help provide the parameters for said setup. To sum up, for as long as price is below $558 then the chart is bearish for the upcoming year. As always, we will update the setup should the parameters be exceeded or the setup invalidate.
Don’t Be Turned Off By Misapplication Of This Methodology
Obtaining a true understanding of this methodology takes time and effort. For those willing to invest in said effort, it pays off immensely. Those who are turned off by the words “Elliott Wave” typically have come across those who misapply the theory or are not willing to devote the requisite energies needed to gain comprehension of what we do.
Our methodology is pointing to the potential for a low-risk, high-reward bearish setup for ADBE stock over the next several months. Not all paths will play out as illustrated. We view the markets from a probabilistic vantage point. But at the same time, we have specific levels to indicate when it’s time to step aside or even change our stance and shift our weight.
Do You Have A System In Place?
Those who have experience forged by time in the markets will tell you that it’s imperative to have a system of sorts in place. You need to be able to define how much you are willing to risk versus how much gain is likely. Those who survive across the decades in the greatest game on earth will also inform you that the preservation of capital is paramount.
While there are multiple manners of doing this, we have found Elliott Wave Theory with Fibonacci Pinball to be a tool of immense utility for traders and investors alike. It is the very methodology that we are using to identify the current setup in ADBE. Will it work out as drawn up? That is for the market to determine. Some investors will simply put this chart aside and choose a better, higher-probability bullish setup.
To be sure, there are many factors beyond one’s control. There are also market forces at work that an individual may not even perceive. Sentiment. Fear. Greed. It is all pushing and pulling the price of the stock across the chart. Our job as market observers is to identify the probable path or paths likely, and then determine our entry and exit points. That is the extent of our control. Everything else is just an illusion.
Conclusion
Many ways exist to analyze and track stocks and the market they form. Some are more consistent than others. For us, this method has proved the most reliable and keeps us on the right side of the trade much more often than not. Nothing is perfect in this world, but for those looking to open their eyes to a new universe of trading and investing, why not consider studying this further? It may just be one of the most illuminating projects you undertake.
(Housekeeping Matters)
If you would like notifications as to when our new articles are published, please hit the button at the bottom of the page to “Follow” us.
Analyst’s Disclosure: I/we have no stock, option or similar derivative position in any of the companies mentioned, but may initiate a beneficial Short position through short-selling of the stock, or purchase of put options or similar derivatives in ADBE over the next 72 hours. I wrote this article myself, and it expresses my own opinions. I am not receiving compensation for it. I have no business relationship with any company whose stock is mentioned in this article.
Seeking Alpha’s Disclosure: Past performance is no guarantee of future results. No recommendation or advice is being given as to whether any investment is suitable for a particular investor. Any views or opinions expressed above may not reflect those of Seeking Alpha as a whole. Seeking Alpha is not a licensed securities dealer, broker or US investment adviser or investment bank. Our analysts are third party authors that include both professional investors and individual investors who may not be licensed or certified by any institute or regulatory body.
STOCK WAVES: Where fundamental analysis meets technical analysis for highest-probability investment opportunities! Get leading Elliott Wave analysis from our team, along with fundamental insights and macro analysis from top author Lyn Alden Schwartzer.
“Stockwaves is my bread and butter, and that’s only catching maybe 10% of the charts they throw out! I had 7-10x+ trades with SW last year, and dozens more that were “slackers” (LOL) with “only” 3-4-5x returns. Amazing!” (Nicole)
Click here for a FREE TRIAL.


