
Summary:
- Adobe is well-positioned in the growing SaaS market, with a focus on the Business & Productivity segment, which is expected to reach a valuation of $149 billion by 2030.
- The company has consistently grown its revenue and operating income, while maintaining a healthy balance sheet and improving efficiency ratios.
- Intrinsic valuation suggests a potential annual return of 15% from the current stock price of $467, while relative valuation indicates a possible near-term stock price of $616.91 under favorable market conditions.
David Tran
Thesis
Adobe Inc. (NASDAQ:ADBE), like many other cloud-based businesses powered by AI, is poised to generate substantial cash flows in the future. Particularly, Adobe’s market is expected to grow at a pace of 13% until 2030. In this article, I have assessed Adobe’s value using a DCF model and a P/E valuation.
The DCF analysis resulted in a price of $910.85, indicating a 15% projected annual return from the current price of $467. I calculated this increase using a conservative 6% growth rate instead of the expected 13%. This leaves ample room for Adobe to capture market share from its competitors and achieve even greater growth.
The relative valuation approach yielded a price of $616, primarily influenced by near-term factors. This valuation assumes that the current AI rally continues and cloud companies continue to deliver impressive results.
Overall, I recommend a Strong Buy rating for Adobe, as it possesses a very promising outlook for the future, and a strong momentum.
Overview
About Adobe
As mentioned in their 2022 Annual Report, Adobe offers an integrated platform and a suite of applications through Adobe Experience Cloud and Adobe Creative Cloud. They primarily market their products directly to enterprise customers via app stores and their own website. These products are predominantly offered through the Software as a Service (SaaS) model. Furthermore, Adobe’s growth strategy centers around Digital Media and Digital Experience.
Market
The SaaS market is highly competitive, especially when compared to the overall Cloud Market, which is dominated by Amazon.com, Inc. (AMZN). However, in the SaaS market, no single company holds a market share larger than 25%. This presents a significant advantage for all the companies operating in the SaaS market, as they can continue to grow without concerns about anti-monopoly laws that might put them in direct conflict with the U.S. Government.
Among the key players in the SaaS market are Salesforce, Inc. (CRM), Adobe, Microsoft Corp. (MSFT), SAP SE (SAP), Oracle Corp. (ORCL), International Business Machines Corp. (IBM), ServiceNow, Inc. (NOW), and Workday, Inc. (WDAY). With a market share of 12.50%, Adobe currently stands as the second-largest SaaS company, trailing behind Salesforce.
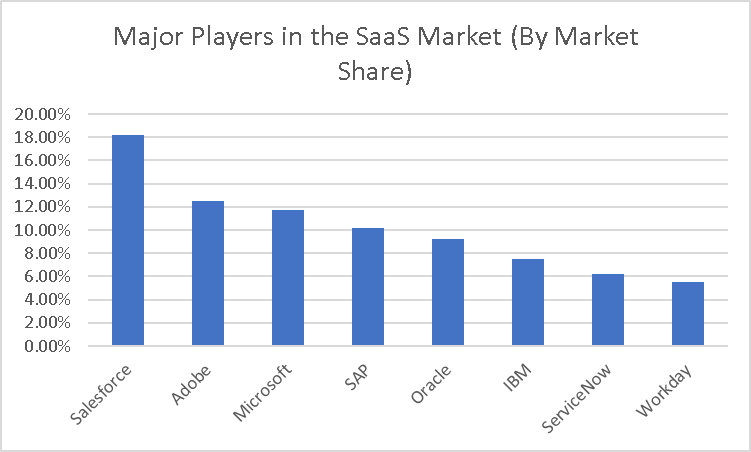
Major Players in the SaaS Market (Author’s Research )
As mentioned earlier, Adobe delivers its products through the SaaS model. It is projected that the SaaS market will reach a valuation of $149 billion by 2030, with an estimated revenue of $321.6 billion in 2026. In an article discussing Oracle, I provided a breakdown of the projected revenue for the various segments of the Worldwide Cloud Market. You can refer to the table below for these projections:
| 2023 | 2024 | 2025 | 2026 | |
| IaaS | 158,000.00 | 200,000.00 | 243,800.00 | 287,900.00 |
| PaaS | 113,300.00 | 139,300.00 | 164,200.00 | 186,500.00 |
| SaaS | 253,900.00 | 277,700.00 | 299,800.00 | 321,600.00 |
| DaaS | 35,588.00 | 44,129.12 | 54,720.11 | 67,852.93 |
| Total | 560,788.00 | 661,129.12 | 762,520.11 | 863,852.93 |
The SaaS market can be categorized into three segments: Business & Productivity, Transportation & Logistics, and Circular Economy. As evident, Adobe primarily focuses on the Business & Productivity segment. This specific segment is projected to reach a valuation of $149 billion by 2030, reflecting a 13% annual growth rate from its current value of approximately $47.3 billion.
Financials (In millions)
Since 2018, Adobe has experienced a remarkable revenue growth of 98%, corresponding to an annual growth rate of 16%. Additionally, its operating income has seen a significant increase of 112%, representing an annual growth rate of 18%. The majority of Adobe’s revenue is derived from its Subscription Revenue, accounting for 96% of the total revenue. As evident, Adobe heavily relies on subscriptions, thus necessitating continuous efforts to maintain its reputation and drive innovation in order to stay ahead of the competition. Please refer to the chart below for a visual representation of the financial aspects discussed in this paragraph:
| Revenue | Operating Income | |
| 2018 | 9039 | 2840 |
| 2019 | 11171 | 3268 |
| 2020 | 12868 | 4237 |
| 2021 | 15785 | 5802 |
| 2022 | 17606 | 6098 |
| 2023 | 17970 | 6030 |
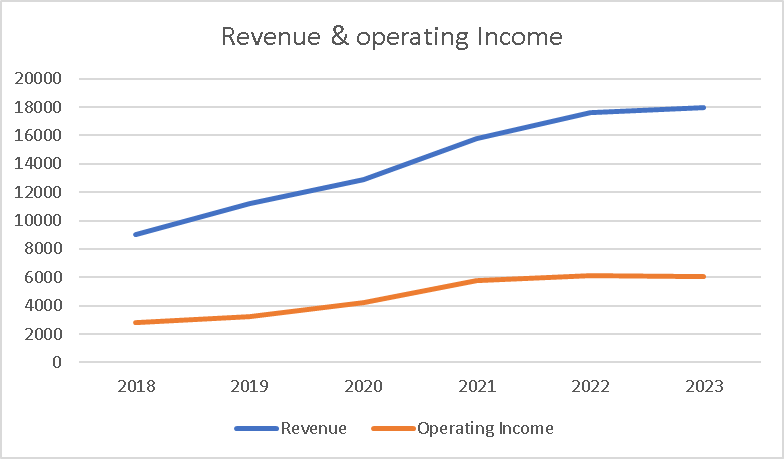
Revenue & operating Income (Author’s Calculation)
| Subscription Revenue | |
| 2018 | 7922 |
| 2019 | 9994 |
| 2020 | 11626 |
| 2021 | 14573 |
| 2022 | 16388 |
| 2023 | 17350 |
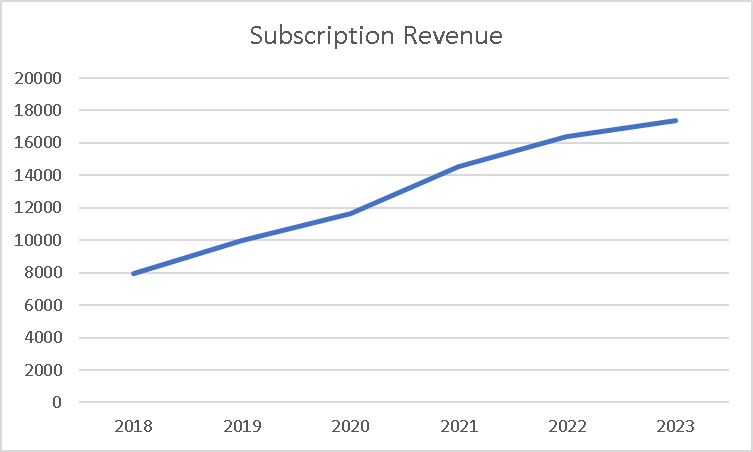
Subscription Revenue Evolution (Author’s Calculation)
When it comes to operations, Adobe operates in a market that is already characterized by low capital intensity. Over the years, Adobe has consistently improved its efficiency ratio.
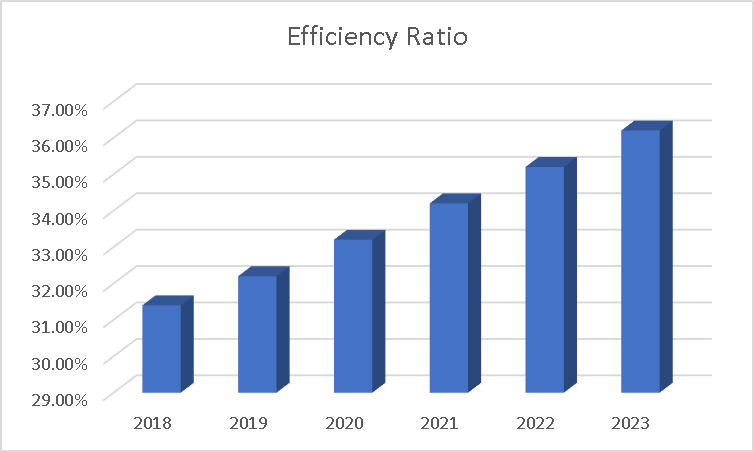
Efficiency Ratio (Author’s Calculation)
Moving on to the Balance Sheet section, we observe that Adobe has maintained a relatively healthy financial position. Despite numerous acquisitions, Adobe has managed to keep its debt level relatively stable.
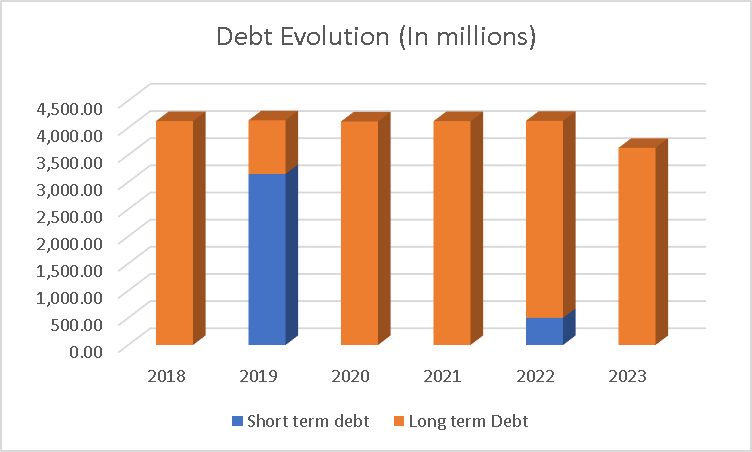
Debt Evolution (Author’s Calculation)
Their cash reserves experienced a staggering 172% increase from 2018 to 2020, and have since remained relatively stable, currently standing at $4.072 billion. Moving on to current assets and liabilities, we can observe that Adobe successfully reduced its current liabilities following the acquisition last year.
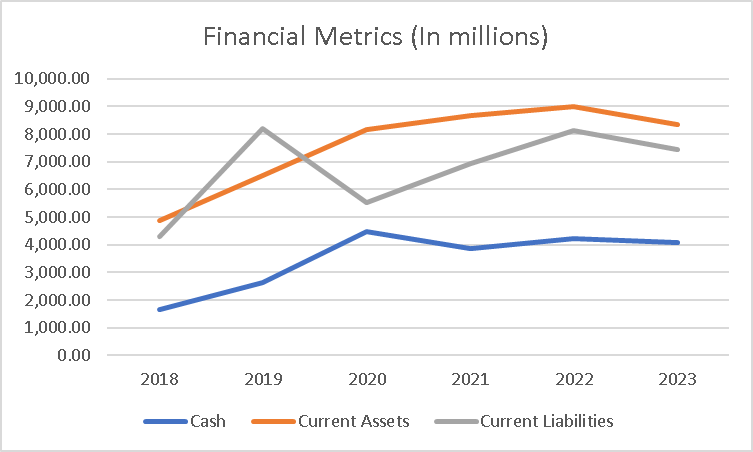
Financial Metrics (Author’s Calculation)
Overall, what we can observe here is that Adobe is committed to expansion while maintaining its financial health. They prioritize reinvesting a certain amount of money back into the business whenever it exceeds a predetermined threshold.
Valuation (Data from Q2 2022, Q3 2022, Q4 2022, and Q1 2023)
For this valuation, I will conduct both an intrinsic valuation and a relative valuation. I will begin with the intrinsic valuation, which involves projecting the estimated impact of Worldwide SaaS Revenue on Adobe. Currently, Adobe’s subscription revenue YoY is approximately $17.35 billion, accounting for around 6.8% of the total Worldwide SaaS revenue. Based on this, if we assume a global SaaS growth rate of 6% for Adobe’s revenue, the projection would be as follows:
| Revenue | |
| 1 | 18,391,000,000.00 |
| 2 | 19,494,000,000.00 |
| 3 | 20,664,000,000.00 |
| 4 | 21,903,000,000.00 |
| 5 | 23,218,000,000.00 |
| 6 | 24,611,000,000.00 |
Next, I will project the expenses as a percentage of revenue. In the case of Adobe, expenses account for 53% of the total revenue. Using this information, I can project the net income before taxes:
| Revenue | Net Income | |
| 1 | 18,391,000,000.00 | 8,643,770,000.00 |
| 2 | 19,494,000,000.00 | 9,162,180,000.00 |
| 3 | 20,664,000,000.00 | 9,712,080,000.00 |
| 4 | 21,903,000,000.00 | 10,294,410,000.00 |
| 5 | 23,218,000,000.00 | 10,912,460,000.00 |
| 6 | 24,611,000,000.00 | 11,567,170,000.00 |
Now, I will project the Depreciation & Amortization (D&A) expenses, as well as the interest expenses, using historical variations. Based on the average variations from the period of 2018-2023, which are 5.8% for D&A and 1.9% for interest expenses, I can forecast these values. Please note that 2023 is still ongoing, so year-over-year (YoY) data is used, indirectly providing a revenue forecast for FY 2023.
| D&A Projection | Interest Projection |
| 964,896,000.000 | 136,546,000.00 |
| 1,020,859,968.000 | 139,140,374.00 |
| 1,080,069,846.144 | 141,784,041.11 |
| 1,142,713,897.220 | 144,477,937.89 |
| 1,208,991,303.259 | 147,223,018.71 |
| 1,279,112,798.848 | 150,020,256.06 |
Finally, I will sum all of these values (except for revenue) to obtain the EBITDA, which is essential for calculating the EBIT and subsequently the DCF model:
| Revenue | Net Income | Plus D&A | Plus Interest | |
| 1 | 18,391,000,000.00 | 8,643,770,000.00 | 9,608,666,000.00 | 9,745,212,000.00 |
| 2 | 19,494,000,000.00 | 9,162,180,000.00 | 10,183,039,968.00 | 10,322,180,342.00 |
| 3 | 20,664,000,000.00 | 9,712,080,000.00 | 10,792,149,846.14 | 10,933,933,887.25 |
| 4 | 21,903,000,000.00 | 10,294,410,000.00 | 11,437,123,897.22 | 11,581,601,835.11 |
| 5 | 23,218,000,000.00 | 10,912,460,000.00 | 12,121,451,303.26 | 12,268,674,321.97 |
| 6 | 24,611,000,000.00 | 11,567,170,000.00 | 12,846,282,798.85 | 12,996,303,054.91 |
| ^Final EBITA^ |
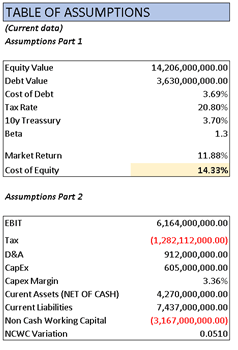
Assumptions part 1 & 2 (Author’s Calculation)
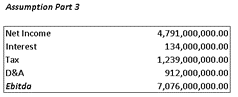
Assumptions part 3 (Author’s Calculation)
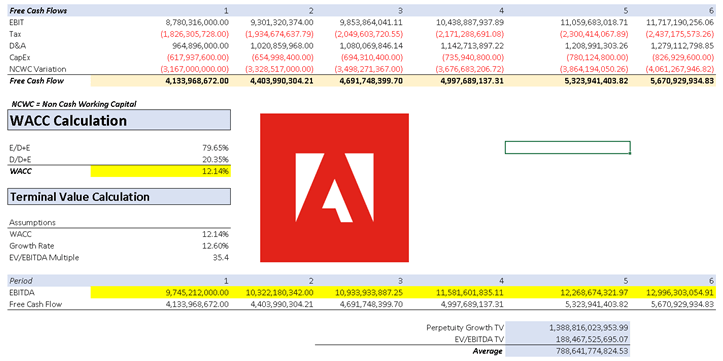
DCF part 1 (Author’s Calculation)
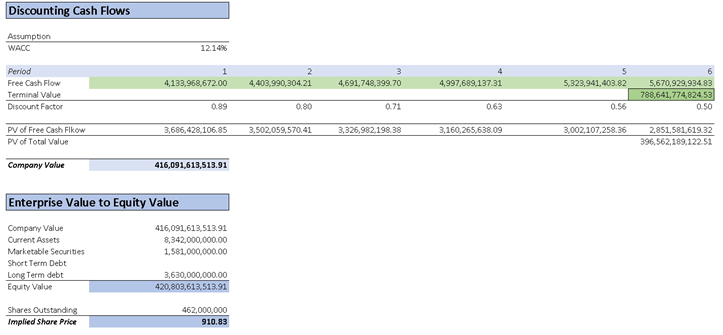
DCF part 2 (Author’s Calculation)
As you can see, the DCF model resulted in a stock price of $910.83, projecting an annual return of 15% from the current stock price of $467. This price is based on a conservative growth rate of 6% annually, compared to the expected 13% growth rate in the Business & Productivity market. This indicates that Adobe has significant potential for even greater growth, in my opinion, possibly exceeding 25% annually, as forward multiples were not even included in the DCF price calculation.
As mentioned earlier, I will also perform a relative valuation to assess where Adobe’s stock could potentially go if the momentum continues. In the calculation below, I have considered Microsoft, Oracle, IBM, and SAP, all of which are large companies facing similar situations to Adobe, striving to drive growth through M&A and innovation. The resulting stock price in the P/E valuation is $616.91, with a P/E ratio of 52.82. It is important to note that favorable market conditions are crucial for this target to be achieved. Factors such as a lower-than-expected CPI and a favorable decision by the FOMC on June 14 can contribute to this outcome.
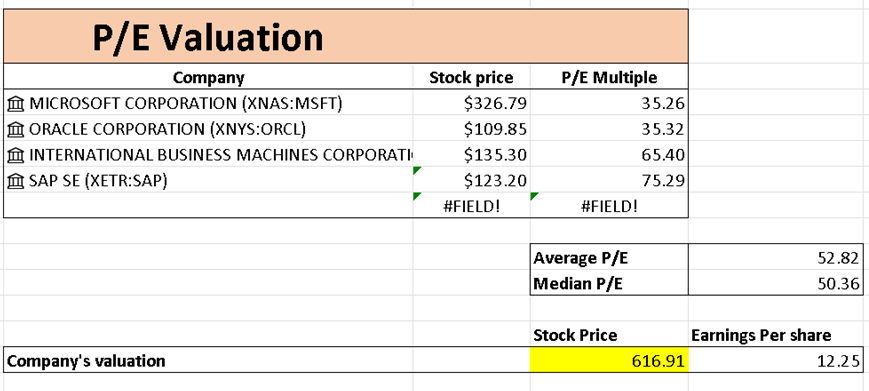
P/E Valuation (Author’s Calculation)
In summary, the long-term target price is $910.85, projecting a 15% annual return from the current point until 2026. It is important to note that this target, obtained through the DCF model, does not incorporate multiples and assumes a growth rate that is slower than Adobe’s actual operations. Therefore, this target can be considered a conservative estimate, with a high likelihood of achieving growth of 25% or more over the six-year period. On the other hand, the P/E valuation aims to provide insight into the potential trajectory of Adobe’s stock if the current rally persists. According to the calculation, the estimated price is around $616, with a P/E ratio of 52.82.
Risks to Thesis
The main risks associated with this investment thesis are relatively low. However, there are a few factors that should be considered. Firstly, a recession poses a risk for Adobe as the majority of their software sales are geared towards creative works, such as advertising. During a recession, when advertising budgets tend to decrease, there may be a decline in demand for Adobe’s products.
Another risk to consider is the momentum surrounding Adobe, particularly with regards to their association with AI technology. The rapid increase in the stock price can create , in my opinion, a precarious situation, akin to a “house of cards,” as it may be perceived as an inflated valuation. To maintain investor confidence, Adobe needs to support this valuation with sustained organic growth.
Furthermore, the cloud sector is known for its highly competitive nature. However, as the second-largest SaaS provider, Adobe possesses the ability to assert its dominance over weaker competitors.
These three risks are more closely tied to the normal challenges and fluctuations that occur during economic downturns rather than being a result of poor business decisions or unrealistic expectations.
Conclusion
Adobe is a well-managed business, with strong financials that provide ample room for reinvestment. The company’s efficiency ratio has been consistently improving since 2018.
Adobe primarily offers its products as Software as a Service (SaaS). While the overall SaaS market is expected to grow at a 6% annual rate, it is important to note that the market can be divided into three segments. Adobe’s focus lies in the business and productivity segment, which is projected to grow at a faster pace of 13%.
In the DCF model, I projected the impact of a 6% growth rate, which is considerably smaller than the 13% growth rate of the business and productivity market. This conservative approach provides a margin of safety in the DCF valuation. Moreover, it does not take into account the potential for Adobe to capture market share from its competitors. This suggests that Adobe has the potential to exceed the 15% growth projected by the DCF model and potentially achieve a growth rate of 25% or more within the six-year projection period, ending in 2028.
The main risks to this investment thesis are related to economic conditions deteriorating, which could result in a reduction in Adobe’s revenue as their software is primarily utilized by graphic designers and related professionals.
Overall, I think that if investors are comfortable with the possibility of near-term stock price fluctuations, adding Adobe to their portfolio would be a favorable decision. Therefore, I rate Adobe as a Strong Buy.
Analyst’s Disclosure: I/we have no stock, option or similar derivative position in any of the companies mentioned, but may initiate a beneficial Long position through a purchase of the stock, or the purchase of call options or similar derivatives in ADBE over the next 72 hours. I wrote this article myself, and it expresses my own opinions. I am not receiving compensation for it (other than from Seeking Alpha). I have no business relationship with any company whose stock is mentioned in this article.
Seeking Alpha’s Disclosure: Past performance is no guarantee of future results. No recommendation or advice is being given as to whether any investment is suitable for a particular investor. Any views or opinions expressed above may not reflect those of Seeking Alpha as a whole. Seeking Alpha is not a licensed securities dealer, broker or US investment adviser or investment bank. Our analysts are third party authors that include both professional investors and individual investors who may not be licensed or certified by any institute or regulatory body.