Summary:
- Adobe Inc. is a major player in the tech industry known for software like Photoshop and Acrobat.
- Short-term outlook shows recent stock performance, resistance at $580.55, and overbought RSI at 65.05.
- Medium-term outlook reveals strong support at $434, resistance at $638.25, and stock price above key moving averages.
- This article discusses entry points and the technical reasons for them, both in the short and medium terms, for Adobe.
hapabapa
Introduction
Adobe Inc. (NASDAQ:ADBE) (NEOE:ADBE:CA) is a major player in the tech industry, known for software like Photoshop and Acrobat. Primarily, Adobe’s business model is as a “SaaS” or “software as a service,” where users pay Adobe subscription fees in return for access to their software suite.
In this article, we’ll take a close look at Adobe’s recent stock performance and its technical foundations. We’ll analyze its short and medium-term outlook using technical analysis and valuation metrics.
The goal of this article is to determine, for the existing bulls, if now is a good time or not to enter the stock. As per the title, I believe it is a good time.
Overview
The stock itself has performed very well over the past month, now up almost 22% in the last 30-days.
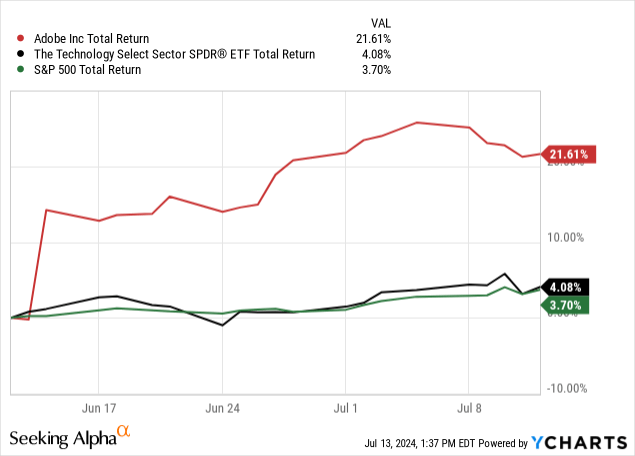
Adobe recently jumped up by 14% on June 14th after its quarterly earnings report, beat analyst expectations and surprised the market. Prior to the breakout, the stock had been in a downtrend consolidating in a channel.
Figure 1 (Author via TradingView)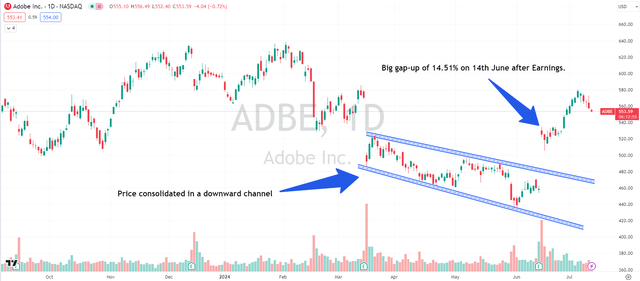
This surprise earnings result has catapulted Adobe back up to its highs prior to the March drop, which is a very good sign that the market’s sentiment has reversed course.
Short-Term Technical Outlook
Support & Resistance Levels
Figure 2 (Author via TradingView)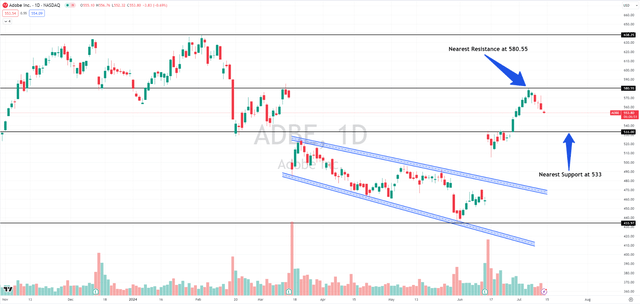
In the chart above, the black horizontal lines represent the support and resistance levels for the stock. Currently, Adobe is facing resistance at a price level of $580.55. We can expect a breakout from Adobe from its nearest resistance in the coming trading sessions if market conditions and the trend remain bullish. I will be closely watching this level, as I believe it will be the largest hurdle in showing that market sentiment has truly reserved. After that level at $580, there is little in the way between that and Adobe’s all-time-high.
As for its nearest support level, we can expect buying pressure if the price comes close to the $533 to $530 range, which is also where I will be wanting to buy at should it fall back that far. If ADBE does breakout in the coming trading sessions from its current resistance at $580, we can expect the price to rally and hit an initial resistance at $610. If the stock continues the uptrend, the next resistance level is the 52-week high of $638.25.
Volume
Adobe has a monthly average volume of 4.22 million and is a highly liquid stock. The breakout from the downward channel on 14th June was combined with good volume. However, there has been a relative decline in daily volume levels since the prices gapped up after a positive earnings report.
Figure 3 (Author via TradingView)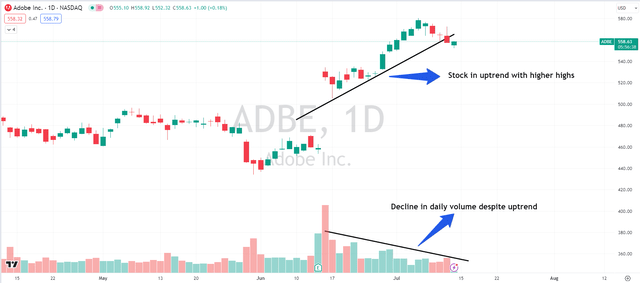
As seen in the chart above, a divergence can be noticed in the price and volume. While the prices have been in an upward trend, the volume has been on a decline, which is not a good sign and signals weakness. The price and volume should both be on an uptrend, with each higher high to continue the bullish momentum.
Moving Averages & RSI
Figure 4 (Author via TradingView)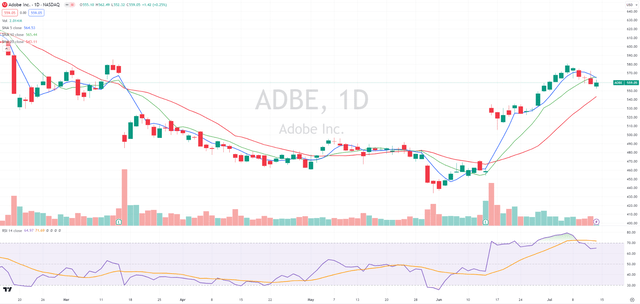
As seen in the chart above, Adobe’s current stock price of $559 is below the shorter-term moving averages; 5-day MA (blue line) and 10-day MA (green line), indicating a recent downward momentum in its price. However, the price has been above the 20-day MA (red line) for the past 19 trading sessions. The 20-day MA can act as a support if prices continue to decline.
Adobe’s Relative Strength Index (“RSI”) is currently 65.05, indicating it’s in the overbought zone, suggesting a potential pullback could be on the horizon. And despite a strong 21.87% surge in the last 30 days, declining trading volume alongside rising prices raises caution for the short term.
I would instead suggest waiting for that pullback to buy. That pullback could pull the RSI down to 30 or less and the price down to its support of $533, or the 20-day MA support of $540.
Medium-Term Technical Outlook
Support & Resistance Levels
When we take a top-down approach and look at Adobe’s weekly chart, the price action becomes much clearer.
As of Friday, the stock closed with an inside candle pattern. This can be a good setup for swing and positional traders. The previous few candles indicate strength with good volume, but we might see a small pullback from the current levels as the price approaches resistance.
Figure 5 (Author via TradingView)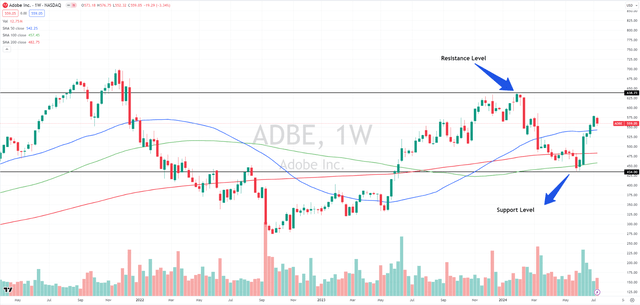
In the medium term, Adobe faces a strong resistance level at $638, which is also its 52-week high. On the downside, there’s significant support around $434, close to the 52-week low of $433. As seen in the weekly chart above, the stock has surged 21.87% over the past four weeks from its 52-week low, indicating strong upward momentum.
This rise shows investor confidence, but as the stock approaches the resistance level, we might see a temporary pause or a small pullback. It’s important to keep an eye on these key levels because they can provide good opportunities for longer-term trades.
Moving Averages
Figure 6 (Author via TradingView)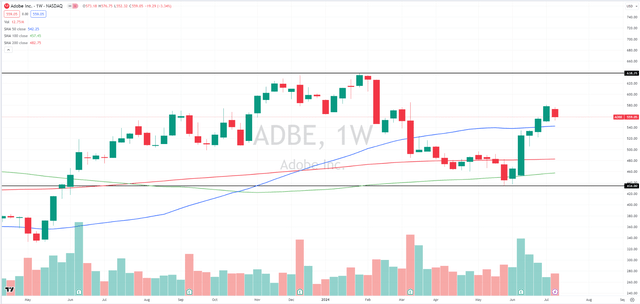
On the weekly timeframe chart, Adobe’s current share price of $559, is above its key moving averages. The 50-day exponential moving average (blue line) is at $542, the 200-day simple moving average (red line) is at $482, and the 100-day simple moving average (green line) is at $457. This means Adobe’s stock is showing strong upward momentum, as the current price and weekly close are above all three key moving averages.
Valuation and Key Ratios
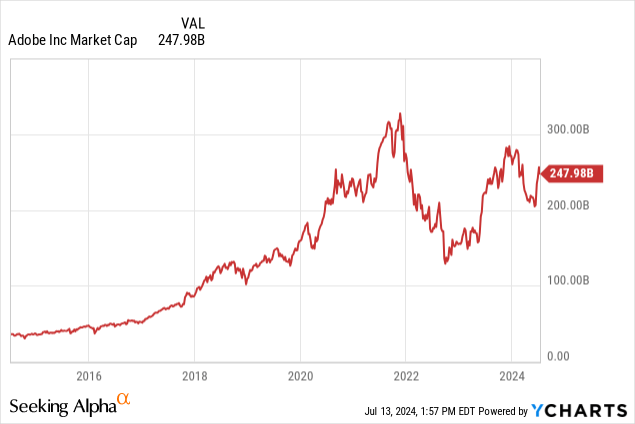
Adobe Inc. is valued at approximately $248B in terms of market capitalization, ranking it among the world’s top 50 most valuable companies.
Key Ratios
-
PE Ratios: Adobe’s trailing PE ratio stands at 50.23. Looking ahead, the forward PE ratio is lower at 28.77, showing expectations of improved future earnings growth.
-
The Price-to-Sales (PS) ratio is 12.13, and the forward PS ratio is 10.75.
-
Price-to-Book (PB) ratio is 16.70.
-
Price-to-Free Cash Flow (P/FCF) ratio of 38.93.
-
The PEG ratio stands at 1.76, suggesting Adobe’s stock is reasonably valued considering its projected earnings growth rate.
These show us that Adobe is overvalued with its current ratios relative to the S&P 500, but moderately valued when looking at the tech sector only.
Risks
Technical analysis is more about finding potentially helpful patterns than it is useful for scientific conclusions. It’s unclear where ADBE will trade from here, and any of the patterns that I’ve mentioned could be broken moving forward.
The largest risk to ADBE in the short term is that a negative catalyst outside of the company’s control takes down the stock in sympathy with the broader market. This is an unavoidable risk and should be considered carefully when entering any equity position.
The largest risk to ADBE in the medium term is them not living up to earnings expectations and revenue growth figures. That conversation is more suited for a fundamental analysis article, so I will leave you with a link to Khaveen Investments’ Adobe: AI Developments Galore, which was very informative and helpful in understanding Adobe’s potential from a fundamental standpoint.
Conclusion
In the short term, Adobe’s stock has shown a recent downward trend relative to its 5-day and 10-day moving averages, despite maintaining above its 20-day moving average, currently acting as a support level. With an RSI indicating overbought conditions at 65.05 and a notable 21.87% gain over the past month, caution is advised due to declining trading volumes, which may signal potential weakness in the near future. I will wait to enter a short-term position until the stock gets closer to resistance and would consider entering no higher than $540 without a clear catalyst.
Looking ahead, Adobe’s medium-term outlook reveals robust support at around $434, near its 52-week low, and significant resistance at $638.25, its 52-week high. The stock has surged impressively by 21.87% over the past month from its 52-week low levels, reflecting strong upward momentum.
On the weekly timeframe, Adobe’s stock price also stands above its key moving averages (50, 100, 200 MAs). This indicates continued bullish sentiment and potential support levels for future price movements. If you are considering entering ADBE for the long run, several years or more, then I would advise that now is a good time to start building a position.
Thanks for reading.
Analyst’s Disclosure: I/we have a beneficial long position in the shares of ADBE either through stock ownership, options, or other derivatives. I wrote this article myself, and it expresses my own opinions. I am not receiving compensation for it (other than from Seeking Alpha). I have no business relationship with any company whose stock is mentioned in this article.
Seeking Alpha’s Disclosure: Past performance is no guarantee of future results. No recommendation or advice is being given as to whether any investment is suitable for a particular investor. Any views or opinions expressed above may not reflect those of Seeking Alpha as a whole. Seeking Alpha is not a licensed securities dealer, broker or US investment adviser or investment bank. Our analysts are third party authors that include both professional investors and individual investors who may not be licensed or certified by any institute or regulatory body.
