
Summary:
- Hold Recommendation: The conclusion underscores a cautious “Hold” rating for Adobe, acknowledging a diminished undervaluation scenario and highlighting potential downside risks in the current market conditions.
- Target Price $607.1: A target price of $607.1 is assigned, reflecting a conservative 1.9% upside from the current stock price of $595.7.
- Limited Upside: Despite a 16.8% potential upside hinging on Figma’s acquisition, Adobe’s appreciation prospects are now perceived as more constrained compared to earlier assessments.
- Market Uncertainties: Acknowledging market uncertainties, especially concerning the potential blockage of Figma’s acquisition, which may trigger emotional reactions and contribute to downside risks despite the stock’s fair valuation.
- Prudent Strategy: While external factors could positively influence Adobe’s trajectory, the conclusion advocates a cautious strategy, emphasizing the importance of prudence in the current market landscape.
Sundry Photography
Thesis
In my previous article about Adobe, Inc. (NASDAQ:ADBE), I set a price target of $597. Currently, the stock is trading at $595.7. From this, we can infer that the stock is fairly valued at its present price.
However, the current scenario reveals that the risks now outweigh the potential rewards. Since my initial article on Adobe, the stock has surged by 28.49% from its then price of $467. The potential gain could have been even more significant if I had managed to publish my article on time, given that, at the inception of my writing, the stock was hovering around $420, representing a potential 41% upside.
With the current risk-to-reward imbalance, I am downgrading the stock to a “hold” recommendation. I am assigning a fair price of $607.1, a modest 1.9% increase from the current stock price of $595.70.
Overview
Adobe is scheduled to release its Q4 earnings on December 14, 2023. The recent upswing in the stock can be largely attributed to the surge in AI enthusiasm. This momentum extended to Adobe with the introduction of Adobe Firefly, a tool that employs generative AI to create images.
Status of the Figma Deal
The deal has persistently faced obstacles due to anti-competitive concerns, and on November 28, the UK’s Competition and Market Authority further postponed the acquisition.
Adobe has announced that they will have to defend the acquisition in court on December 8, 2023. However, a resolution might not be imminent, as the UK’s CMA suggests that a final verdict may not be delivered until February 25, 2024.
Market
The SaaS market is projected to witness a growth rate of 7.69% from 2023 to 2028, representing a conservative estimate. In contrast, Grand View Research suggests a higher CAGR of 13.17% for the period from 2023 to 2030.
Revenue of the Global SaaS Market (2023-2028) (Statista)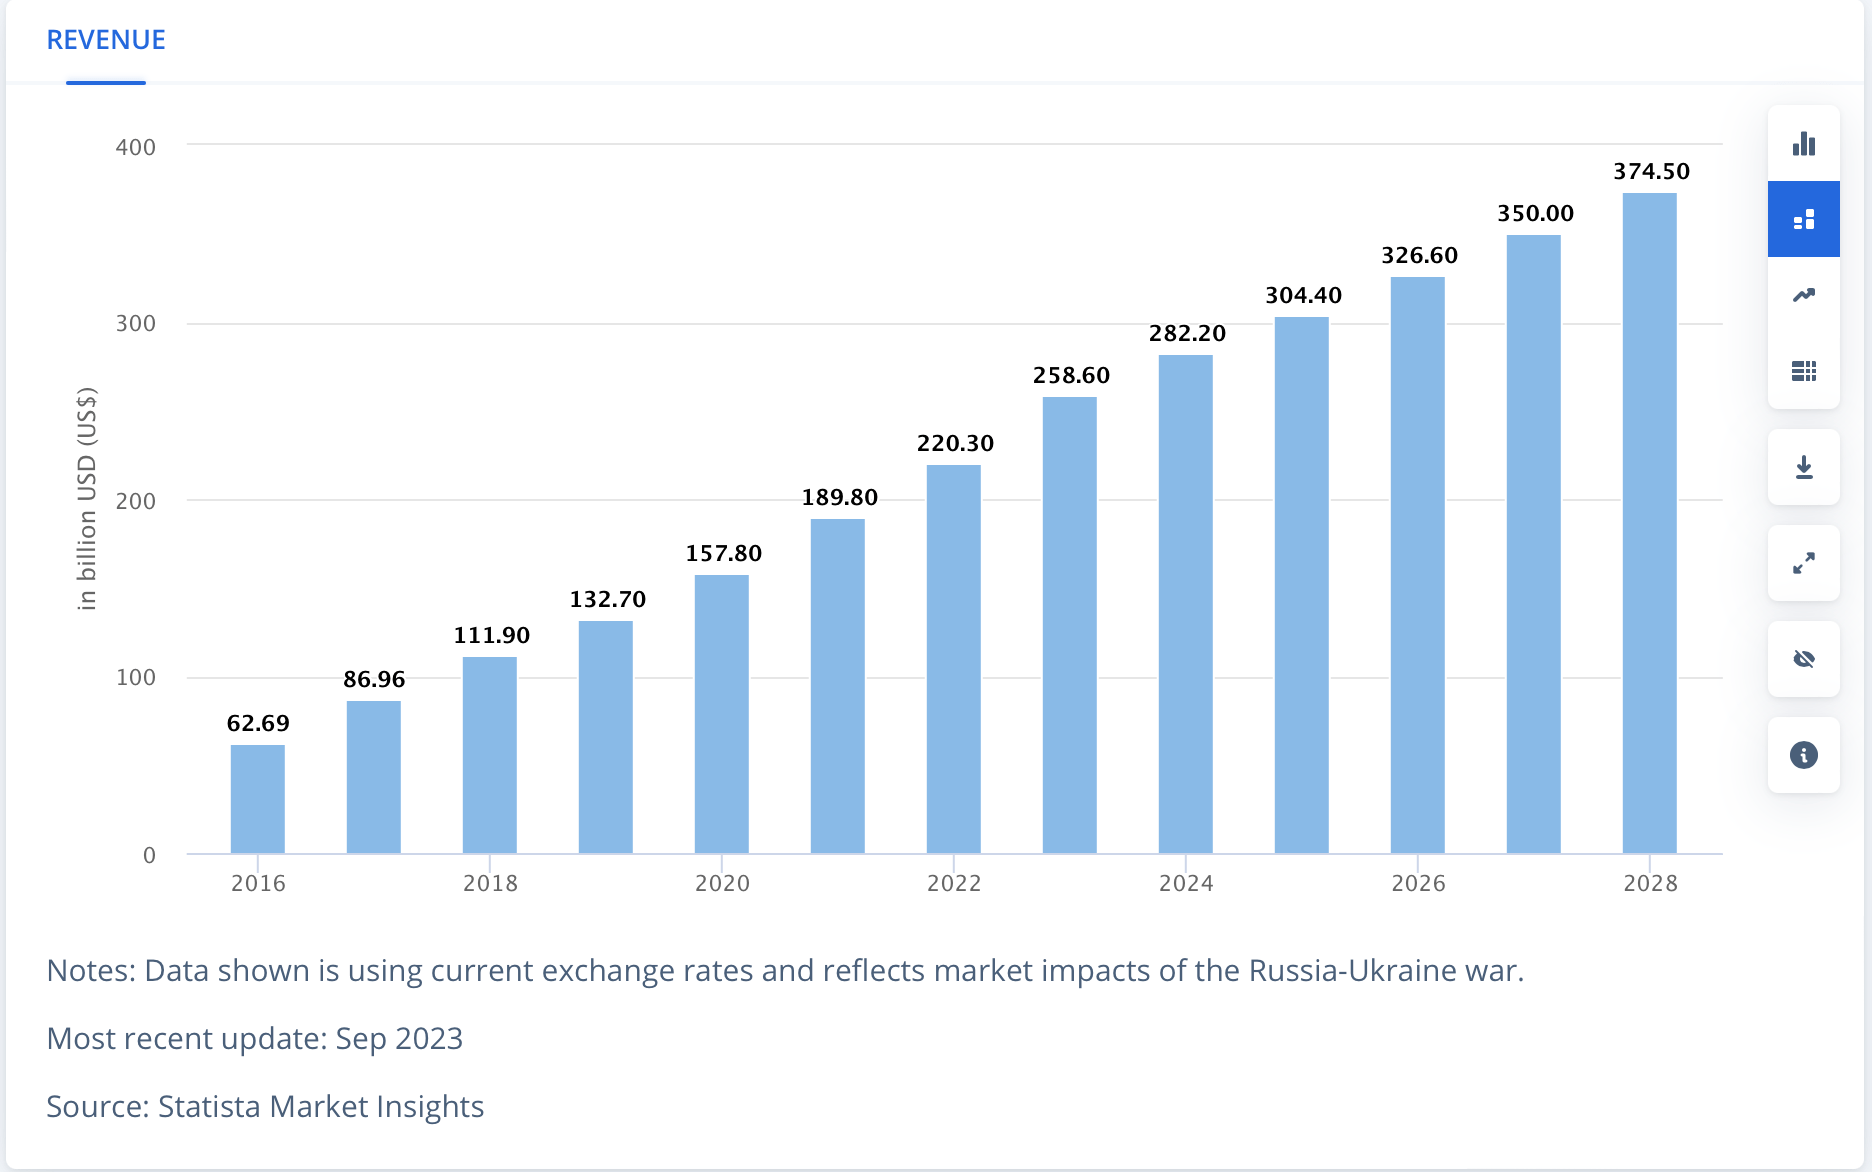
Despite this anticipated growth, the SaaS market is characterized by fragmentation across various segments such as Banking, Financial Services and Insurance (BFSI), healthcare, logistics, business & productivity, among others. Notably, Adobe primarily specializes in business & productivity software.
Within the business & productivity segment, a robust growth rate of 13.5% is anticipated. It is important to clarify that the table provided below is distinct from the one by Statista, as Statista’s table pertains to revenue, whereas the one below pertains to market size.
Grand View Research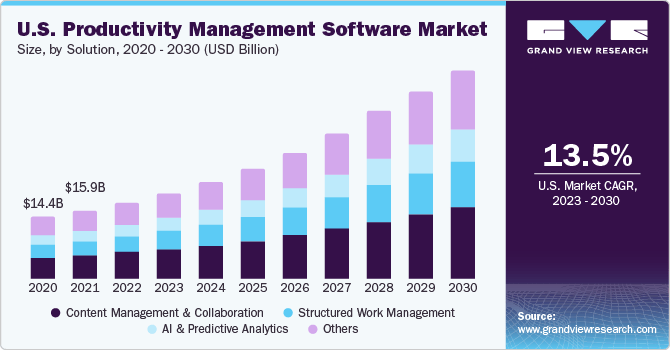
Financials
Since FY2018, Adobe’s revenue has experienced an annual growth rate of 21.91%. On a year-over-year (YoY) basis, the increase in revenue has been a more moderate 6.81%. Operating income has followed a similar trajectory, expanding at a rate of 25.15%, while on a YoY basis, it has grown at a rate of 5.14%.
Concurrently, net income has exhibited growth at a rate of 19.52%. On a YoY basis, it has recorded the highest increase at 7.67%, surpassing both revenue and operating income.
Author’s Calculations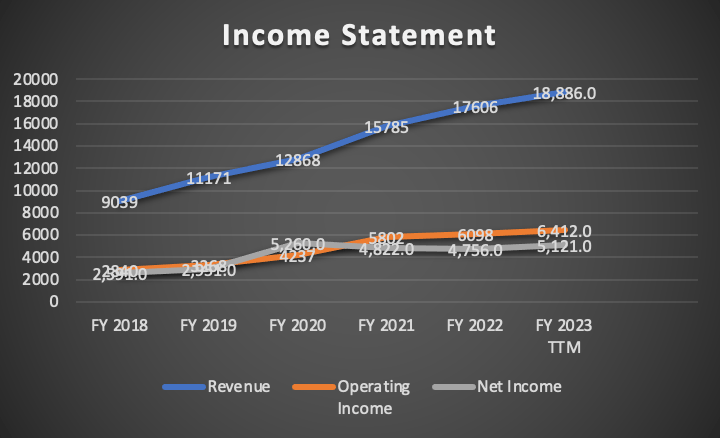
The stability of margins is noteworthy, with the current operating margin and net income margin standing at 33.16% and 30.11%, respectively. Looking back to 2018, these margins have consistently hovered around the 30% mark, except for a notable spike in net income margin to 40.88% in 2020, followed by a swift decline.
Author’s Calculations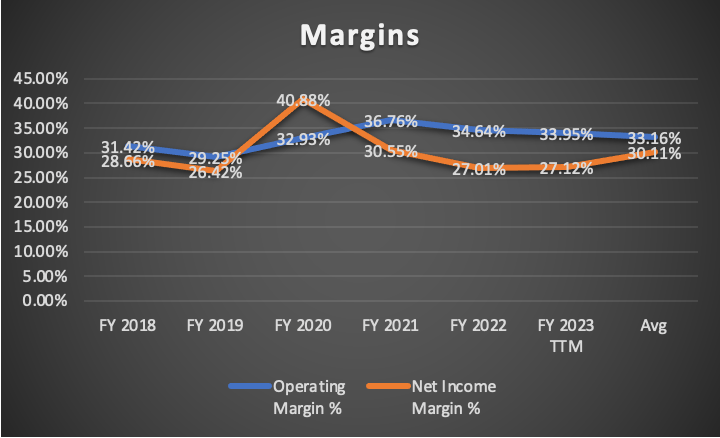
Examining Adobe’s balance sheet, it remains robust, although the impending acquisition of Figma for $20B (excluding investment banking fees and legal expenses) could significantly impact it. Nevertheless, at first glance, Adobe could retire its entire debt and still retain $3.42B in cash.
Author’s Calculations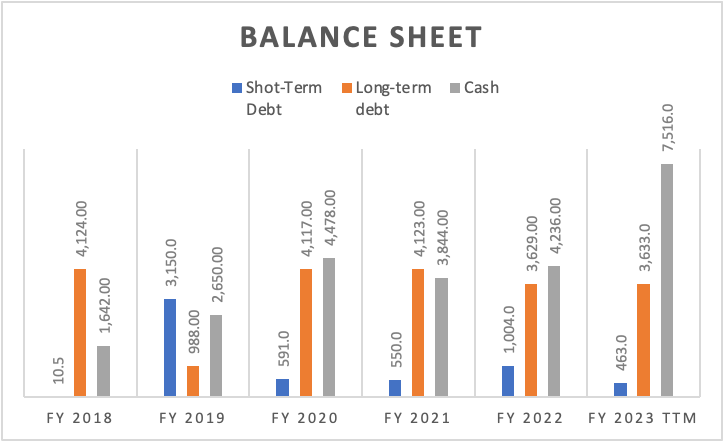
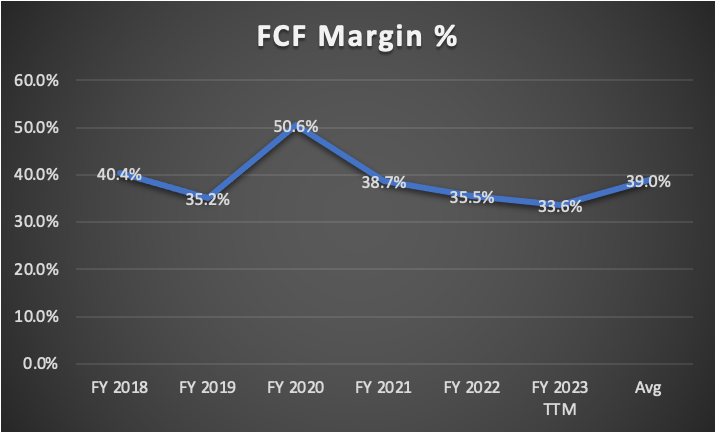
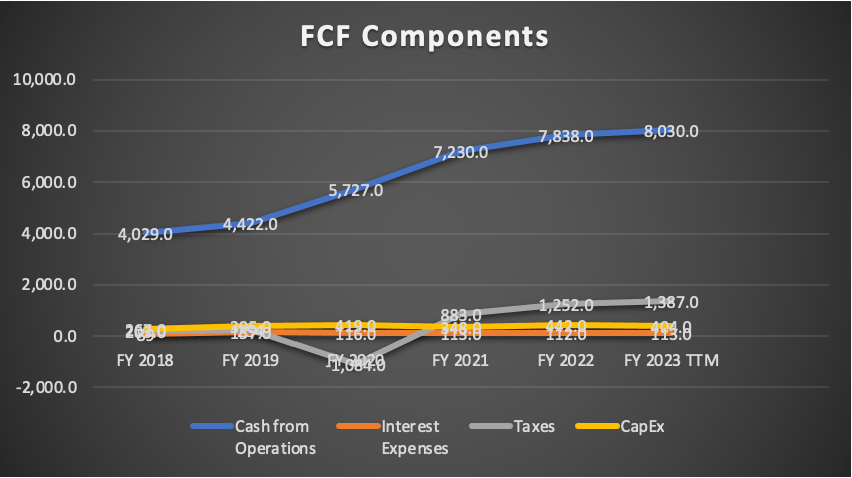
In terms of free cash flow, Adobe has consistently generated over $6B since 2020, translating to an impressive margin of 39% when compared to revenue.
A closer look at the “free cash flow components” table reveals an upward trend in taxes. Since 2021, Adobe’s tax expenses have surged by approximately 27.2% annually.
Author’s Calculations Author’s Calculations Author’s Calculations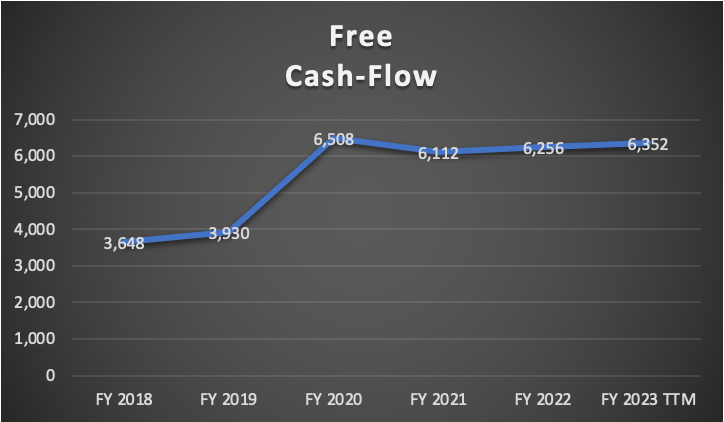
Valuation
In this valuation analysis, I will employ two DCF models to evaluate Adobe’s intrinsic value. The first model incorporates Analysts’ estimates for revenue and EPS in FY2023 and FY2024, in addition to forward revenue growth and the 3 to 5-year long-term EPS growth rate.
The second DCF model is anchored in the projected market revenue for the Business & productivity SaaS Market of 13%.
The provided table encompasses all current data pertinent to Comcast. Using this data, I will calculate the Weighted Average Cost of Capital (WACC), factoring in Equity value, Debt value, and Cost of debt. Additionally, Depreciation and Amortization (D&A), Interest, and CapEx will be derived based on margins tied to revenue growth. This methodology ensures that as Adobe’s revenue expands, these expenses will also increase, providing a more realistic and logical projection.
| TABLE OF ASSUMPTIONS | |
| (Current data) | |
| Assumptions Part 1 | |
| Equity Value | 15,776.00 |
| Debt Value | 4,096.00 |
| Cost of Debt | 2.76% |
| Tax Rate | 21.31% |
| 10y Treasury | 4.80% |
| Beta | 1.28 |
| Market Return | 10.50% |
| Cost of Equity | 12.10% |
| Assumptions Part 2 | |
| CapEx | 404.00 |
| Capex Margin | 2.14% |
| Net Income | 5,121.00 |
| Interest | 113.00 |
| Tax | 1,387.00 |
| D&A | 241.00 |
| Ebitda | 6,862.00 |
| D&A Margin | 1.28% |
| Interest Expense Margin | 0.60% |
| Revenue | 18,886.0 |
Analysts’ Estimates
For the initial model, I will assess Adobe’s valuation based on current analysts’ estimates for revenue and EPS, as well as incorporate the anticipated forward revenue growth and the 3-5 year long-term EPS growth.
Presently, analysts’ estimates project Adobe’s revenues to reach $19.38B for FY2023 and $21.76B for FY2024.
Revenue Estimates (Seeking Alpha)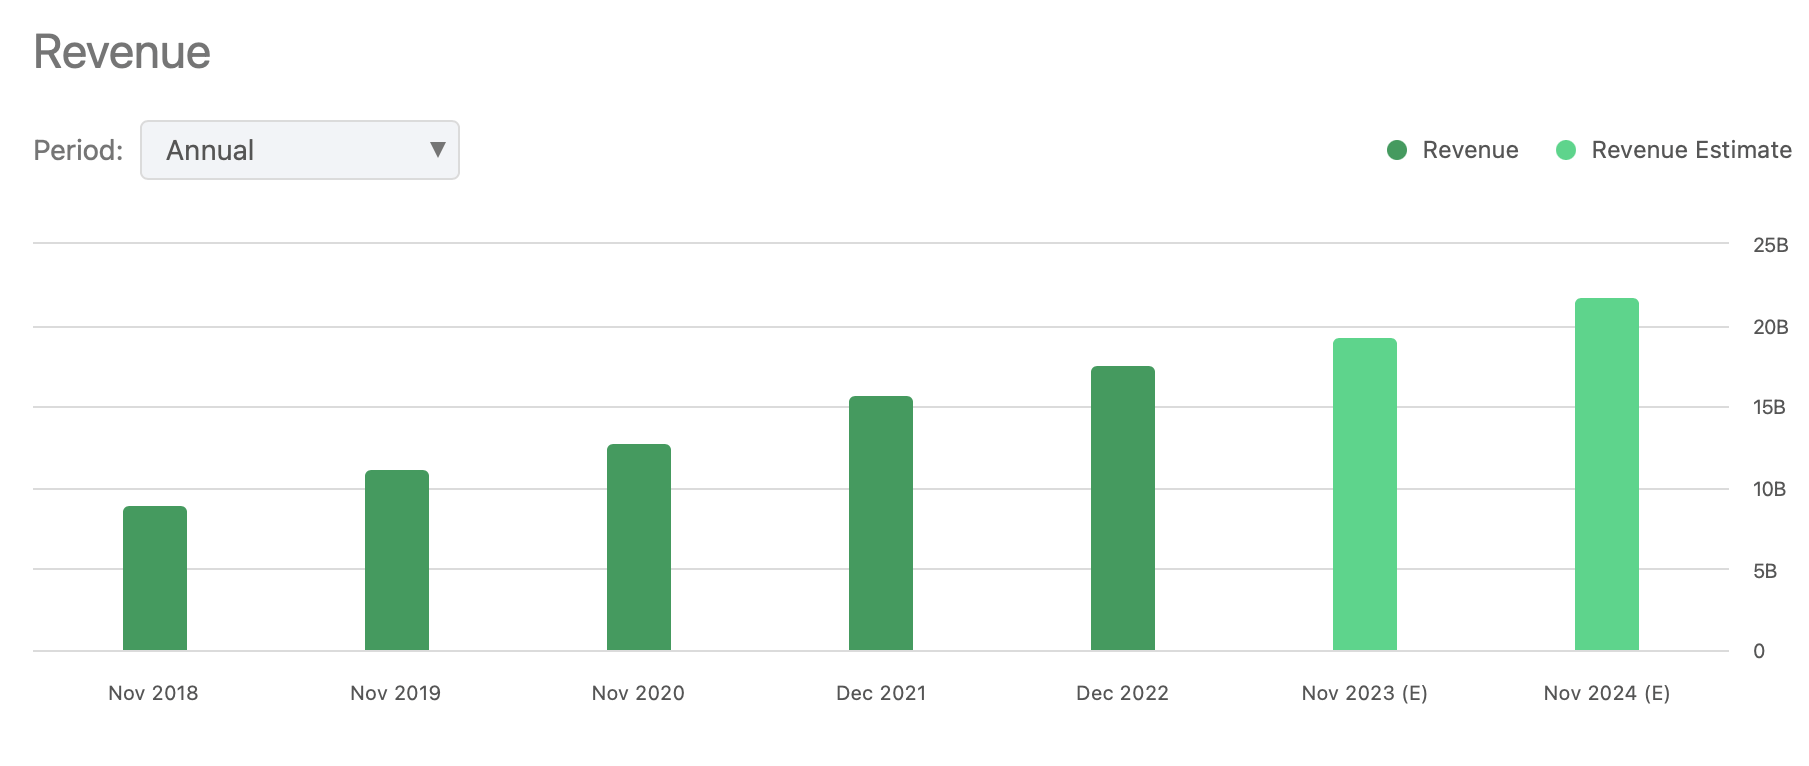
In terms of EPS, analysts anticipate $4.14 for FY2023 and $4.26 for FY2024, corresponding to net incomes of $7.2B and $8.25B, respectively.
EPS Estimates (Seeking Alpha)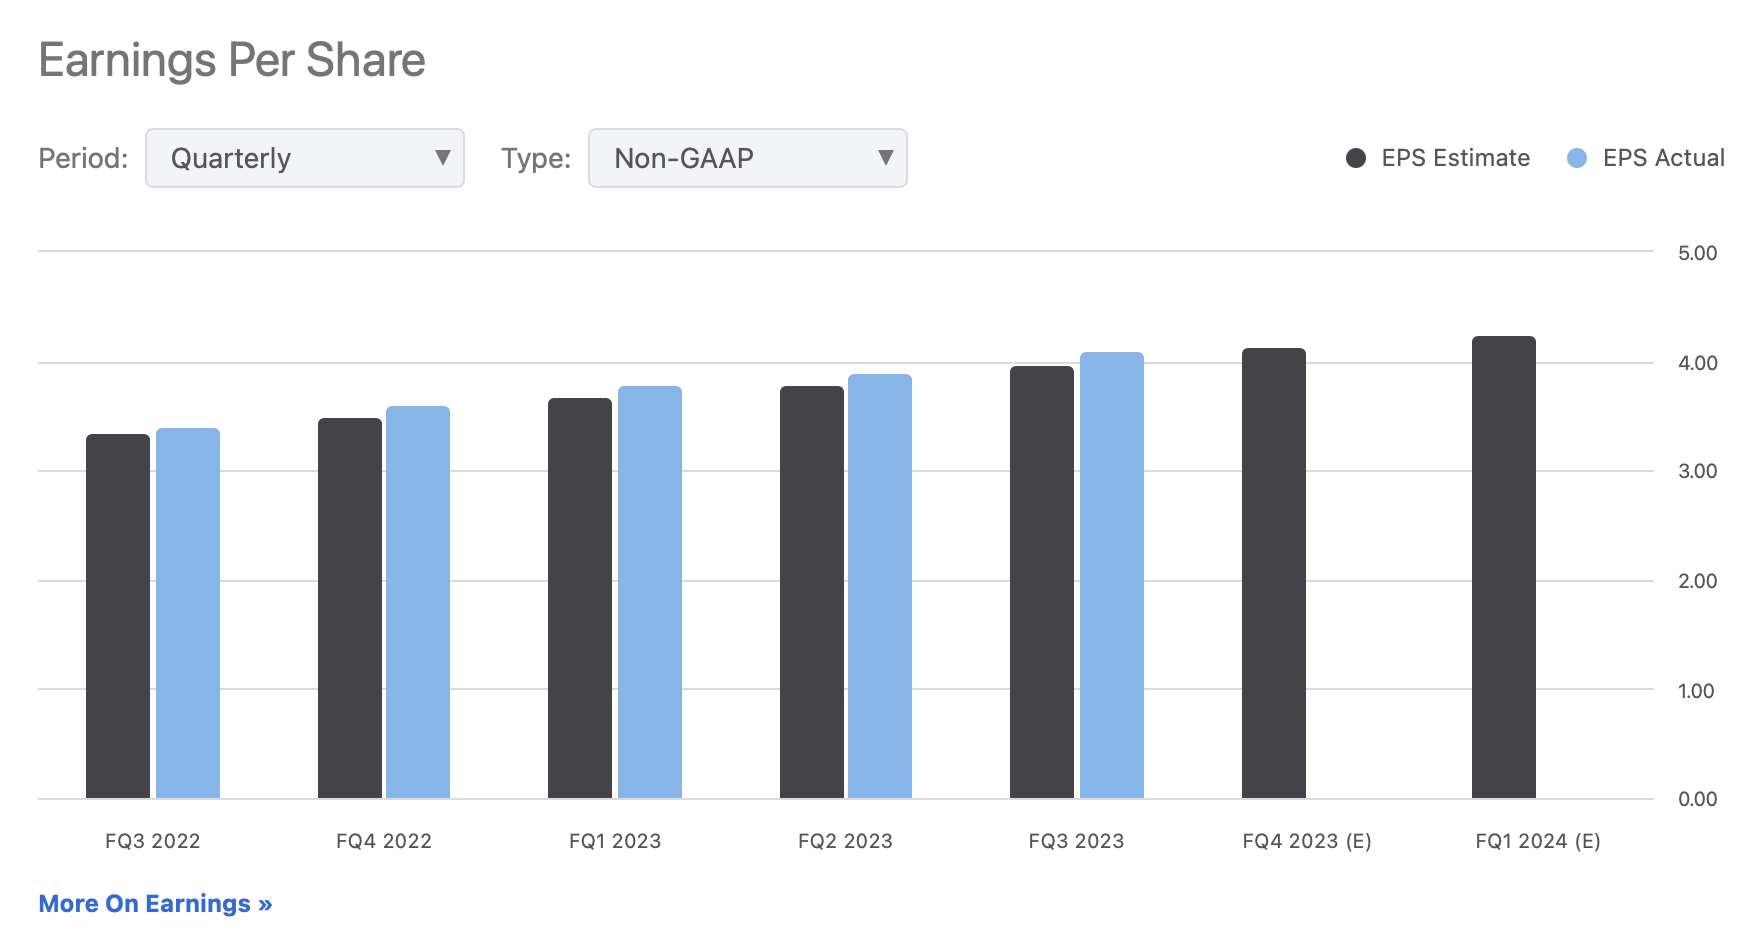
Additionally, analysts project a forward revenue growth rate of 11.29%, and for the long-term EPS growth, an expectation of 15.92%. As depicted in the table below, these figures surpass the sector median.
Growth (Seeking Alpha)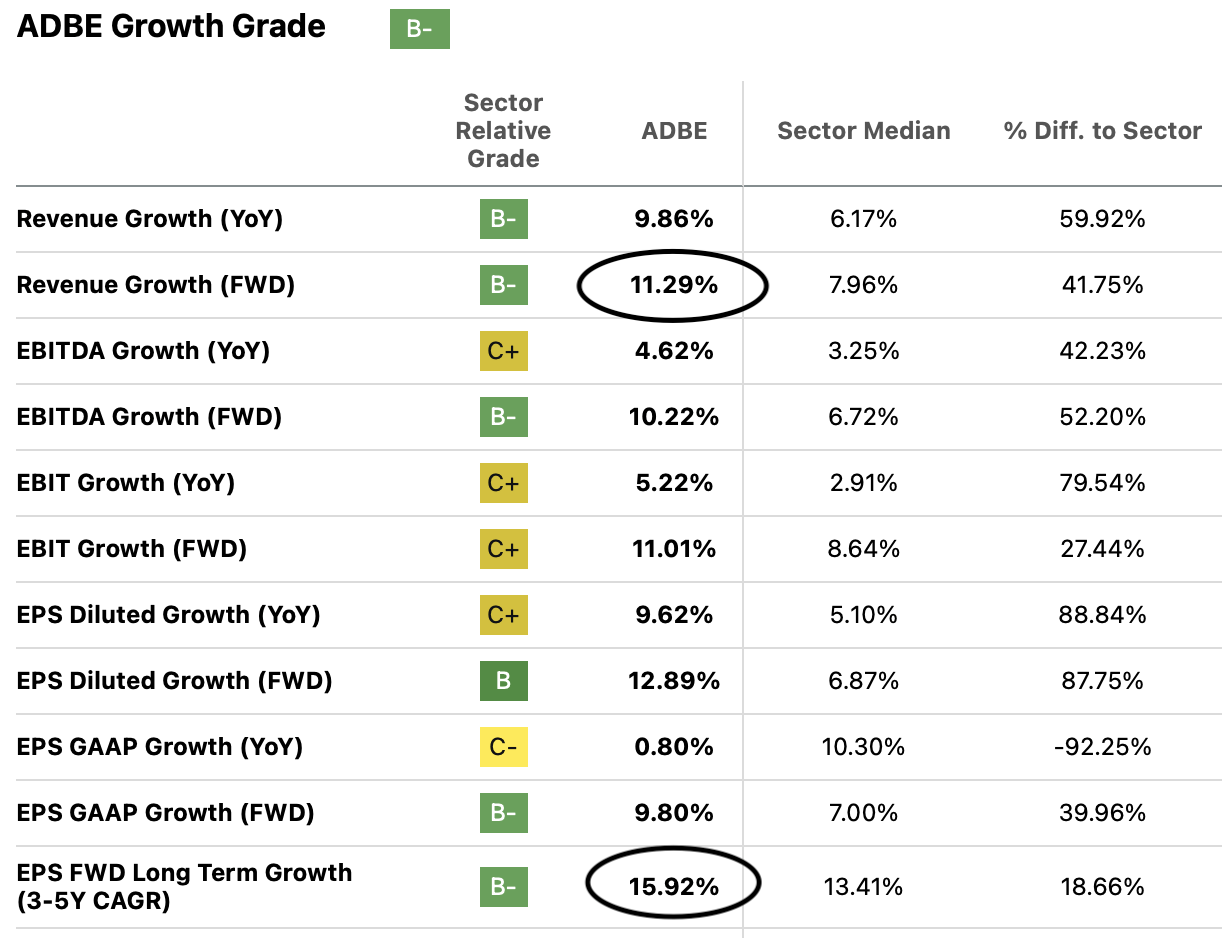
| Revenue | Net Income | Plus Taxes | Plus D&A | Plus Interest | |
| 2023 | $19,380.0 | $7,264.08 | $8,812.22 | $9,455.62 | $9,571.57 |
| 2024 | $21,740.0 | $8,157.84 | $9,896.46 | $10,539.86 | $10,655.81 |
| 2025 | $24,187.9 | $9,456.57 | $11,471.97 | $12,274.99 | $12,419.72 |
| 2026 | $26,911.5 | $10,962.05 | $13,298.31 | $14,191.75 | $14,352.77 |
| 2027 | $29,941.7 | $12,707.21 | $15,415.40 | $16,409.44 | $16,588.59 |
| 2028 | $33,313.2 | $14,730.20 | $17,869.54 | $18,975.51 | $19,174.83 |
| ^Final EBITA^ |
Author’s Calculations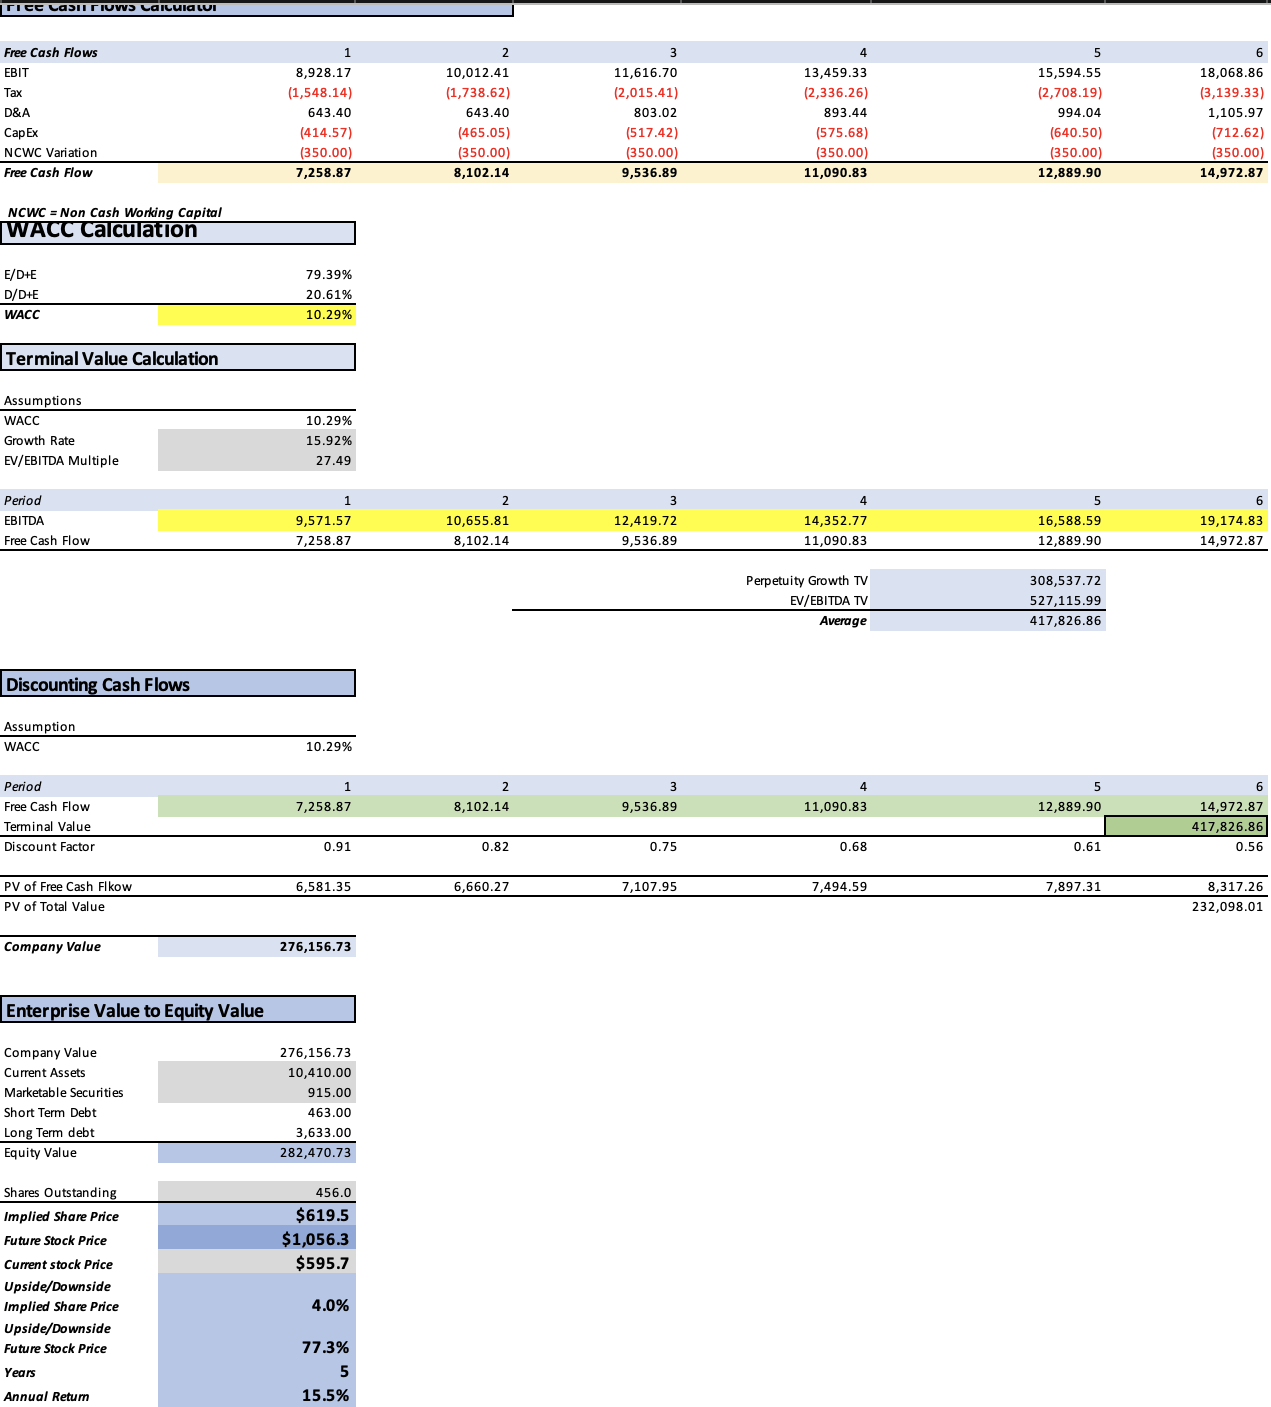
The outcome of this initial model yields a fair price of $619.5. In relation to the current stock price of $595.7, this implies an upside of 4%. Moreover, it suggests a prospective stock price of $1056.3, indicating an annual return of 15.5% over the next 5 years.
My Estimates
In this second model, my approach involves projecting Adobe’s revenue to grow by 13% from 2024 to 2028. Regarding net income, my assumptions are as follows: 37.52% for 2024, 39.19% for 2025, and a consistent 40% for 2026-2028. Meanwhile, the revenue and net income for 2023 will remain in line with current analyst predictions.
| Revenue | Net Income | Plus Taxes | Plus D&A | Plus Interest | |
| 2023 | $19,380.0 | $7,264.00 | $8,812.12 | $9,455.52 | $9,571.48 |
| 2024 | $21,899.4 | $8,216.65 | $9,967.81 | $10,611.21 | $10,727.16 |
| 2025 | $24,746.3 | $9,675.81 | $11,737.94 | $12,559.50 | $12,707.57 |
| 2026 | $27,963.3 | $11,185.34 | $13,569.18 | $14,497.54 | $14,664.86 |
| 2027 | $31,598.6 | $12,639.43 | $15,333.18 | $16,382.22 | $16,571.29 |
| 2028 | $35,706.4 | $14,282.56 | $17,326.49 | $18,511.91 | $18,725.55 |
| ^Final EBITA^ |
Author’s Calculations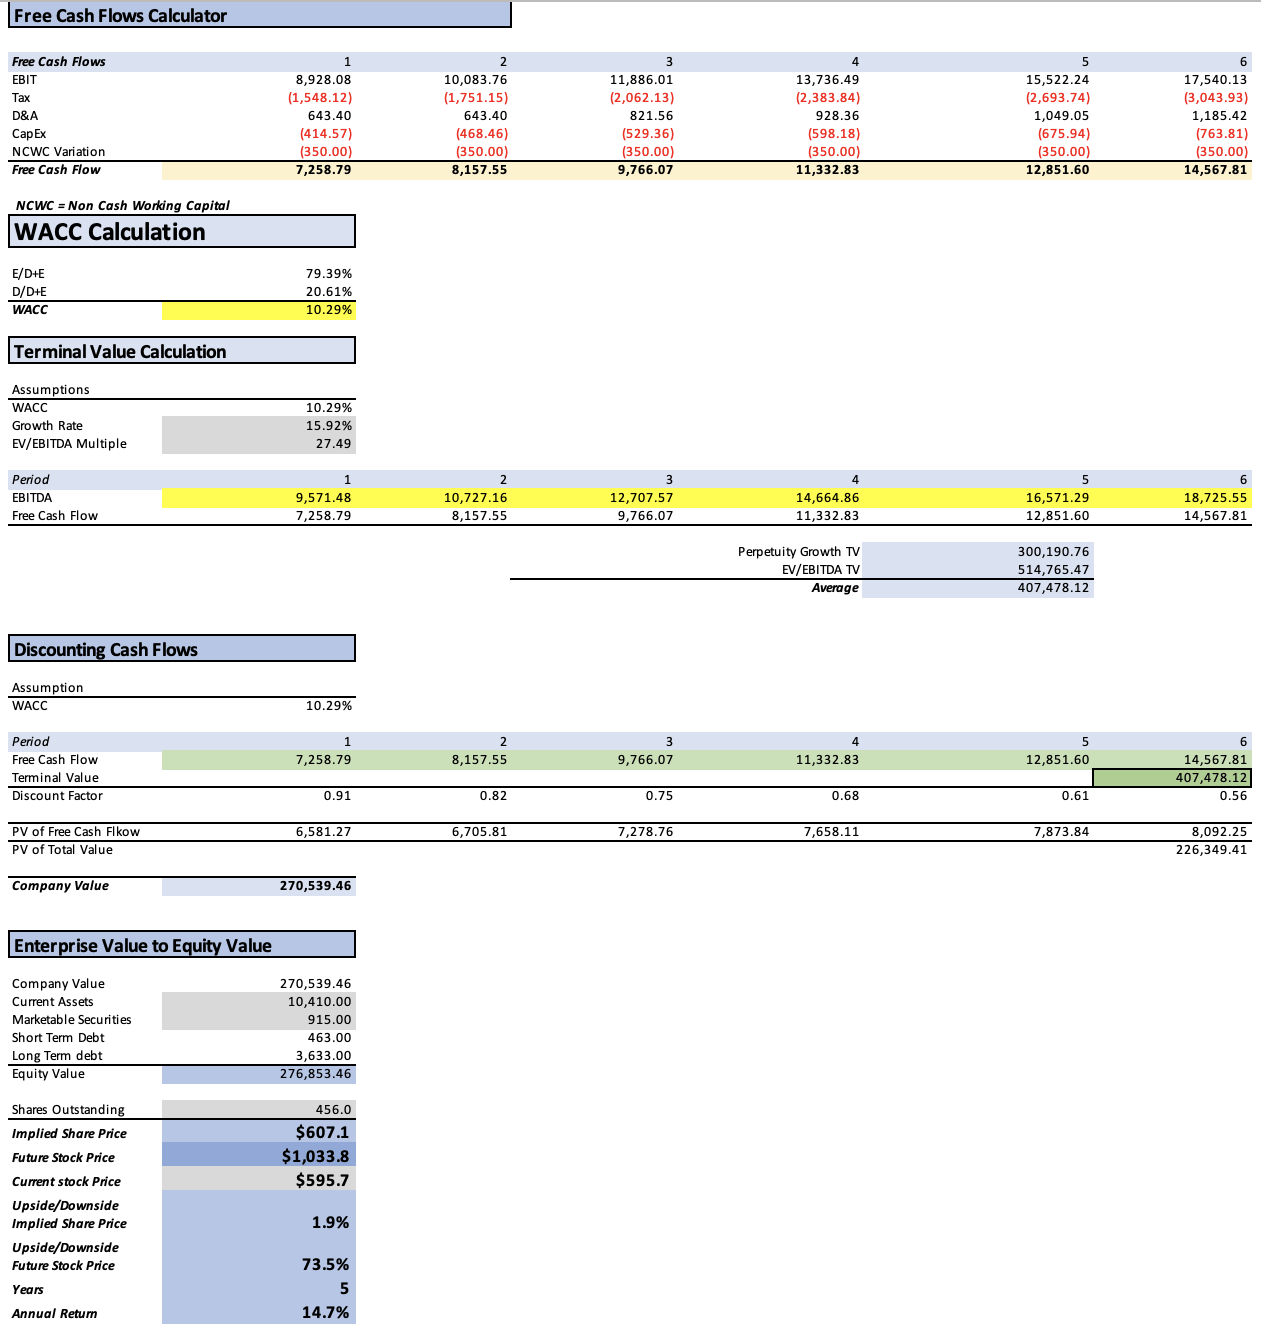
The outcome of this second model establishes a stock price target of $607.1, reflecting a 1.9% increase from the current stock price of $597.7. Additionally, it suggests a projected 2028 stock price of $1,033.80, indicating an upside of 75.5%. This equates to annual returns of 14.7%.
With Figma
For this valuation, I am assuming that when Adobe mentioned paying with “stocks and cash,” it intended to distribute the $20B in three parts: $6.6B in long-term debt issuance, $6.6B from its cash reserves, and $6.6B in stock through dilution, implying the issuance of 11.15M shares to cover that.
The interest payment on the $6.6B in long-term debt would result in an additional $70M.
| TABLE OF ASSUMPTIONS | |
| (Current data) | |
| Assumptions Part 1 | |
| Equity Value | 15,776.00 |
| Debt Value | 10,702.00 |
| Cost of Debt | 1.72% |
| Tax Rate | 21.31% |
| 10y Treassury | 4.14% |
| Beta | 1.28 |
| Market Return | 10.50% |
| Cost of Equity | 12.28% |
| Assumptions Part 2 | |
| CapEx | 404.00 |
| Capex Margin | 2.14% |
| Net Income | 5,121.00 |
| Interest | 183.65 |
| Tax | 1,387.00 |
| D&A | 627.00 |
| Ebitda | 7,318.65 |
| D&A Margin | 3.32% |
| Interest Expense Margin | 0.97% |
| Revenue | 18,886.0 |
In 2021, Figma’s revenue was $210 million, and their projections for 2022 exceeded $400 million. As a small company, they were at a stage where they were doubling their revenue every year. Now, let’s take a look at the revenue projections until 2028:
| Year | Sacra Projection |
Grand View Research Projection |
| 2022 | $400 million | $400 million |
| 2023 | $500 million | $520 million |
| 2024 | $625 million | $660 million |
| 2025 | $781 million | $820 million |
| 2026 | $974 million | $990 million |
| 2027 | $1,208 million | $1,180 million |
| 2028 | $1,500 million | $1,390 million |
As you can see, Sacra’s projections are slightly more optimistic in the final years, whereas Grand View’s are more conservative in the initial years. Despite this difference, both sets of projections are quite similar. Therefore, during the valuation process, I will primarily rely on Sacra’s projections, with one exception: for 2023, I will still utilize the figure of $400 million.
After knowing this, the next step is to sum GVR’s projections to my estimates and I will obtain the numbers for the combined entity.
| Revenue | Net Income | Plus Taxes | Plus D&A | Plus Interest | |
| 2023 | $19,900.0 | $7,264.00 | $8,812.12 | $9,472.78 | $9,666.29 |
| 2024 | $23,147.0 | $8,684.75 | $10,535.67 | $11,196.33 | $11,389.84 |
| 2025 | $26,976.1 | $10,547.66 | $12,795.60 | $13,691.19 | $13,953.50 |
| 2026 | $31,473.0 | $12,589.20 | $15,272.24 | $16,317.12 | $16,623.17 |
| 2027 | $36,744.5 | $14,697.80 | $17,830.23 | $19,050.11 | $19,407.42 |
| 2028 | $42,911.3 | $17,164.51 | $20,822.65 | $22,247.27 | $22,664.55 |
| ^Final EBITA^ |
Author’s Calculations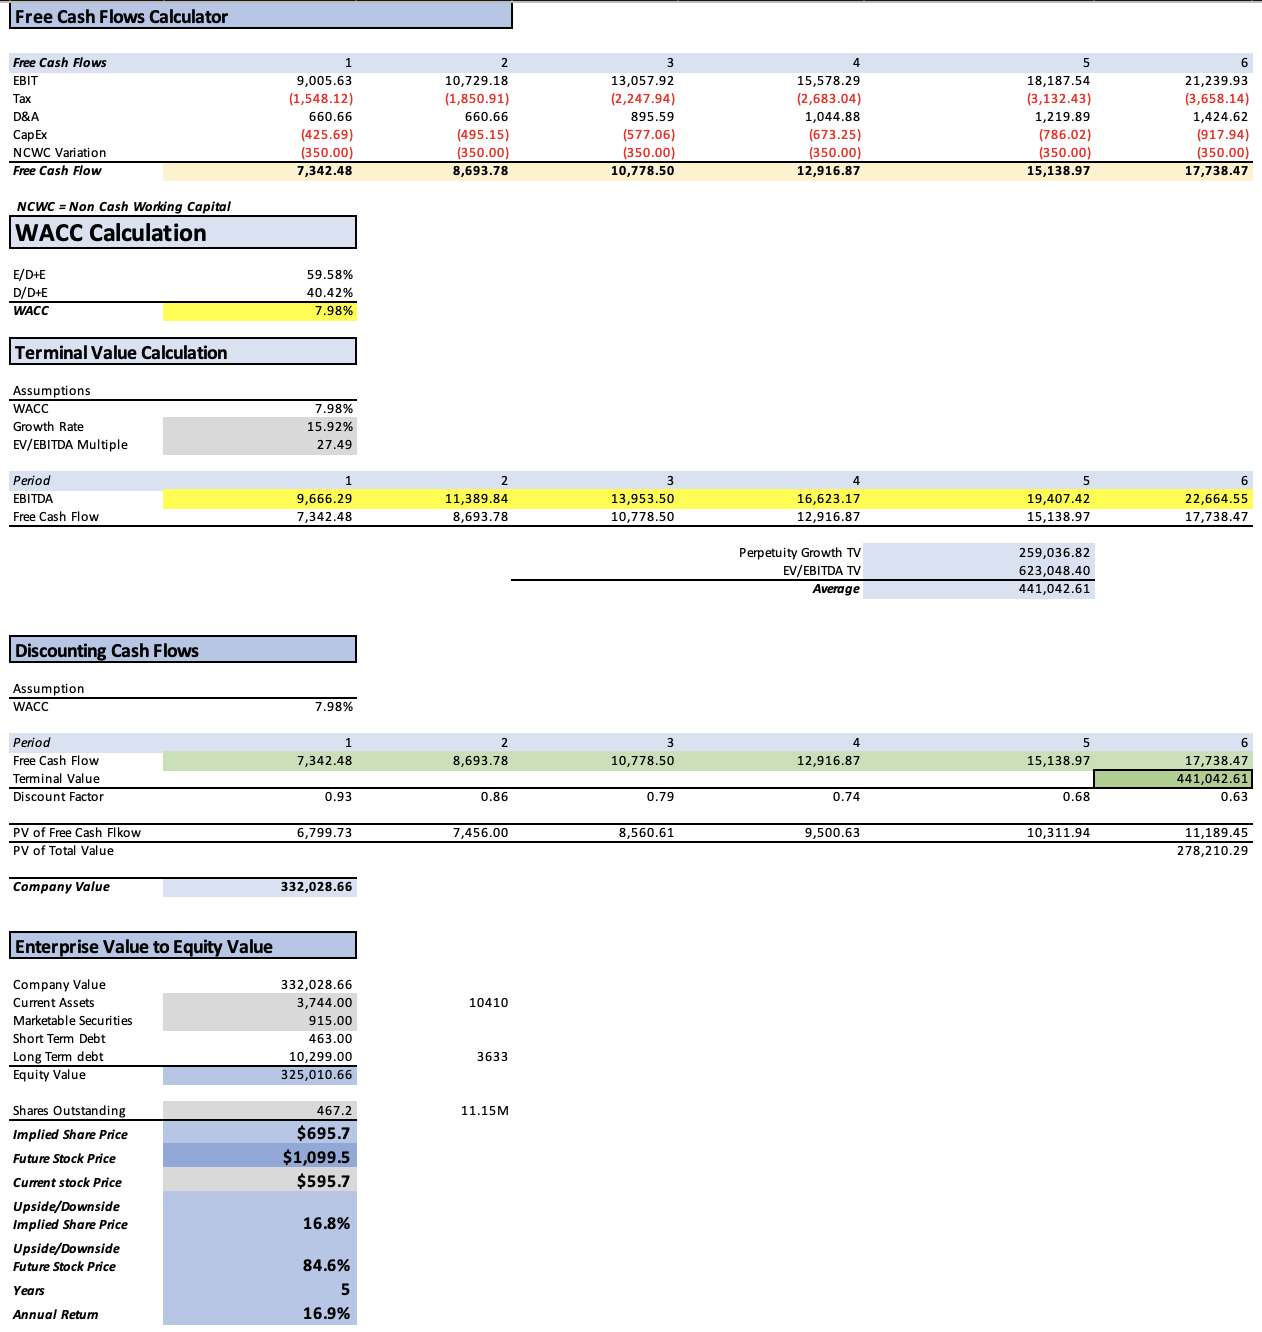
This adjusted scenario significantly improves, with the fair value of the stock now estimated at $695.7, reflecting a 16.8% upside from the current stock price. The model suggests that this combined entity should attain a stock price of $1,099.50 in 2028, signifying an 84.6% upside and translating to annual returns of 16.9%.
So What?
As evident from my models, Adobe no longer presents a significant undervaluation scenario as seen in my two previous articles. The highest potential upside for Adobe stands at 16.8%, and that is contingent on the successful acquisition of Figma.
It’s crucial to recall that the UK’s CMA argues that Figma is a notable competitor to Adobe, making it uncertain whether the deal will go through. Given this uncertainty, it’s prudent not to rely on the deal materializing. Consequently, the potential upside ranges from 1.9% to 4%, indicating that Adobe is already fairly valued. Moreover, with the highest annual return capped at 14.7%, it is advisable to maintain a hold on Adobe. The opportune time to accumulate Adobe shares has unfortunately passed, at least for the time being.
Risks to Thesis
Considering the three models, my neutral thesis appears to carry minimal risk. As evident, the highest potential upside for the stock is limited to 16.8%, positioning it behind other investment opportunities. I hold the view that the downside is currently more plausible than the upside, particularly if Figma’s acquisition is definitively blocked. In such a scenario, emotions might drive the stock down, despite the fair valuation demonstrated by my models.
However, it’s important to note that if the business & productivity SaaS market outpaces the estimated 13%, reaching, for instance, 20%, Adobe’s fair value could surpass what my models suggest. Additionally, the potential impact of Figma’s acquisition on the stock might exceed the 16.8% I am currently proposing.
Lastly, the risk is linked to my valuation models. As mentioned earlier, I assumed that Adobe’s CapEx and interest expenses would continue to grow, presuming that increased revenue would necessitate higher expenditures. Nevertheless, this assumption may not hold true, as debt can remain constant, leading to relatively flat interest expenses. Similarly, software development is not capital-intensive, and once developed, the subsequent costs are primarily profit. Therefore, if Adobe’s financial dynamics deviate from my assumptions, it could also be worth more.
Considering all these factors, I am rating Adobe as a “Hold” and assigning it a target of $607.1, as indicated by the second model labeled “My Estimates.” This implies a 1.9% upside from the current stock price of $595.7.
Conclusion
In conclusion, my comprehensive analysis leads me to advocate for a “Hold” stance on Adobe, supported by a target price of $607.1. Despite the diminished undervaluation potential compared to prior assessments, the current market conditions and uncertainties surrounding Figma’s acquisition suggest that the stock may experience more downside risk than upside potential. The highest projected upside of 16.8%, contingent on the successful acquisition of Figma, places Adobe behind alternative investment opportunities. While there are external factors, such as accelerated growth in the business & productivity SaaS market or a favorable resolution of the Figma deal, that could positively influence Adobe’s trajectory, the prudent strategy at present is to maintain a cautious stance. This “Hold” rating reflects a carefully calculated price target, emphasizing a modest 1.9% upside from the current stock price of $595.7, in alignment with the second model labeled “My Estimates.”
Analyst’s Disclosure: I/we have no stock, option or similar derivative position in any of the companies mentioned, but may initiate a beneficial Long position through a purchase of the stock, or the purchase of call options or similar derivatives in ADBE over the next 72 hours. I wrote this article myself, and it expresses my own opinions. I am not receiving compensation for it (other than from Seeking Alpha). I have no business relationship with any company whose stock is mentioned in this article.
Seeking Alpha’s Disclosure: Past performance is no guarantee of future results. No recommendation or advice is being given as to whether any investment is suitable for a particular investor. Any views or opinions expressed above may not reflect those of Seeking Alpha as a whole. Seeking Alpha is not a licensed securities dealer, broker or US investment adviser or investment bank. Our analysts are third party authors that include both professional investors and individual investors who may not be licensed or certified by any institute or regulatory body.