
Summary:
- Salesforce’s exceptional performance over the past six years, marked by robust revenue growth, operational efficiency, and financial stability, positions it as a standout investment opportunity.
- The second model’s conservative yet optimistic projections, forecasting an 18.4% upside and a substantial 19.4% annual return, align with a target price of $299.10, reinforcing the bullish outlook for Salesforce.
- In conclusion, Salesforce earns a resounding “strong buy” rating, emphasizing its resilience, long-term potential, and strategic positioning in the CRM and related sectors, supported by a compelling target price.
Sundry Photography
Thesis
In this article, I will elucidate the compelling reasons behind considering Salesforce, Inc. (NYSE:CRM) as a favorable investment, even after its notable 28% rally post-October 27, 2023. Based on my estimations, Salesforce’s fair value stands significantly higher, precisely at $299.1. This projection represents an additional 18.4% upside from the current stock price of $252.6. Looking ahead, I anticipate the stock to reach $498 by FY2029 (corresponding to the year 2028), promising an impressive annual return of approximately 18.4%. Given these factors, I unequivocally classify Salesforce as a strong buy.
Overview
Salesforce specializes in developing Software-as-a-Service solutions, distributing them through subscription models, with this segment contributing a substantial 93.26% to the company’s total revenue.
At the core of Salesforce’s offerings is its flagship product, Customer 360-a robust customer relationship cloud software.
FQ3 2024 Salesforce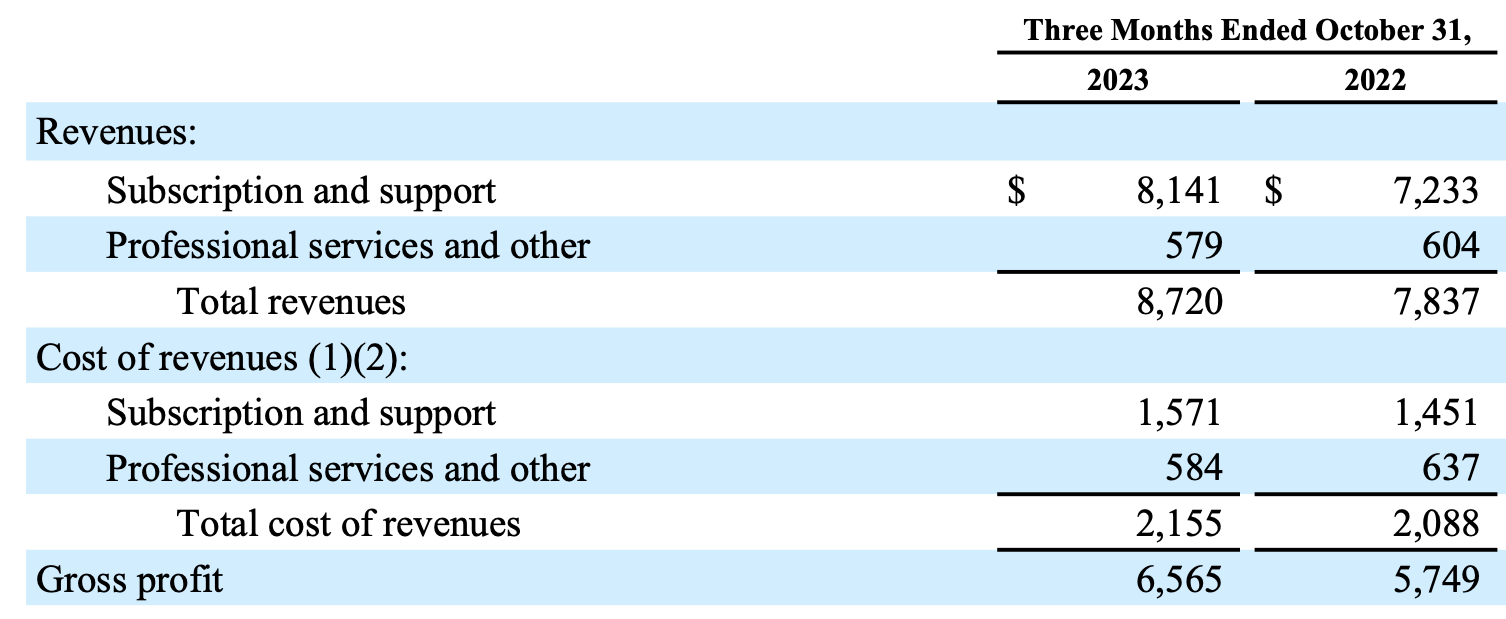
Segments of Customer 360 & Market
FQ3 2024 Salesforce Presentation
Customer Relationship Management Software
Sales
Dedicated to overseeing the entire sales process for companies, the Sales module serves as a centralized hub for data storage, lead monitoring, forecasting, and insights gained through analytics. Moreover, it facilitates the seamless delivery of quotes, contracts, and invoices.
Services
Salesforce’s CRM platform empowers companies to deliver trustworthy and highly personalized customer service. This service fosters a seamless connection between agents and customers across various channels, significantly elevating the overall customer experience.
Platform
Going beyond conventional CRM functionalities, Salesforce’s platform allows users to craft custom business apps tailored to their specific needs. The platform includes Trailhead, a pivotal component offering a complimentary online learning platform for acquiring essential Salesforce skills.
Slack
The integration of Slack with Salesforce establishes connections among customers, employees, partners, and systems across every Salesforce application. This innovative integration enables organizations to establish digital headquarters.
Market Outlook
Salesforce operates in a dynamic market, with the CRM industry anticipated to grow at a robust rate of 10.68% through 2028, extending into Salesforce’s Fiscal Year 2029. This growth underscores the escalating significance of CRM solutions, with Salesforce leading the way by providing innovative and comprehensive services through its Customer 360.
Author’s Calculations based on Statista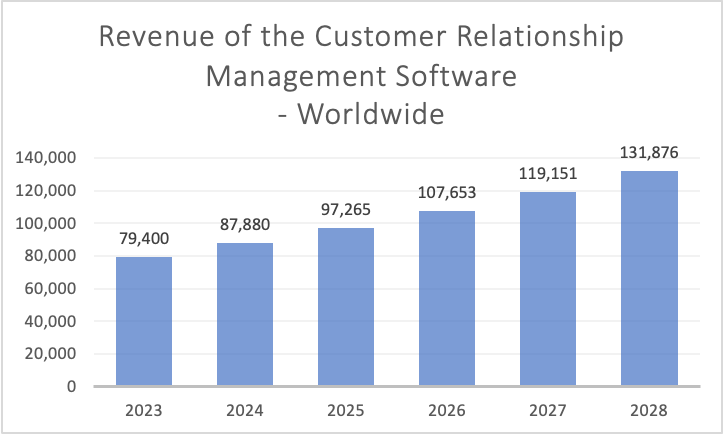
Marketing and Commerce
Marketing
This facet empowers companies to strategize direct-to-customer marketing initiatives encompassing interactions through email, social networks, web platforms, and connected products. The integration of customer data with Salesforce’s Sales and Service offerings ensures a cohesive and comprehensive approach.
Commerce
The Commerce module unifies the shopping experience across various points of commerce. Additionally, it provides click-to-code tools, affording businesses the flexibility to choose how they build and deploy solutions offered by Salesforce.
Market Outlook
The eCommerce software market is poised for significant growth, with an anticipated annual revenue increase of 4.61% throughout 2028. This projection underlines the sustained momentum and opportunities within the eCommerce sector.
Author’s Calculations based on Statista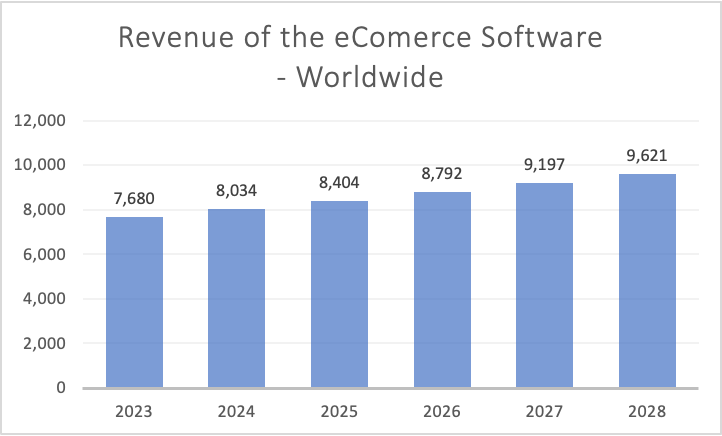
Data Analytics
Tableau
Tableau offers businesses advanced AI models, providing timely recommendations, identifying trends, and predicting outcomes by analyzing diverse datasets.
Integration
MuleSoft serves as a solution facilitating seamless connections between data from any system, enhancing the interoperability of diverse platforms.
Customer Data Cloud
Genie Customer Data Cloud is a hyper-scale real-time data platform that powers the entire Customer 360 platform. It effectively aggregates data from every channel, ensuring a comprehensive and up-to-date view of customer information.
Market Outlook
The data analytics market is on the brink of significant expansion, with an anticipated CAGR of 18.77% from 2023 to 2029. This growth trajectory positions the market to reach a remarkable valuation of $655.53 billion. Such robust growth underscores the increasing importance of data analytics in shaping strategic decision-making processes across various industries.
Statista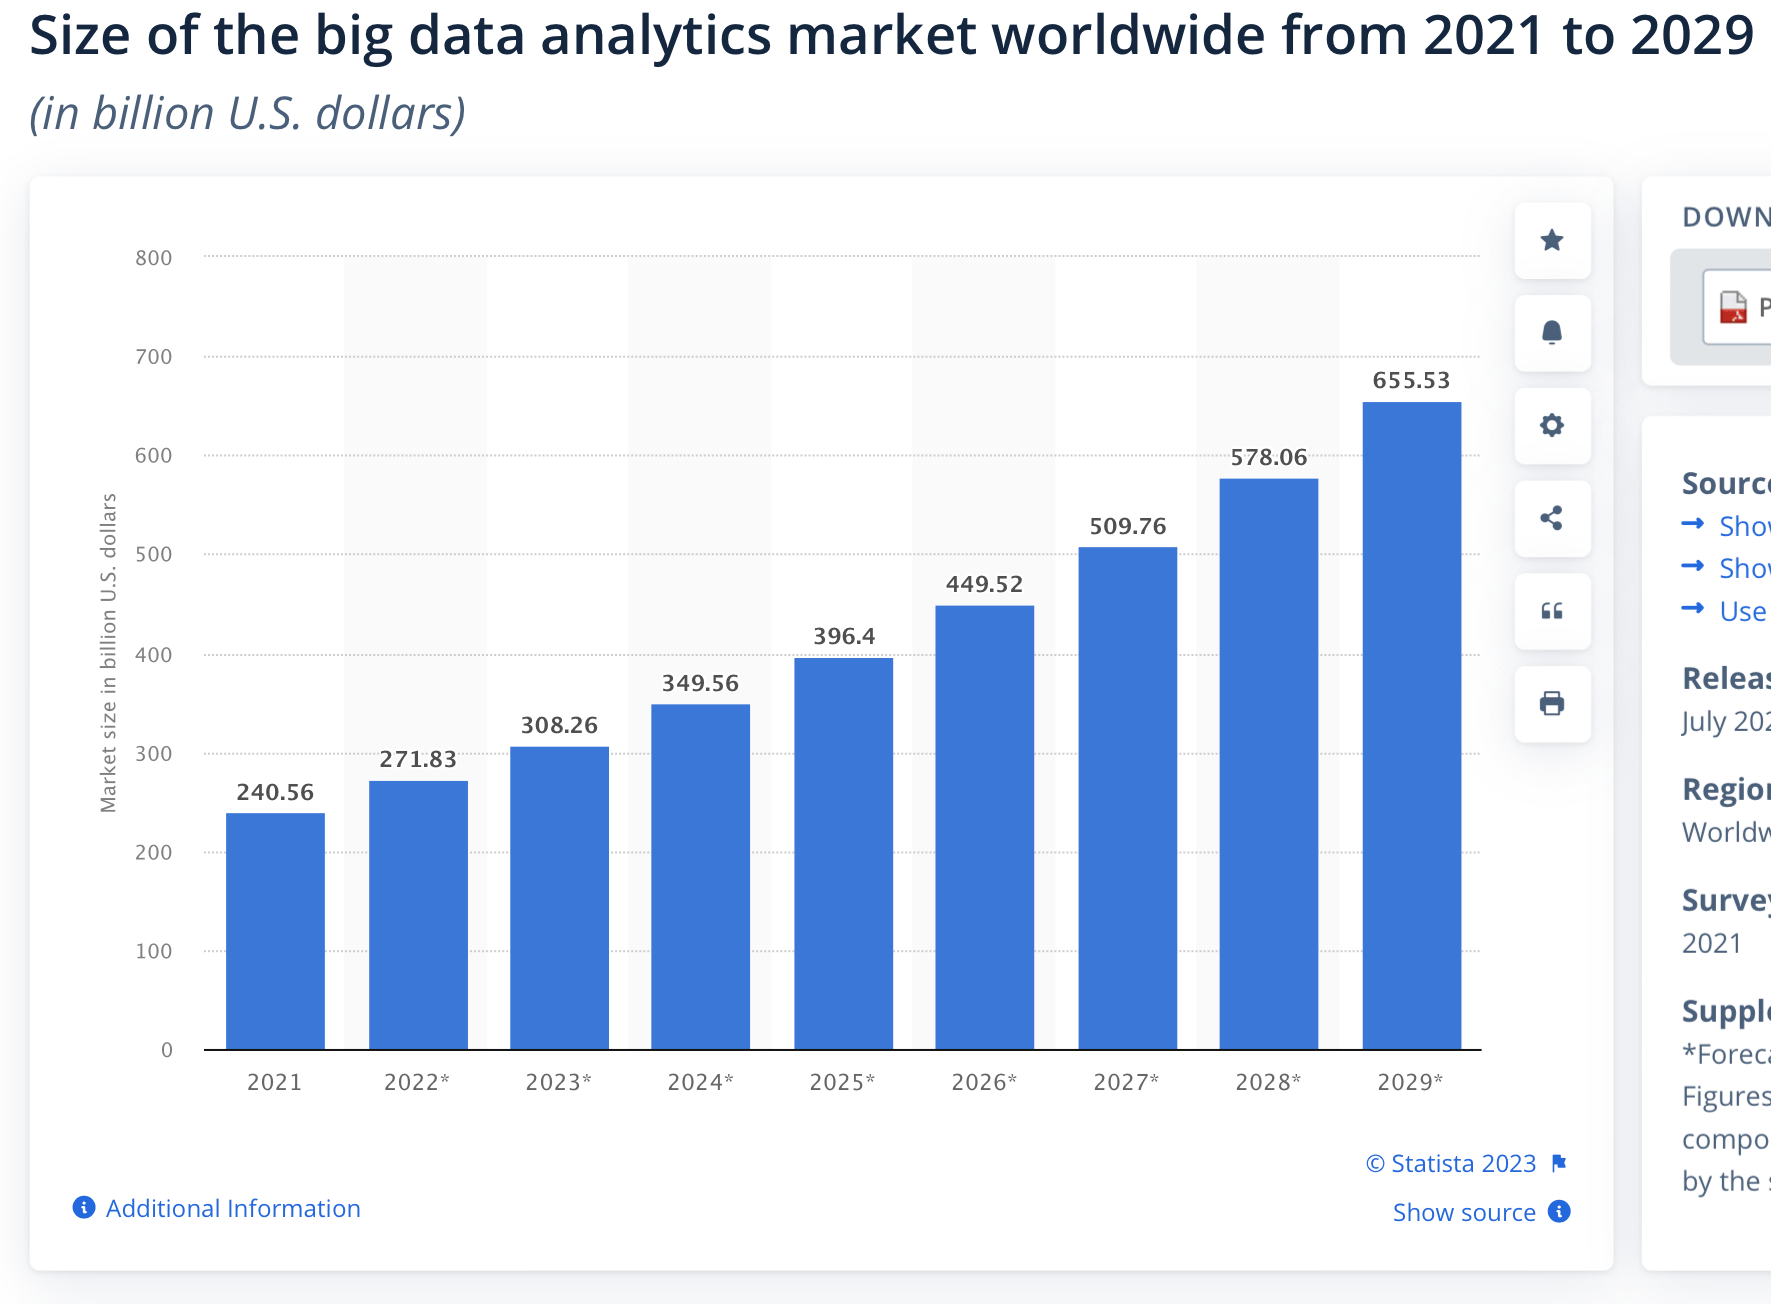
Financials
Over the past six years, Salesforce has consistently demonstrated impressive financial growth. Annually, the company has achieved a remarkable 37.02% increase in revenue, a substantial 178% surge in operating income, and a notable 103% rise in net income.
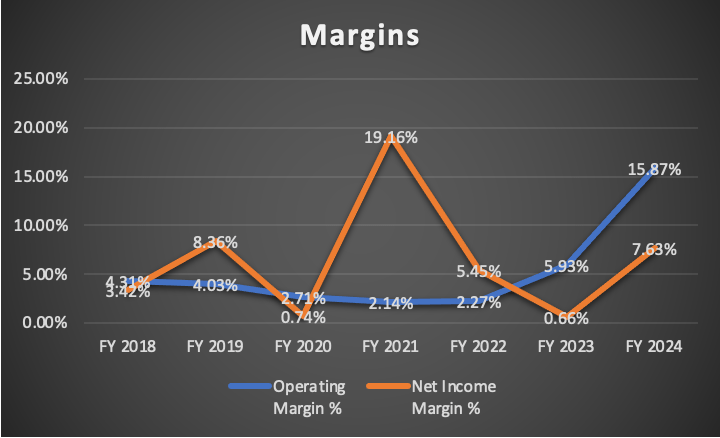
Examining the operating margin reveals Salesforce’s evolution into a more efficient business entity. Commencing at the start of FY2018 (equivalent to the year 2017), Salesforce boasted an operating margin of 4.31%. Fast forward to FY2024, and this metric has surged to an impressive 15.87%.
On the flip side, the net income margin has followed a different trajectory. As a growth-oriented company, Salesforce has the flexibility to allocate resources, whether for development or other purposes. The pinnacle of Salesforce’s net income margin occurred in FY2021, reaching a substantial 19.16%. However, since then, the net income margin has receded, currently standing at 7.63%, with a previous dip to an all-time low of 0.66%.
Author’s Calculations Author’s Calculations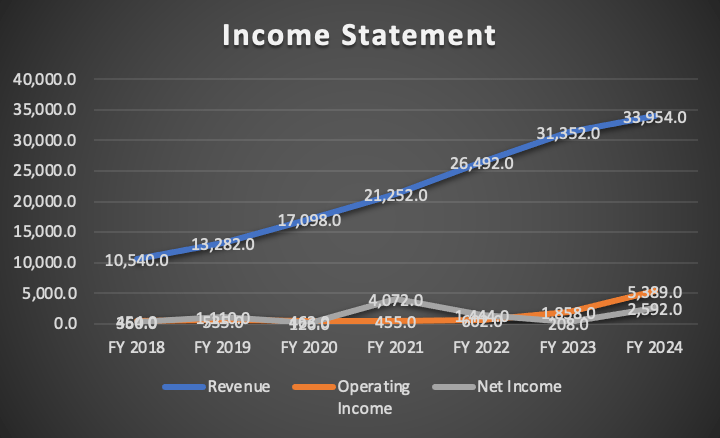
Notably, Salesforce’s balance sheet remains in excellent condition. By assessing the ratio of total debt ($13.79B) to cash reserves ($11.8B), the resulting figure of 1.16 indicates that total debt is only slightly higher than the total cash reserve.
Further bolstering this financial robustness is the assessment of free cash flow. With a ratio of 1.65 when comparing free cash flow to total debt, Salesforce demonstrates its capability to settle its entire debt in approximately a year and a half, or less than two years, without tapping into its cash reserves.
Author’s Calculations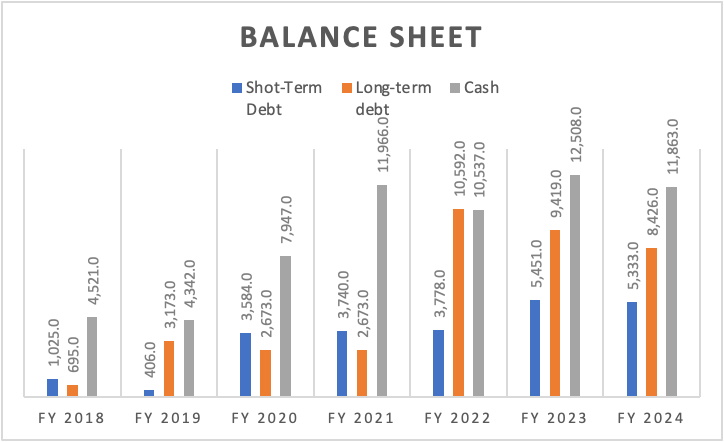
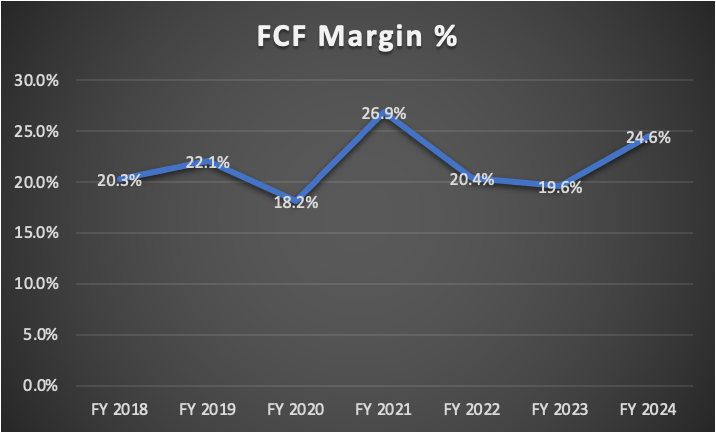
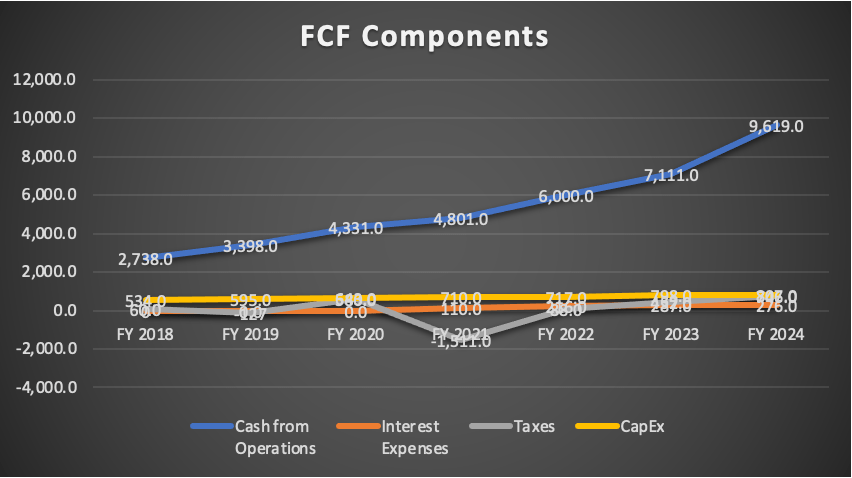
Lastly, focusing on Salesforce’s free cash flow, it has experienced an impressive annual growth rate of 48%. The current free cash flow of $8.34B, when considered in relation to revenue, yields a free cash flow margin of 24.6%, slightly below the peak achieved in FY2021 at 26.9%.
Author’s Calculations Author’s Calculations Author’s Calculations
Valuation
In this valuation analysis, I will employ two DCF models to evaluate Salesforce’s intrinsic value. The first model incorporates Analysts’ estimates for revenue and EPS in FY2024 and FY2025, in addition to forward revenue growth and the 3 to 5-year long-term EPS growth rate. The second DCF model is anchored in the projected market growth for each of Salesforce’s segments.
The provided table encompasses all current data pertinent to Comcast. Using this data, I will calculate the Weighted Average Cost of Capital (WACC), factoring in Equity value, Debt value, and Cost of debt. Additionally, Depreciation and Amortization (D&A), Interest, and CapEx will be derived based on margins tied to revenue growth. This methodology ensures that as Salesforce’s revenue expands, these expenses will also increase, providing a more realistic and logical projection.
| TABLE OF ASSUMPTIONS | |
| (Current data) | |
| Assumptions Part 1 | |
| Equity Value | 58,090.00 |
| Debt Value | 13,759.00 |
| Cost of Debt | 2.01% |
| Tax Rate | 22.35% |
| 10y Treasury | 4.14% |
| Beta | 1.21 |
| Market Return | 10.50% |
| Cost of Equity | 11.84% |
| Assumptions Part 2 | |
| CapEx | 807.00 |
| Capex Margin | 2.38% |
| Net Income | 2,592.00 |
| Interest | 276.00 |
| Tax | 746.00 |
| D&A | 2,127.00 |
| EBITDA | 5,741.00 |
| D&A Margin | 6.26% |
| Interest Expense Margin | 0.81% |
| Revenue | 33,954.0 |
Analysts’ Estimates
For the initial model, I will assess Salesforce’s valuation based on current analysts’ estimates for revenue and EPS, as well as incorporate the anticipated forward revenue growth and the 3-5-year long-term EPS growth.
Presently, analysts’ estimates project Salesforce’s revenues to reach $34.8B for FY2024 and $38.56B for FY2025.
Revenue Estimates (Seeking Alpha)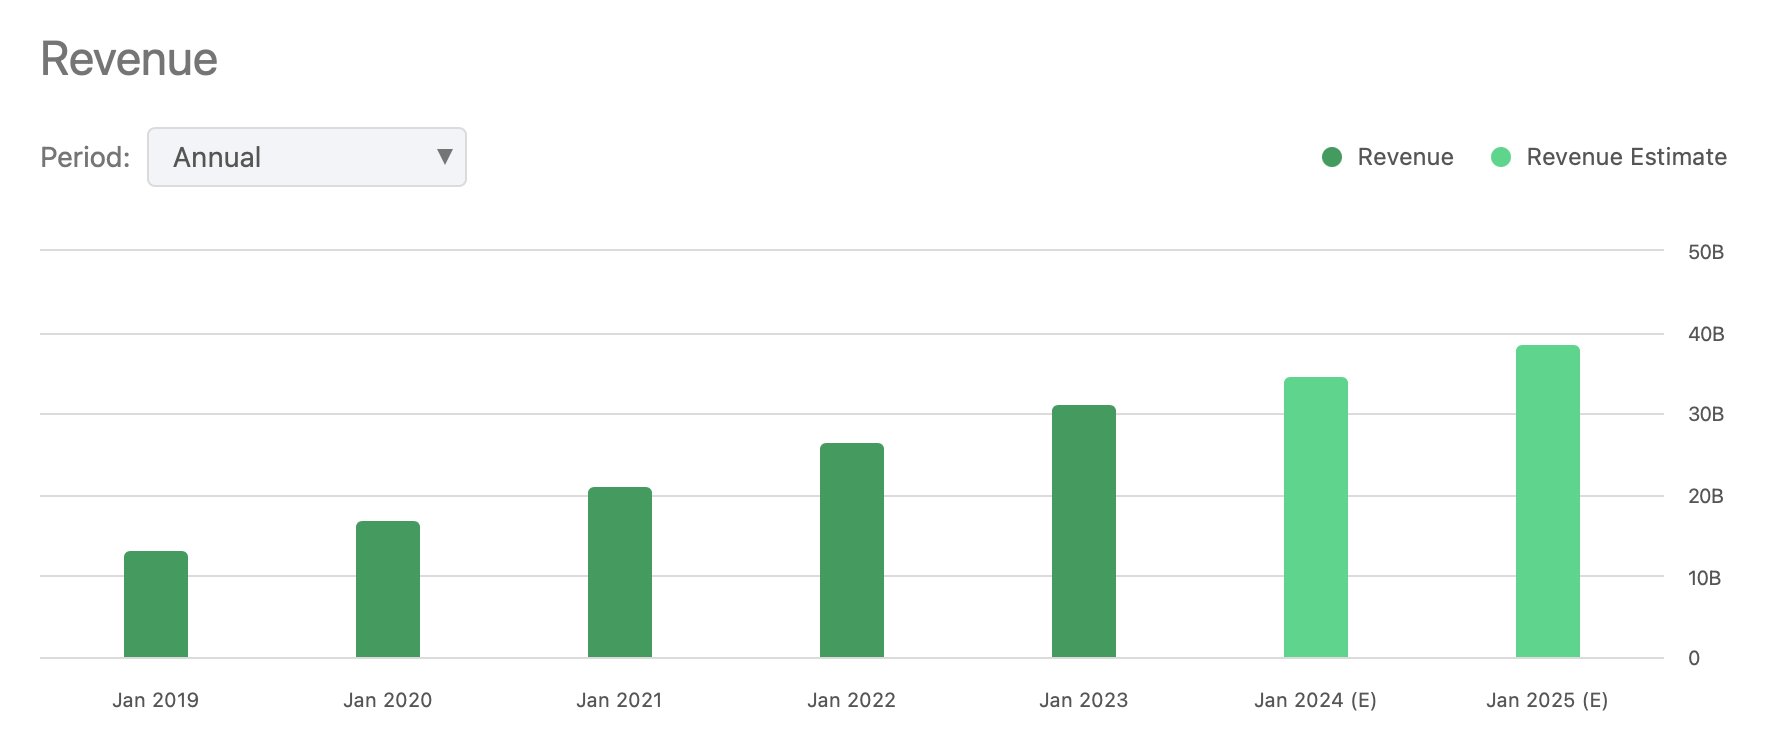
In terms of EPS, analysts anticipate $8.19 for FY2024 and $9.51 for FY2025, corresponding to net incomes of $7.9B and $9.2B, respectively.
EPS Estimates (Seeking Alpha)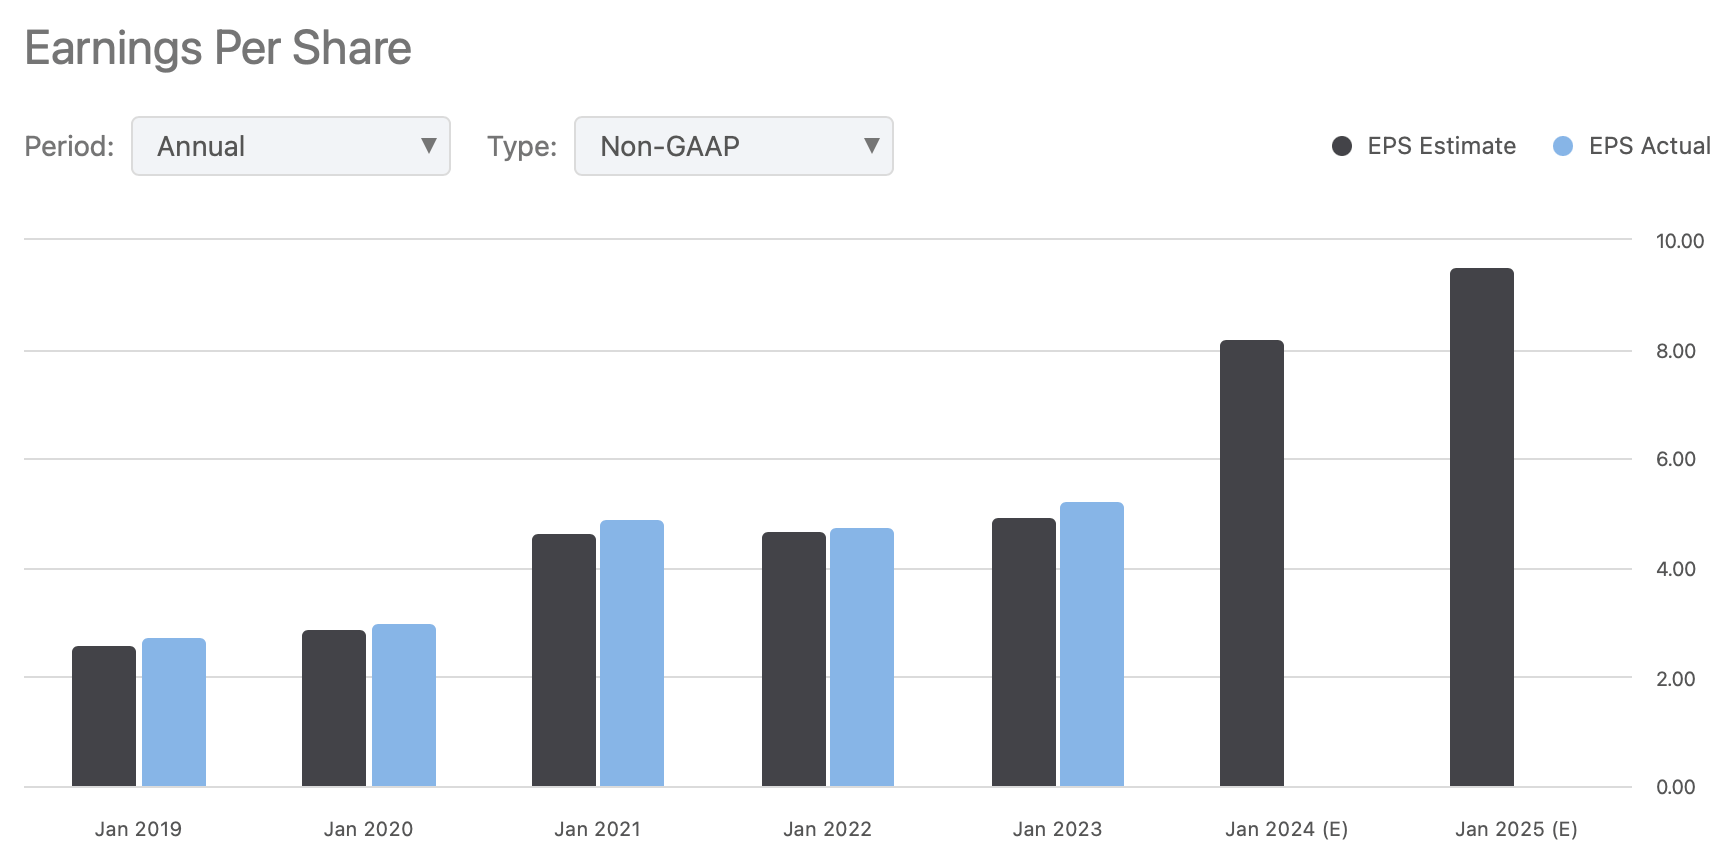
Additionally, analysts project a forward revenue growth rate of 13.32%, and for the long-term EPS growth, an expectation of 24.71%. As depicted in the table below, these figures surpass the sector median.
Seeking Alpha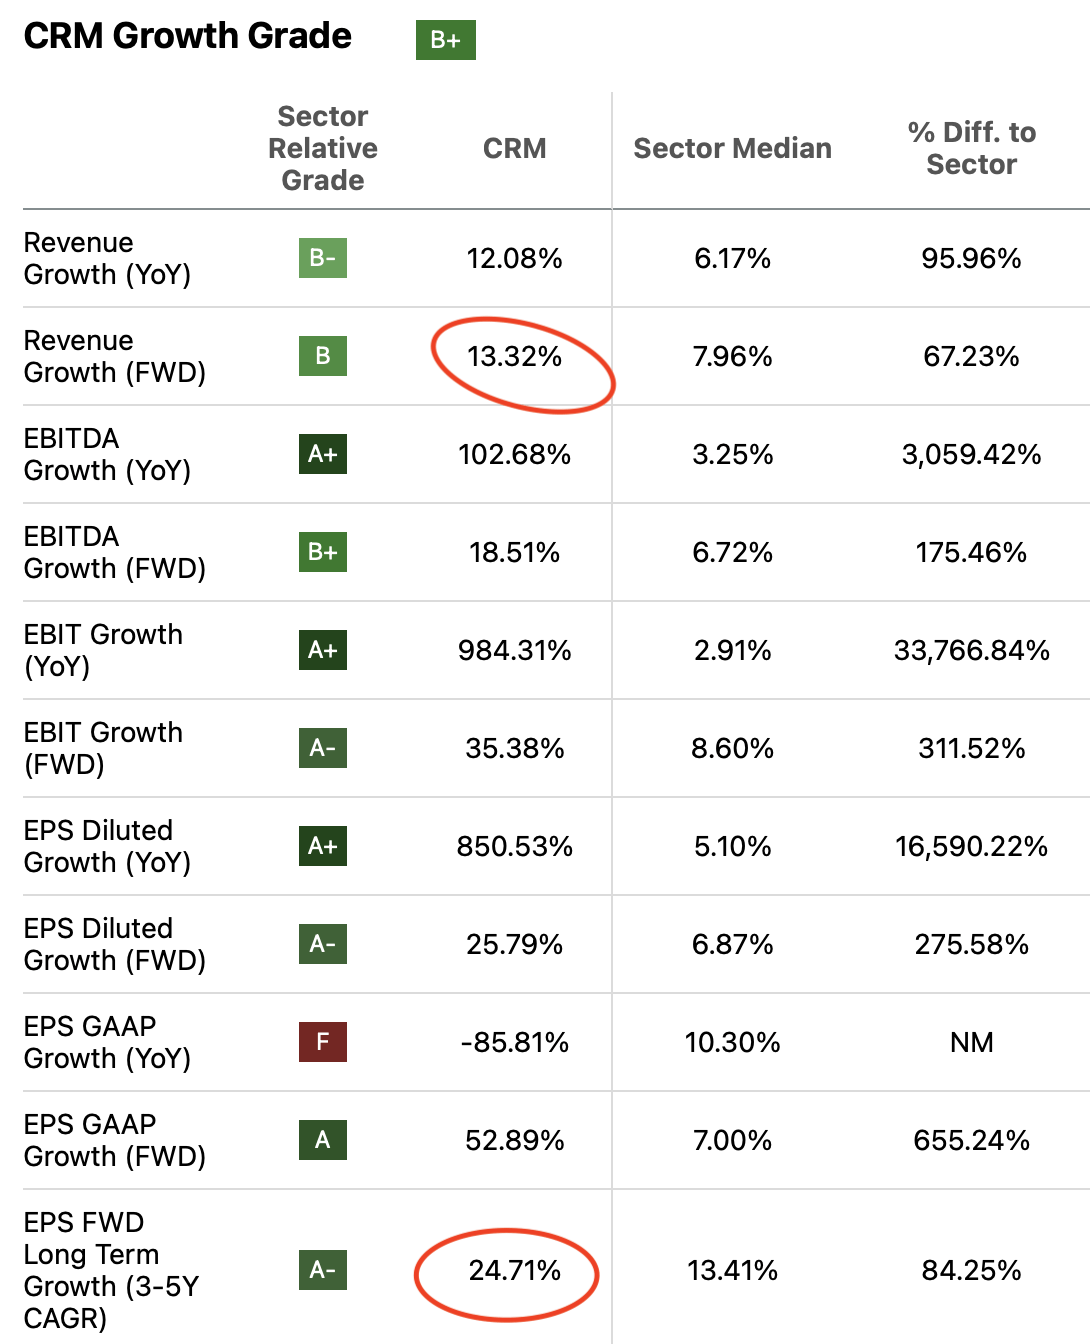
| Analysts’ Estimates | Revenue | Net Income | Plus Taxes | Plus D&A | Plus Interest |
| FY 2024 | $34,800.0 | $7,936.11 | $9,709.73 | $11,889.72 | $12,172.60 |
| FY 2025 | $38,550.0 | $9,215.19 | $11,274.67 | $13,454.66 | $13,737.54 |
| FY 2026 | $43,684.9 | $11,492.26 | $14,060.64 | $16,797.21 | $17,152.31 |
| FY 2027 | $49,503.7 | $14,332.00 | $17,535.02 | $20,636.11 | $21,038.51 |
| FY 2028 | $56,097.6 | $17,873.44 | $21,867.92 | $25,382.08 | $25,838.07 |
| FY 2029 | $63,569.8 | $22,289.97 | $27,271.49 | $31,253.72 | $31,770.46 |
| ^Final EBITA^ |
Author’s Calculations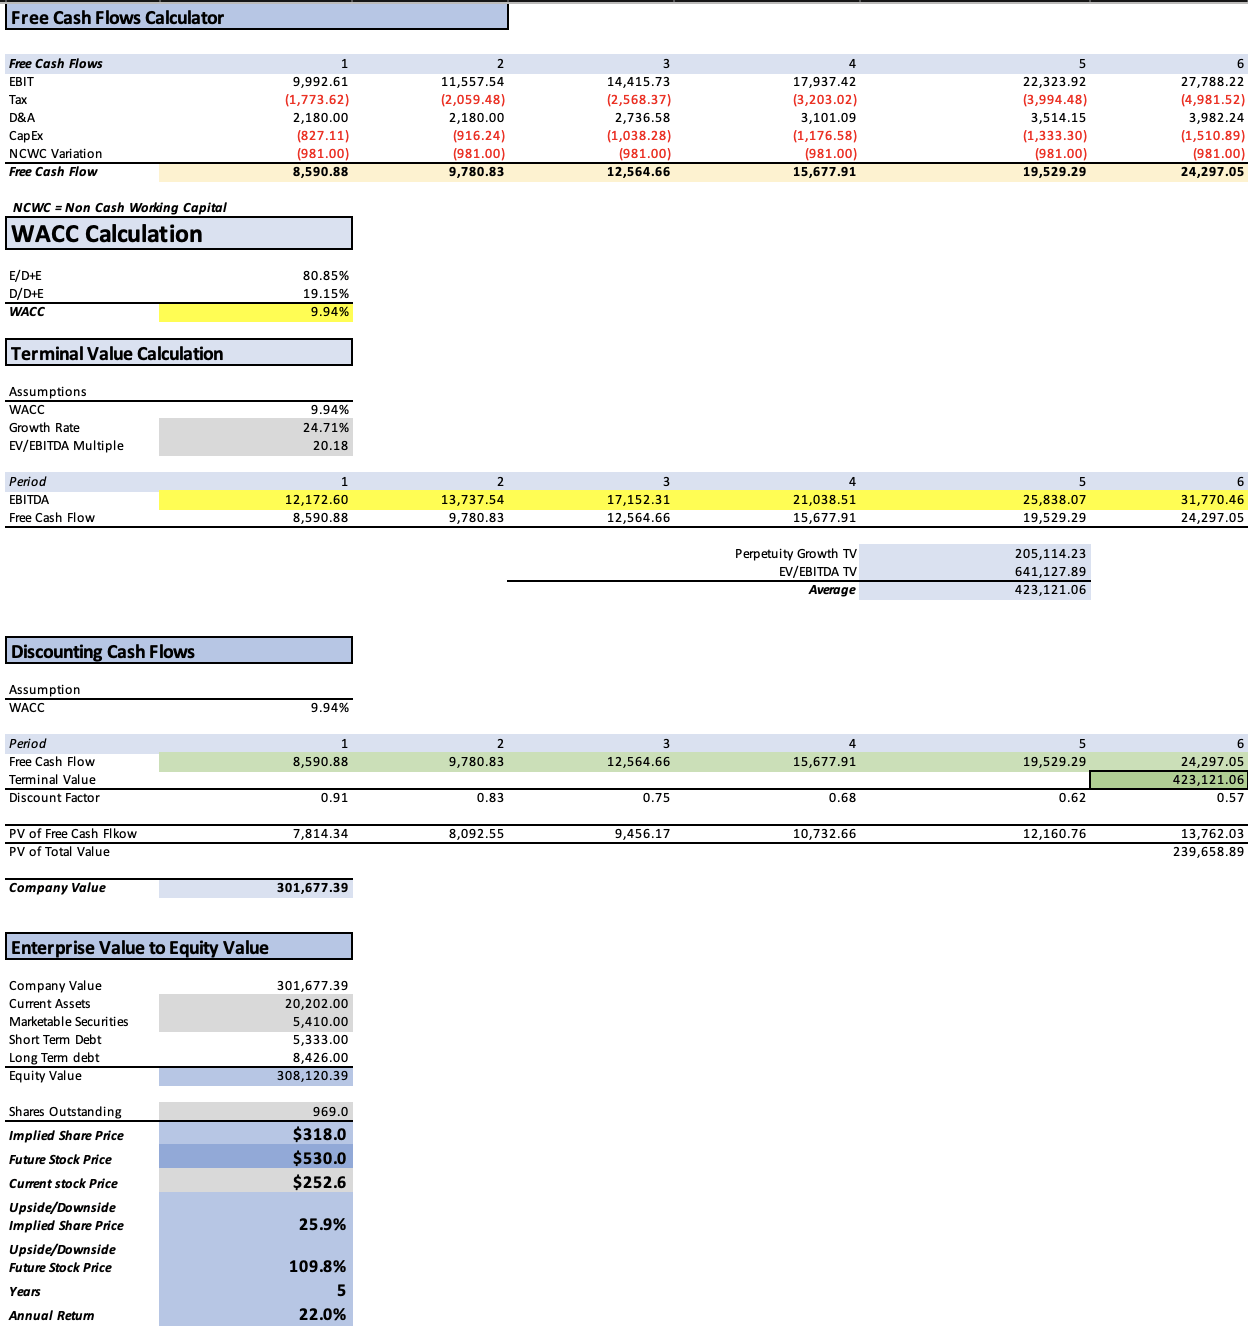
In examining the first model, it becomes evident that it generates a current fair value estimate of $318, signifying a substantial 25.9% upside from the existing stock price of $252.6. Beyond the immediate forecast, the model paints a compelling picture for the future, projecting a price of $530 by FY2029. This forward-looking estimate implies a noteworthy 22% annual return, highlighting the model’s optimism regarding the stock’s future performance.
My Estimates
In delving into the intricacies of the second model, the approach centers on predicting potential revenue outcomes for each of Salesforce’s segments. Leveraging the anticipated market growth rates discussed in the overview section, specifically the CRM market at 10.68%, marketing and commerce at 4.61%, and data analytics at 18.77%, the model crafts a comprehensive projection.
| Customer Relations Management | Marketing & Commerce | Data Analytics | |
| FY 2024 | 11,318.0 | 11,318.0 | 11,318.0 |
| FY 2025 | 12,526.8 | 11,839.8 | 13,442.4 |
| FY 2026 | 13,864.6 | 12,385.6 | 15,965.5 |
| FY 2027 | 15,345.4 | 12,956.5 | 18,962.3 |
| FY 2028 | 16,984.2 | 13,553.8 | 22,521.5 |
| FY 2029 | 18,798.2 | 14,178.7 | 26,748.7 |
For net income, the model relies on analysts’ estimates derived from the previous DCF analysis. Analysts expect a net income margin of 35.1% in FY2029, a figure deemed realistic when benchmarked against comparable companies such as Taiwan Semiconductor Manufacturing Company Limited (TSM) with a net income margin of 43.33%, and Microsoft Corporation (MSFT) at 34.15%. The only adjustment made is to the FY2024 margin, reduced to 19.16%, as highlighted in the financials section as the all-time high in net income margin during FY2021.
|
Analysts’ net income margin estimates |
Net income Margin |
| FY 2024 | 22.8% |
| FY 2025 | 23.9% |
| FY 2026 | 26.3% |
| FY 2027 | 29.0% |
| FY 2028 | 31.9% |
| FY 2029 | 35.1% |
Notably, the model maintains a conservative stance on EBITDA estimates, consistently trailing below analysts’ expectations.
| My Estimates | Revenue | Net Income | Plus Taxes | Plus D&A | Plus Interest |
| FY 2024 | $33,954.0 | $6,505.59 | $7,959.50 | $10,086.50 | $10,362.50 |
| FY 2025 | $37,808.9 | $9,036.33 | $11,055.83 | $13,182.83 | $13,458.83 |
| FY 2026 | $42,215.7 | $11,102.73 | $13,584.05 | $16,228.60 | $16,571.75 |
| FY 2027 | $47,264.2 | $13,706.61 | $16,769.86 | $19,730.65 | $20,114.85 |
| FY 2028 | $53,059.6 | $16,926.00 | $20,708.74 | $24,032.58 | $24,463.89 |
| FY 2029 | $59,725.6 | $20,963.68 | $25,648.79 | $29,390.22 | $29,875.71 |
| ^Final EBITA^ |
| Analysts’ Estimates | Revenue | Net Income | Plus Taxes | Plus D&A | Plus Interest |
| FY 2024 | $34,800.0 | $7,936.11 | $9,709.73 | $11,889.72 | $12,172.60 |
| FY 2025 | $38,550.0 | $9,215.19 | $11,274.67 | $13,454.66 | $13,737.54 |
| FY 2026 | $43,684.9 | $11,492.26 | $14,060.64 | $16,797.21 | $17,152.31 |
| FY 2027 | $49,503.7 | $14,332.00 | $17,535.02 | $20,636.11 | $21,038.51 |
| FY 2028 | $56,097.6 | $17,873.44 | $21,867.92 | $25,382.08 | $25,838.07 |
| FY 2029 | $63,569.8 | $22,289.97 | $27,271.49 | $31,253.72 | $31,770.46 |
| ^Final EBITA^ |
Author’s Calculations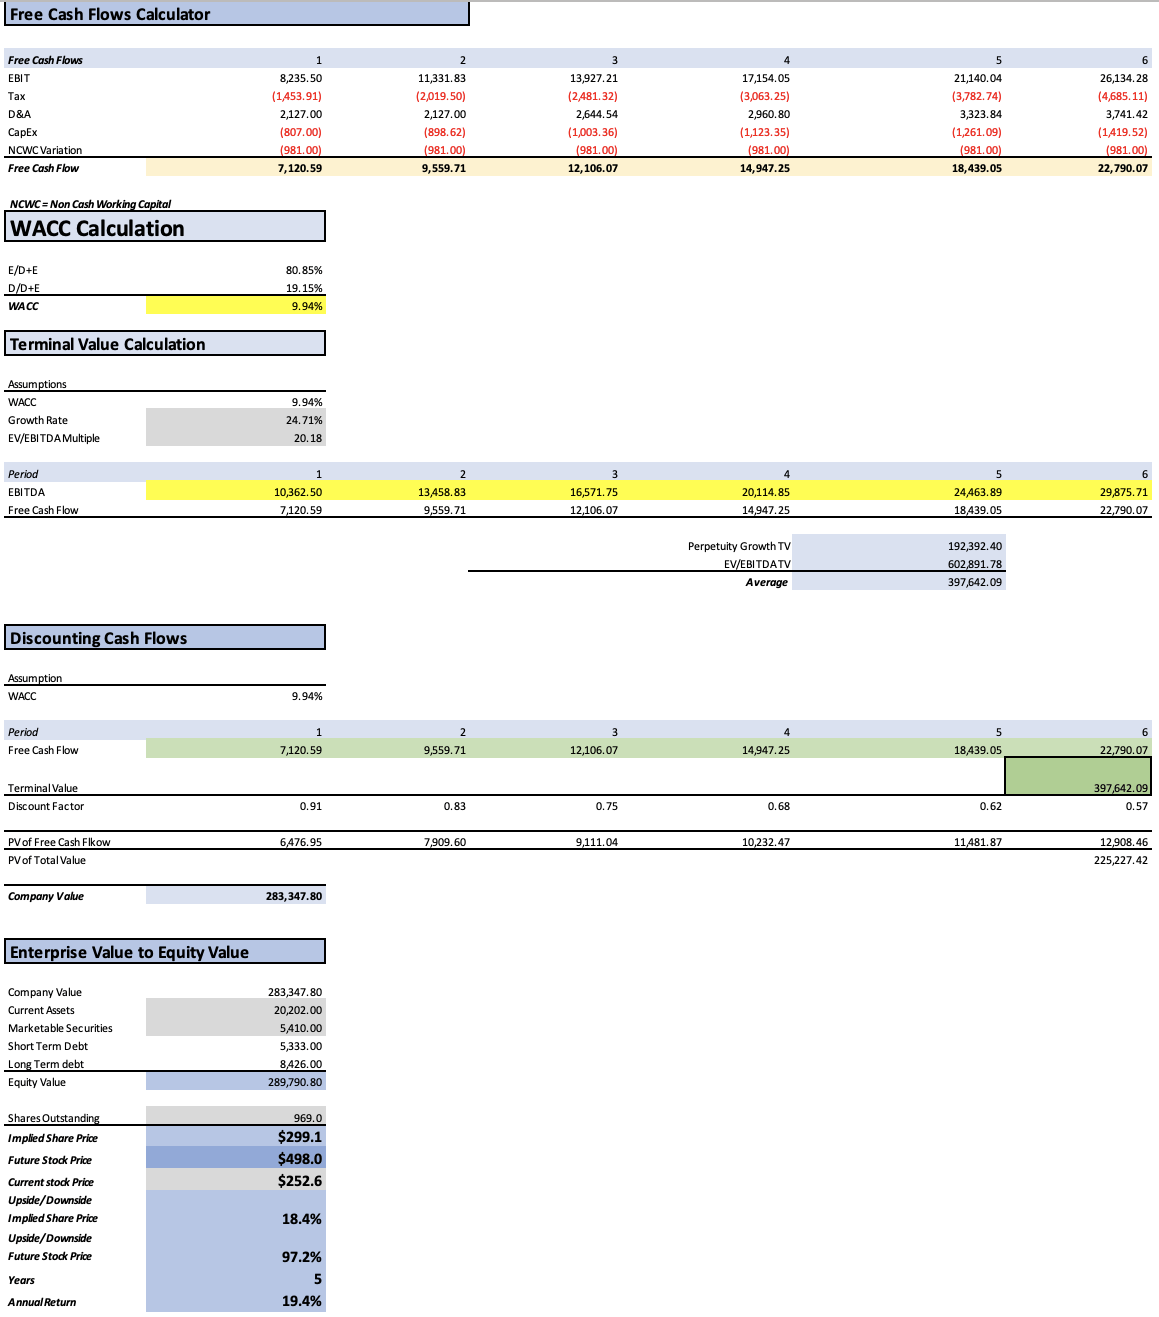
Upon thorough analysis, the second model proposes a fair price of $299.10, reflecting an 18.4% upside from the current stock price. Looking ahead to FY2029, the model suggests a stock price of $498, translating into an annual return of 19.4%. This forecast emphasizes the model’s inclination towards a prudent and measured projection, aligning with more conservative revenue and EBITDA estimates.
Risks to Thesis
The primary risk to this bullish thesis centers on the net income margin. As highlighted in the financials section, Salesforce retains the discretion to augment or curtail cyclical expenses at their discretion. This pivotal decision inevitably influences valuation, given that net income constitutes a crucial component of EBIT, the metric employed in the DCF model.
Another significant concern is the specter of competition. The landscape is susceptible to other companies launching their own CRM software, directly competing with Salesforce. In such a scenario, Salesforce would need to assertively demonstrate the superiority of its software. Nevertheless, Salesforce has strategically cultivated a network effect around its Customer 360 offering, integrating a multitude of tools that seamlessly connect. This cohesion makes opting for Customer 360 more pragmatic than navigating multiple disparate software solutions.
Lastly, a potential risk involves the prospect of a deceleration in the CRM, eCommerce software, and data analytics markets. Such a downturn would inevitably dampen both analysts’ expectations and those projections based on the estimated growth rates. This underscores the importance of vigilance in monitoring market dynamics, as a slowdown could impact the overall trajectory and expectations within these key sectors.
Conclusion
In conclusion, Salesforce emerges as a robust investment opportunity, underscored by its exceptional performance and strategic positioning in the dynamic landscape of customer relationship management and related sectors. The comprehensive analysis presented reveals an impressive track record of revenue growth, operational efficiency, and financial stability over the past six years. The company’s adept navigation through market trends, evident in its consistent 37.02% annual revenue growth and substantial improvements in operating income and net income, positions it as a stalwart player in the industry.
Of particular note is the commendable foresight showcased in Salesforce’s diversified product offerings, including the Customer 360 platform. The second model’s insightful projection, factoring in conservative estimates for revenue and EBITDA, fortifies the bullish outlook. With a fair price of $299.10 and an encouraging 18.4% upside from the current stock price, combined with the projected FY2029 price of $498 implying a substantial 19.4% annual return, the second model underscores the resilience and long-term potential that contribute to a resounding “strong buy” rating for Salesforce.
Analyst’s Disclosure: I/we have no stock, option or similar derivative position in any of the companies mentioned, but may initiate a beneficial Long position through a purchase of the stock, or the purchase of call options or similar derivatives in CRM over the next 72 hours. I wrote this article myself, and it expresses my own opinions. I am not receiving compensation for it (other than from Seeking Alpha). I have no business relationship with any company whose stock is mentioned in this article.
Seeking Alpha’s Disclosure: Past performance is no guarantee of future results. No recommendation or advice is being given as to whether any investment is suitable for a particular investor. Any views or opinions expressed above may not reflect those of Seeking Alpha as a whole. Seeking Alpha is not a licensed securities dealer, broker or US investment adviser or investment bank. Our analysts are third party authors that include both professional investors and individual investors who may not be licensed or certified by any institute or regulatory body.