Summary:
- Agilent has reshuffled its portfolio and increased economic returns, but growth is expected to be sluggish, and the upside may be limited.
- The company provides life sciences, diagnostics, and applied chemicals products to various industries.
- Agilent is a quality company and has demonstrated strong financial performance, improving margins, and efficiency, but its valuation suggests limited upside potential.
- We initiate with a hold rating.
Monty Rakusen
We initiate Agilent (NYSE:A) with a hold rating. The company has managed to reshuffle its portfolio and significantly increase its economic returns over the past decade. Revenue per share has also grown at a respectable 7.5% CAGR since the spinoff of Keysight Technologies and the disposal of its nuclear magnetic resonance business in 2014. However, with growth expected to be sluggish going forward, and a high FY24 PE of 27x, we believe the upside may be limited.
The company has all the traits of a quality company, with improving operating efficiency, increasing margins, a strong balance sheet, stable and improving earnings, and has demonstrated good growth. We have simulated some valuation scenarios and concluded that the company is currently fairly valued.
The Company
Agilent provides life sciences, diagnostics, and applied chemicals products to pharma, chemicals and advanced materials makers, food makers, and others. The product range includes instruments, consumables for laboratory-related work, software, and services.
Revenue Breakdown (Agilent Technologies)
The life sciences and applied market group (LSAG) contributes 56% of revenues, with the other two roughly evenly split. The Americas is Agilent’s largest market, generating 40% of its revenues, Europe 26%, and Asia Pacific 34%. With 60% of revenues from exports, short-term foreign exchange risk exists. We think this can only be transitory, can go both ways and will not affect the long-term prospects.
To concentrate on key markets in communications, electronics, and life sciences, Agilent became an independent entity after its spin-off from Hewlett-Packard in 2000. In 2014, Agilent completed the spinoff of Keysight Technologies, its electronic measurement business, Keysight Technologies (NYSE: KEYS).
Financials
Revenues were down 5.6% in the first quarter ending 31 January 2024 compared to the same period last year. At $1.66bn, these were higher than the consensus of $1.6bn. Non-GAAP EPS also came in at $1.29, 6% lower than the same period last year. This was however higher than the consensus of $1.22.
The Agilent team continued its strong execution in the first quarter, delivering better-than-expected revenue and earnings,” said President and CEO Mike McMullen. “We are well positioned for long-term growth driven by our diversified business and multiple growth drivers. While near term market challenges remain, I continue to be optimistic about our future.
Post-pandemic, many companies within this sector saw revenues increase due to pent-up demand. Once this demand was met, revenue growth stalled or declined. The macroeconomic environment also became challenging, and most businesses were cautious and unwilling to spend until they had more clarity. Apart from CrossLab, and its lab-related portfolio, revenues fell across the board, with all segments and geographies being affected. Revenues in China saw the largest drop, where weakness still exists. Looking forward, the company continues to be innovative, introduce new and differentiated products to target a larger patient population and explore untapped markets. One such product line is its new ProteoAnalyzer system introduced this quarter. It aims to improve and simplify the analysis of complex protein mixtures. This platform can be applied across the pharma, biotech, food analysis, and academia sectors. Given the current headwinds, Agilent’s better-than-expected quarterly results and its approach to investing in growth areas put it in a strong position.
They were ranked in the top 5 in the Barron’s list of 100 most sustainable companies and are included in the Dow Jones Sustainability Index.
Historical Financial Performance
Since the Keysight spin-off, Agilent has increased revenues while also improving margins and efficiency. This is a recipe for value creation, as long as this is not fueled by unmanageable debt. This does not seem to be the case as debt to EBITDA has actually gone down from 2015’s 1.7x to 1.4x, and interest coverage is more healthy than 2015’s 11.6x with 2023’s interest coverage at 19.1x.
Agilent Revenue Per Share (ROCGA Research)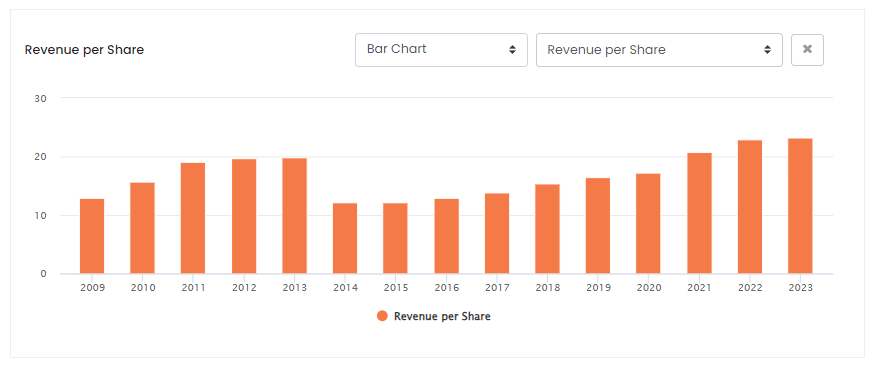
We can see a clear trend in revenue per share increase from 2014’s $12.2 per share to $23.2 in 2023. Over this period, the company has also reduced its shares outstanding from 333m to 293m, returned approximately $5.2bn to shareholders via share buybacks, and an additional $2.0bn as dividend payouts.
EBITDA Margins (ROCGA Research)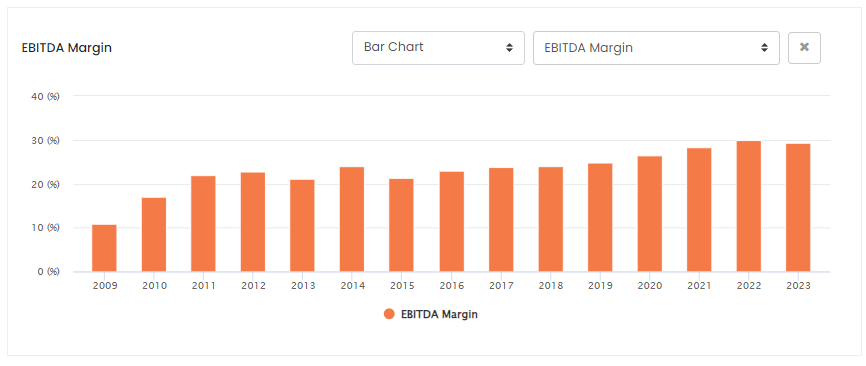
Margins have also been improving year-on-year.
Gross Asset Turnover ( ROCGA Research)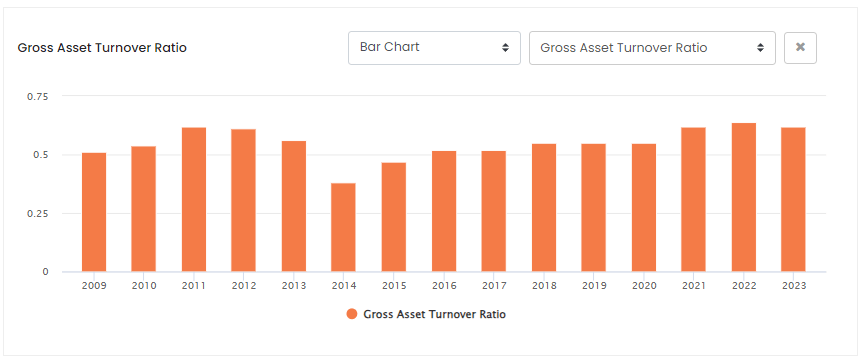
We are using asset turnover to measure efficiency. Asset turnover is the ratio of assets required to generate revenues. Higher ratios indicate that fewer assets were used to generate more revenues.
Returns On Cash Generating Assets Valuation Method
Before we can proceed further, below, we provide a quick introduction to ROCGA, our measure of returns, and the models we use to value companies. If you have read any of our previous articles or are familiar with cash-flow-returns-on-investments, you can skip the section below.
We use a discounted cash flow model based on Cash Flow Returns on Investments. More information on calculating cash flow returns on investment, gross cash, and gross assets can be found in Bartley Madden’s paper “The CFROI Life Cycle“. Bartley Madden is a significant contributor to the Cash Flow Returns on Investment methodology.
Returns On Cash Generating Assets or ROCGA uses the same methodology as Cash Flow Returns On Investments and is a measure of economic returns. The mean reversion theory of returns reverting to the cost of capital over time is applied. A company generates returns, and the higher the returns, in theory, the higher the valuation. The company will not be able to sustain its high returns over a prolonged period. Companies with greater competitive advantage can maintain those returns a little longer before the fade begins. A mature company’s return will fade quicker, and the earlier life cycle companies will fade at a lower rate. The model also ensures that the company is not overvalued or undervalued during different stages of the economic cycle.
The first step in using our DCF model to derive a warranted value involves modeling the company and back-testing the valuation for correlation with the historical share prices. Once confident we have captured most of the market assumptions, we use the same assumptions from the model to forecast forward, along with forecast EPS (money in) and DPS (money out). The total entity value is a function of returns, the rate of fade of those returns, and its ability to grow. The total equity value is the sum of the present value of existing assets and the present value of growth assets, minus gross debt. For mature companies, most of its value is in the existing assets, and for high-growth companies, more value is in the present value of growth assets.
The blue band in the valuation charts below represents the share price highs and lows for the year, and the orange line is the DCF model-driven historic valuation. The green line is the forecast warranted value derived using the same model along with the consensus EPS, DPS, and default self-sustainable organic growth. Self-sustainable organic growth is a ratio of investable free cash to gross assets. A more detailed breakdown of our modeling and quantitative valuation work can be found here.
The Value Drivers
Following on from improving margins and more efficient asset turnover, we see improving ROCGA, and ROCGA-x (excluding goodwill).
Returns On Cash Generating Assets (ROCGA Research)
Returns have been constantly increasing since 2014. 2023 saw revenue growth stall and returns decline. With growth expected to be subdued going forward, we see returns flattening out for FY24 and beyond.
In the valuation section below, we will see the relationship between how improving economic returns and growth interact to determine value.
Conventional Valuation
Agilent is a quality company but given its share price rise of approximately 28% over the past six months, it does not offer any significant upside. The company is trading at a slight premium when looking at conventional valuation matrices. PE for FY24 is 26.9x, higher than its historical averages as well as the sector average of 20x. Similarly, PS of 6.4x is higher than its historic averages as well as the sector average of 3.1x. This premium comes with expected lower growth than the company’s historic averages as well as sector averages.
Conventional Valuation Ratios (ROCGA Research)
Cash Flow Returns On Investments Valuation
The assumptions we use in our cash-flow-returns-on-investments-based modeling tools are that the company returns are not cyclical, have strong business strength (competitive advantage), and are in the early business cycle life cycle stages. The historical average growth is used for the default valuation.
Agilent CCF Model Assumptions (ROCGA Research & Author)
This gives us a potential upside of 29%. But we know that the default has changed and growth is going to be lower going forward.
ROCGA Default Valuation (Chart created by the author using ROCGA Research platform)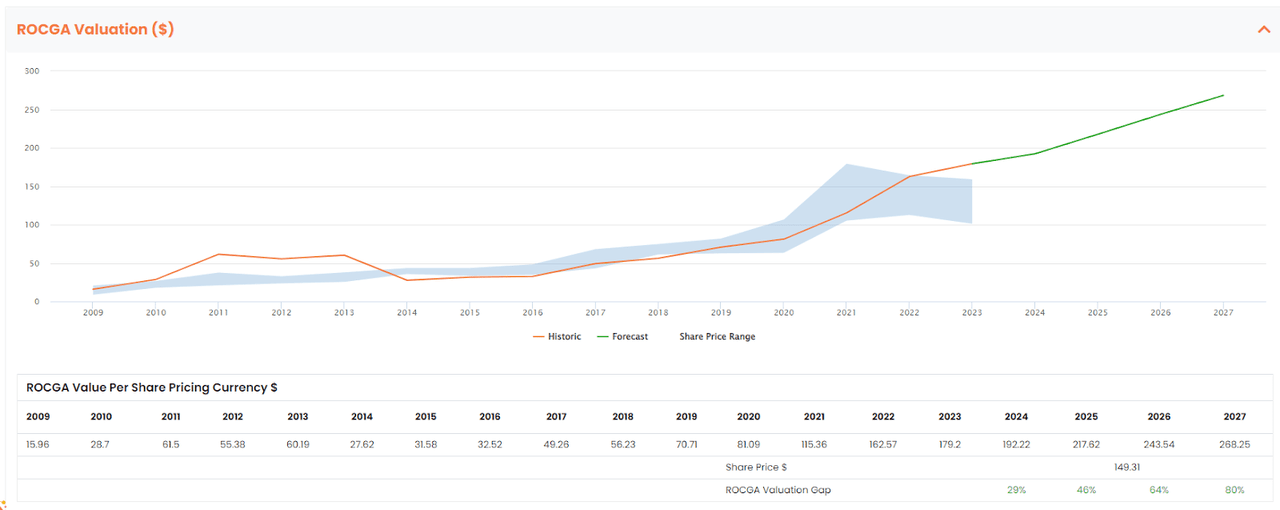
For a more realistic valuation, we need to make some adjustments to forecast growth. Growth in our model is related to the amount of free cash the company will have available to reinvest and grow. Sometimes opportunities exist for investments, and sometimes the company will return the free cash to its shareholders through higher dividend payouts or buying back its own shares. Share buyback can be looked at as investing in its share. We know growth is going to return over the medium and apply an 11% forecast growth. This corresponds to the company’s CAGR of its gross cash over the past nine years. This is our preferred scenario and puts the DCF warranted of Agilent at fair value.
ROCGA Adjusted Valuation (Chart created by the author using ROCGA Research platform)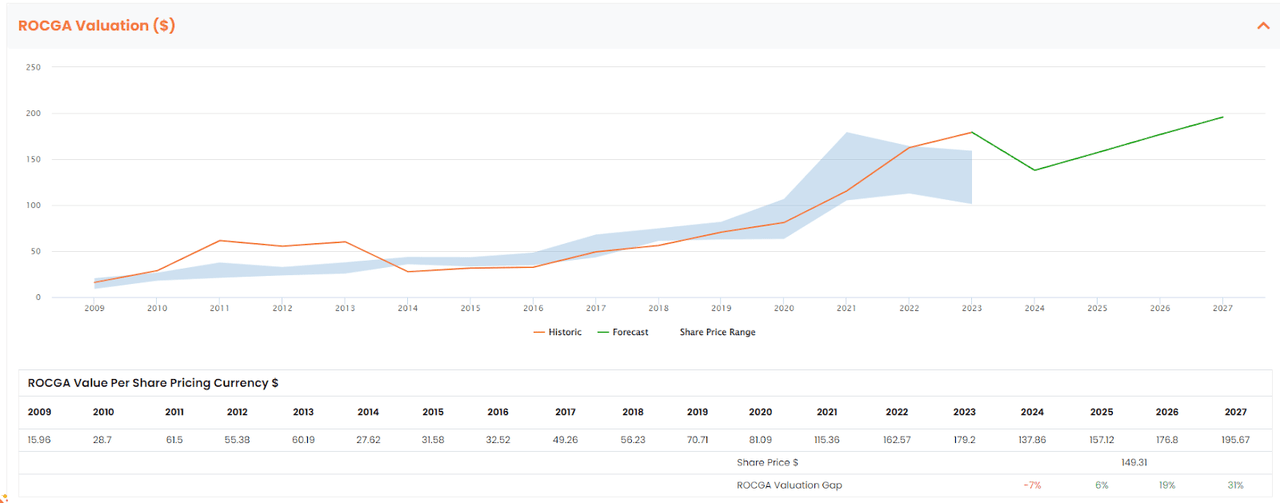
We also applied a more stringent growth by halving it to 7.5%, and this gave us a potential downside of 30% for FY24. If the tough economic conditions persist, and growth remains subdued for longer than anticipated, there is a risk of rerating and the warranted value could be significantly lower.
Conclusion
Agilent is a high-quality growth company, but our analysis shows that these are already priced in, especially given the 28% price rise over the last six months. Our DCF modeling as well as conventional valuation matrices both indicate Agilent as currently a hold.
Analyst’s Disclosure: I/we have no stock, option or similar derivative position in any of the companies mentioned, and no plans to initiate any such positions within the next 72 hours. I wrote this article myself, and it expresses my own opinions. I am not receiving compensation for it (other than from Seeking Alpha). I have no business relationship with any company whose stock is mentioned in this article.
Seeking Alpha’s Disclosure: Past performance is no guarantee of future results. No recommendation or advice is being given as to whether any investment is suitable for a particular investor. Any views or opinions expressed above may not reflect those of Seeking Alpha as a whole. Seeking Alpha is not a licensed securities dealer, broker or US investment adviser or investment bank. Our analysts are third party authors that include both professional investors and individual investors who may not be licensed or certified by any institute or regulatory body.
