Summary:
- Airbnb delivered solid Q3 results.
- The company faces major headwinds to growth in 2023.
- The Wall Street consensus outlook has been too bullish.
- The market-implied outlook (calculated from options prices) continues to be bearish.

stockcam
Travel stocks are selling off as investors grow more concerned about an economic slowdown in 2023. Wolfe Research, in a note today, issued a downbeat view of a number of online travel firms. Just yesterday, Morgan Stanley downgraded Airbnb, Inc. (NASDAQ:ABNB) to underweight. The shares are down 9.4% over the past 5 days and down 47.5% for the YTD.

Seeking Alpha
12-Month price history and basic statistics for ABNB (Source: Seeking Alpha)
The company is suffering from some negative news, with customers reporting poor experiences. One of the issues getting a lot of attention is very high service and cleaning fees. Another is that hosts are asking guests to perform a range of household tasks when they leave, in addition to charging substantial cleaning fees. Airbnb is often cited as one of the culprits (also see here) in rising prices of traditional long-term rentals. With increasing concerns about housing shortages, there is increasing risk of regulations that limit Airbnb’s form of short-term rentals.
Rising interest rates are a headwind for ABNB for 2 reasons. First, more expensive mortgages make the economics of buying property less attractive to potential hosts. Second, the fair values of high-P/E stocks fall disproportionately because of the impacts of higher interest rates on the estimated net present value of future earnings.
ABNB’s earnings bounced back briskly as COVID-driven lockdowns abated, reaching $1.79 a share for Q3, the company’s most-profitable quarter to date. Revenue was up 29% YoY for Q3. The outlook is for earnings over the next 4 quarters to look very similar to the past 4. The current valuation of the shares depends on rapid longer-term growth. The consensus estimate for EPS growth over the next 3 to 5 years is 39% per year.

ETrade
Trailing and estimated future quarterly EPS for ABNB. Green (red) values are the amounts by which quarterly EPS beat (missed) the consensus expected value (Source: ETrade)
I last wrote about ABNB on June 15, 2022, when I maintained a neutral rating on the stock. At that time, the shares were trading at $98.83. At that time, the forward P/E was 51.7, and I noted the valuation concerns, especially in light of rising rates. The Wall Street consensus rating on ABNB was a buy and the consensus 12-month price target was 83% above the share price at that time. One concern with the consensus outlook was the very high spread in analyst opinions, as represented by the dispersion in the individual price targets. The predictive value of the consensus price target declines as this dispersion rises. As a rule of thumb, I strongly discount the consensus price target when the ratio of the highest and lowest price targets exceeds 2. In mid-June, the ratio was about 2.5. The market-implied outlook, a probabilistic price forecast that represents the consensus view implied by options prices, was substantially bearish, as it was for my previous analyses in December of 2021 (when the shares were trading at $183) and March 24, 2021 (when the shares were trading at $173).
For readers who are unfamiliar with the market-implied outlook, a brief explanation is needed. The price of an option on a stock is largely determined by the market’s consensus estimate of the probability that the stock price will rise above (call option) or fall below (put option) a specific level (the option strike price) between now and when the option expires. By analyzing the prices of call and put options at a range of strike prices, all with the same expiration date, it is possible to calculate a probabilistic price forecast that reconciles the options prices. This is the market-implied outlook. For a deeper explanation and background, I recommend this monograph published by the CFA Institute.
Today, ABNB’s forward P/E is about 36, substantially lower than it was in June. The improving valuation and the solid Q3 results must be considered against the growing concerns about macroeconomic conditions in 2023. I have calculated updated market-implied outlooks for ABNB and compared these with the current Wall Street consensus outlook in revisiting my rating.
Wall Street Consensus Outlook for ABNB
ETrade calculates the Wall Street consensus outlook for ABNB using price targets and ratings from 24 ranked analysts who have published opinions over the past 3 months. The consensus rating is a buy, as it has been since before ABNB was trading at around $170, near 12-month highs, at the start of April. The consensus price target is 41.2% above the current share price. The spread among the individual analyst price targets continues to be very high, with the maximum ($165) coming in at just over twice the minimum ($80). As noted earlier, I largely discount the consensus price target when this ratio is at or above about 2.
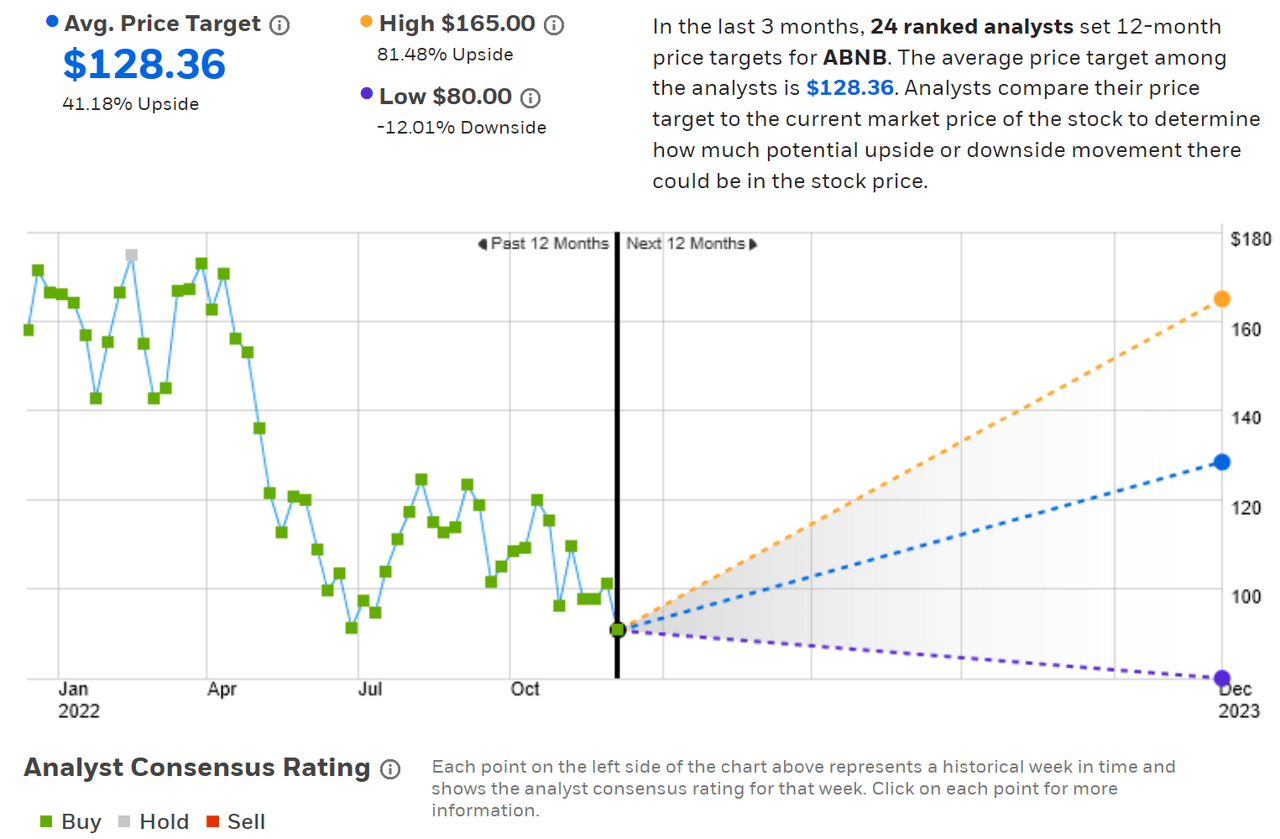
ETrade
Wall Street analyst consensus rating and 12-month price target for ABNB (Source: ETrade)
Seeking Alpha’s calculation of the Wall Street consensus outlook combines the views of 42 analysts who have published ratings and price targets over the past 90 days. The consensus rating is a buy, as it has been for the entire period since mid-May of 2021, when the shares were trading at about $135. The consensus 12-month price target is 43.5% above the current share price, and the ratio of highest and lowest individual price targets is 2.25.
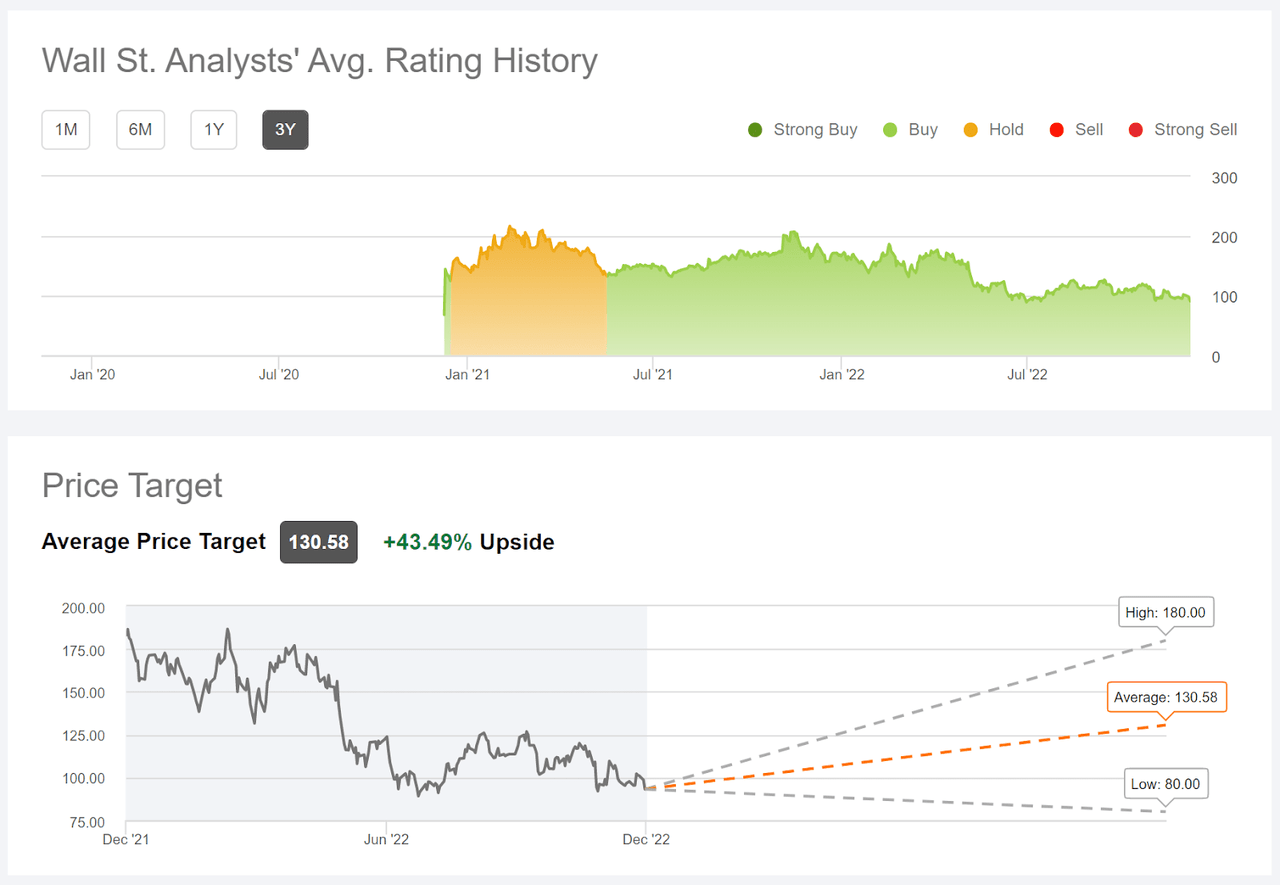
Seeking Alpha
Wall Street analyst consensus rating and 12-month price target for ABNB (Source: Seeking Alpha)
The market-implied outlooks calculated by ETrade and Seeking Alpha are very similar in all respects. The buy rating, with a price target corresponding to high expected return, is not very convincing because of the large level of disagreement between the individual analysts. This is consistent with my previous write ups on ABNB.
Market-Implied Outlook for ABNB
I have calculated market-implied outlooks for ABNB for the 6.2-month period from now until June 16, 2023 and for the 13.3-month period from now until January 19, 2024, using the prices of call and put options that expire on this date. I selected these specific expiration dates to provide a view to the middle of 2023 and through the entire year.
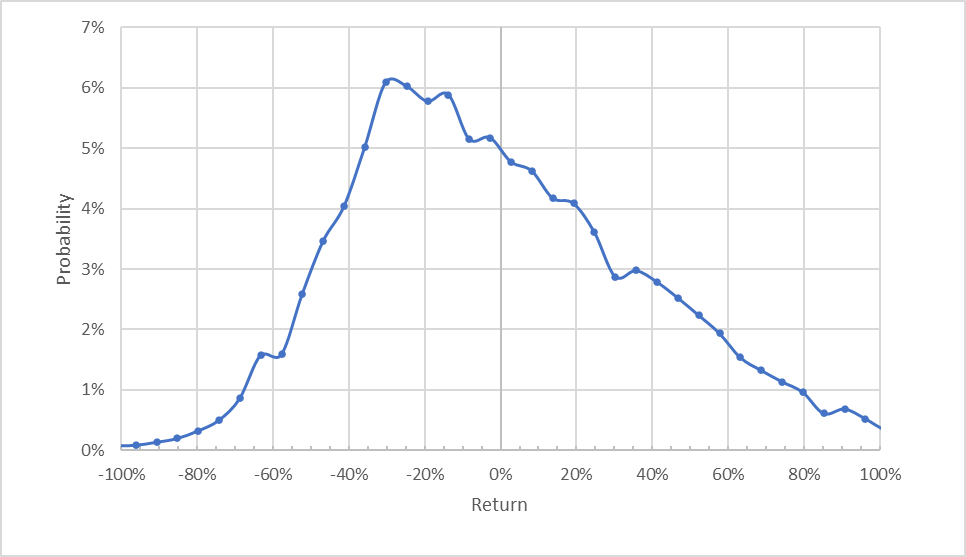
The standard presentation of the market-implied outlook is a probability distribution of price return, with probability on the vertical axis and return on the horizontal.
Geoff Considine
Market-implied price return probabilities for ABNB for the 6.2-month period from now until June 16, 2023 (Source: Author’s calculations using options quotes from ETrade)
The market-implied outlook to the middle of 2023 exhibits a substantial tilt in probabilities to favor negative returns. The maximum probability corresponds to a price return of -30%. The expected volatility calculated from this distribution is 57% (annualized), very close to the 54% implied volatility that ETrade calculates for the options with this expiration date.
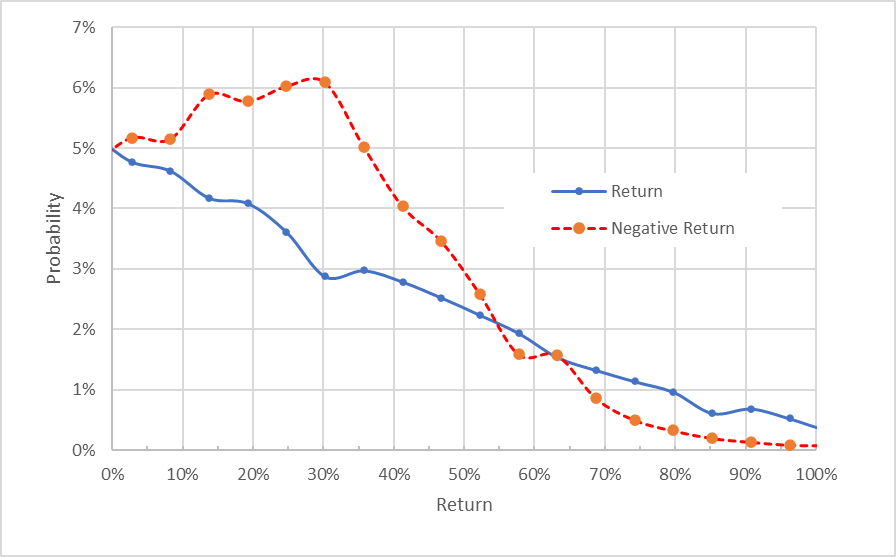
To make it easier to compare the relative probabilities of positive and negative returns, I rotate the negative return side of the distribution about the vertical axis (see chart below).
Geoff Considine
Market-implied price return probabilities for ABNB for the 6.2-month period from now until June 16, 2023. The negative return side of the distribution has been rotated about the vertical axis (Source: Author’s calculations using options quotes from ETrade)
This view really illustrates how much higher the probabilities for negative returns are, relative to those for positive returns of the same magnitude, across a wide range of the most-probable outcomes (the dashed red line is well above the solid blue line over the left half of the chart above). This is a bearish outlook. The probabilities for outsized positive returns are elevated relative to those for negative returns, but the overall probability of these outcomes is low. This market-implied outlook is highly positively skewed, an attribute that research has demonstrated tends to predict future underperformance.
Theory indicates that the market-implied outlook is expected to have a negative bias because investors, in aggregate, are risk averse and thus tend to pay more than fair value for downside protection. There is no way to measure the magnitude of this bias, or whether it is even present, however. Even considering the potential for a negative bias, this market-implied outlook is strongly bearish, based on the range of other cases that I have run.
The market-implied outlook for the 13.3-month period from now until January 19, 2024 is consistent with the shorter-term view. The distribution is positively skewed with the maximum probability corresponding to a price return of -33% and expected volatility of 56% (annualized). This is a bearish market-implied outlook for 2023 as a whole.
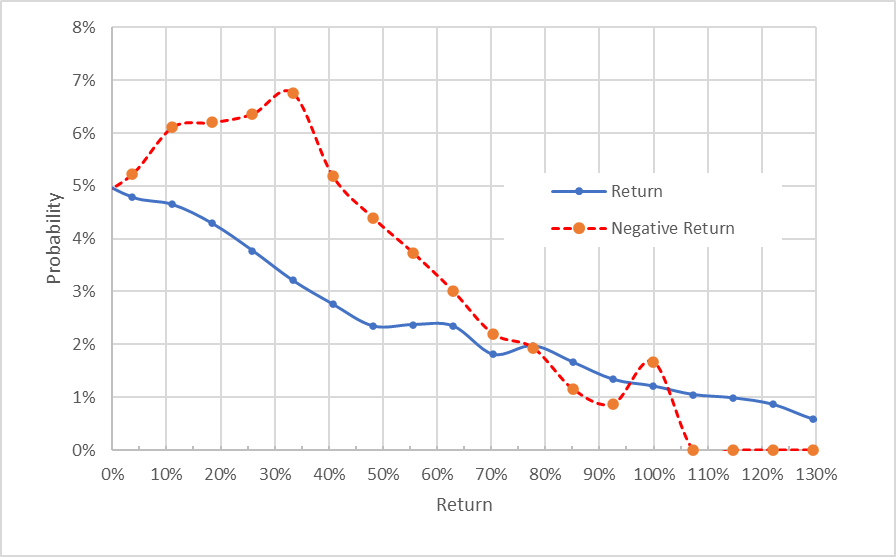
Geoff Considine
Market-implied price return probabilities for ABNB for the 13.3-month period from now until January 19, 2024. The negative return side of the distribution has been rotated about the vertical axis (Source: Author’s calculations using options quotes from ETrade)
Consistent with my previous analysis, the market-implied outlooks for ABNB continue to be bearish, with high volatility.
Summary
While ABNB reported robust results for Q3, the company faces a series of major challenges. High inflation has Americans reducing the amount that they plan to spend on travel. Higher interest rates make the economics of borrowing to buy a vacation rental property less attractive. There is a rising tide of dissatisfaction among Airbnb clients and the company faces regulatory risks as communities grapple with a housing shortage. Wall Street analysts have tended to be overly optimistic on the company’s prospects, so the current consensus buy rating and high returns implied by the consensus price target are not compelling. The market-implied outlooks for ABNB are bearish to the middle of 2023 and for the full year, with expected volatility around 55%. In my previous posts, I have been reluctant to fully discount the Wall Street consensus view, even though the dispersion in the individual price targets was high. With the current results, I am putting more weight on the market-implied outlook and, as a result, I am downgrading ABNB to a sell rating.
Disclosure: I/we have no stock, option or similar derivative position in any of the companies mentioned, and no plans to initiate any such positions within the next 72 hours. I wrote this article myself, and it expresses my own opinions. I am not receiving compensation for it (other than from Seeking Alpha). I have no business relationship with any company whose stock is mentioned in this article.
