Summary:
- Algonquin Power has recovered remarkably since its December lows, outperforming the S&P 500 significantly.
- In our previous article, we called attention to AQN’s price action, which plunged to highly pessimistic levels, with a potential bear trap waiting to be sprung.
- Astute bottom fishers sensed a timely mean-reversion opportunity and robustly set up the false downside breakdown, capitalizing on investors who sold their shares at its multi-year lows.
- After a sharp rebound over the past three months, AQN’s valuation has normalized. Hence, the reward/risk profile has become significantly less enticing.
- With our mean-reversion thesis playing out as we postulated, we are moving off to the sidelines from here.
Scott Heins
Algonquin Power & Utilities Corp. (NYSE:AQN) has outperformed the S&P 500 (SPX) (SPY) significantly since our previous update in January. We argued back then that dividend investors likely bailed out after the company announced its 40% dividend cut. However, we also discussed why AQN’s price action suggests the market had likely priced it in, forcing these income investors to flee at the lows.
Accordingly, AQN recovered more than 25% from its December lows (in price-performance terms) through this week’s highs, stunning bearish investors. We believe it’s essential for investors to assess why we highlighted its reward/risk was attractive back in late December and January, despite the massive pessimism.
With a 10Y total return CAGR of 5.8%, the recovery is significant for these bottom-fishers who correctly anticipated a mean-reversion opportunity.
Algonquin’s FQ4 release was better than expected. However, investors should note that its adjusted EPS of $0.22 (Vs. Q3’s $0.11) was lifted by “gains on asset sales in the Renewable Energy Group.”
Accordingly, Algonquin posted $277M in cash proceeds on the sale of its US facilities and C$108.6M on its Blue Hill Wind Facility (resulting in about $316M in total proceeds). As such, the company delivered a gain on disposition of $62.8M.
Notably, the company maintains that it’s on track to record asset sales of $1B in 2023. However, investors should note the estimated gains/losses on disposition in 2023 are not included in its midpoint adjusted EPS guidance of $0.58 for FY23.
Moreover, its midpoint guidance indicates that Algonquin anticipates a 16% YoY decline in its adjusted EPS relative to last year’s $0.69 metric. With that in mind, we believe the company’s asset recycling strategy will remain an ongoing component of its business strategy, which could lead to volatility in its adjusted EPS trajectory.
Algonquin recorded total assets of more than $17B as of the end of 2022. Hence, the company believes it has significant opportunities to unlock the value of its assets moving ahead. CEO Arun Banskota articulated:
[We have] over $17 billion worth of assets in our portfolio, the $1 billion [asset sales] taken in context is a fairly small amount. We have quite a number of different optionalities for that $1 billion of proceeds. As you know, we just announced in the fourth quarter, the renewable asset sell-down with proceeds in the range of $316 million. That is part of our ongoing strategy on the renewable side of the business. And with our acquisitive history over the many years, we certainly have a number of optionalities to get to that $1 billion, and we certainly will provide you more color with time. (Algonquin FQ4’22 earnings call)
Importantly, management highlighted that investors must wait until April 26 to get clarity over its acquisition of Kentucky Power Company. The company did not offer additional guidance over how the regulatory approval would pan out, even though it filed a new application with the FERC on February 15. Despite that, its acquisition is still “subject to the satisfaction or waiver of certain conditions precedent.”
For investors, what do they need to consider? Note that the company highlighted that its estimated CapEx is about $3.6B for 2023, including the $2.6B acquisition of Kentucky Power.
Management articulated that the company still “has more growth opportunities on both the regulated and renewable sides of the business,” even if the approval was not granted.
However, we believe the uncertainty could keep dip buyers from adding more positions from here after a remarkable recovery from its December/January lows, normalizing its valuation.
AQN price chart (monthly) (TradingView)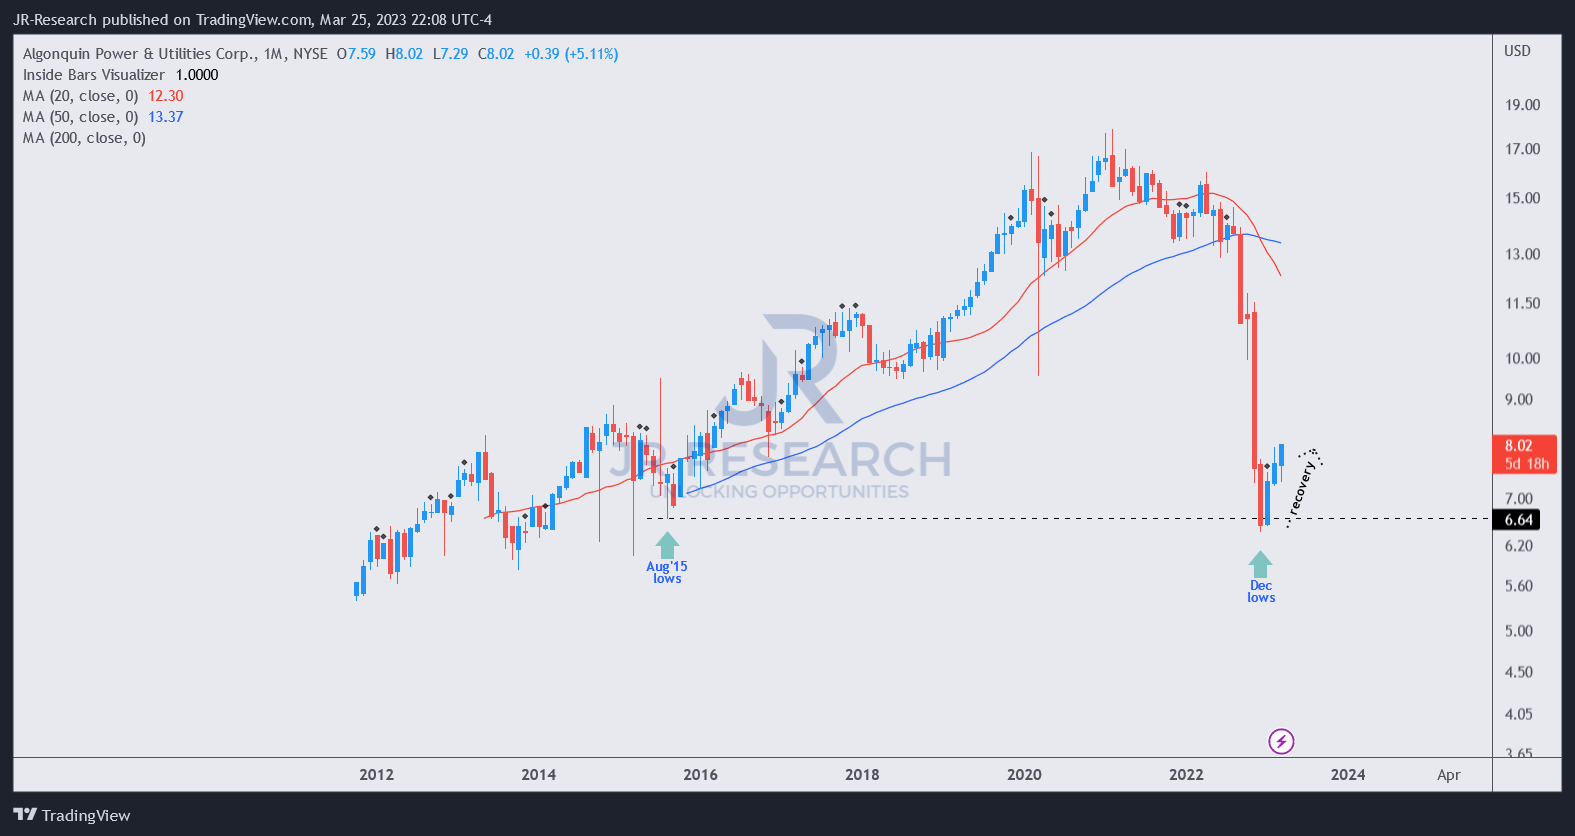
AQN bottom-fishers astutely ignored the massive pessimism at the end of last year, as it formed a bear trap or false downside breakdown. It then staged an impressive recovery over the past three months, as seen in AQN’s long-term chart above.
Its valuation has also normalized. Accordingly, AQN’s NTM EBITDA multiple of 11.2x is in line with its peers’ median of 11.3x (according to S&P Cap IQ). Also, with the cut in its dividend, its NTM dividend yield of 5.5% is much less attractive now.
AQN blended fair value estimates (InvestingPro)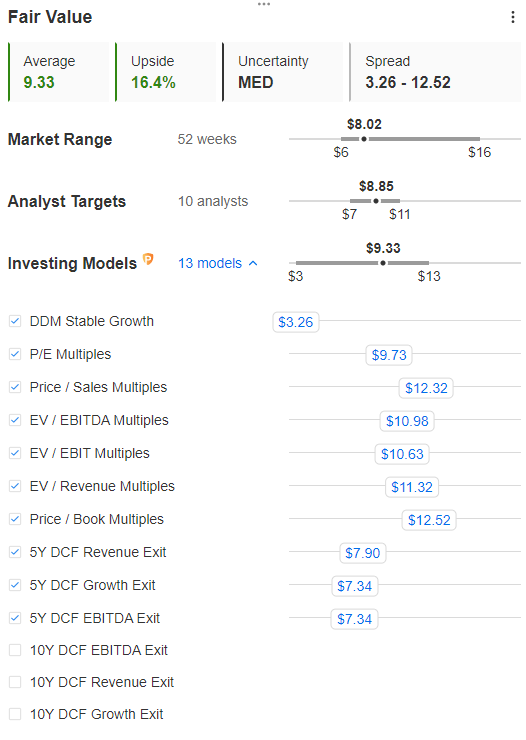
Its blended fair value estimates suggest a potential 16% undervaluation. However, we assessed that its near-term upside is likely reflected in its mean reversion.
Given significant uncertainty over its pending acquisition and business strategy, we urge investors to account for a higher margin of safety to account for considerable execution risks.
With that in mind, we believe our thesis has played out accordingly and, therefore, is appropriate for investors to consider moving to the sidelines from here.
Rating: Hold (Revised from Buy).
Disclosure: I/we have no stock, option or similar derivative position in any of the companies mentioned, and no plans to initiate any such positions within the next 72 hours. I wrote this article myself, and it expresses my own opinions. I am not receiving compensation for it (other than from Seeking Alpha). I have no business relationship with any company whose stock is mentioned in this article.
Additional disclosure: Important Note: Investors are reminded to do their own due diligence and not rely on the information provided as financial advice. The rating is also not intended to time a specific entry/exit at the point of writing unless otherwise specified.
A Unique Price Action-based Growth Investing Service
- We believe price action is a leading indicator.
- We called the TSLA top in late 2021.
- We then picked TSLA’s bottom in December 2022.
- We updated members that the S&P 500 had long-term bearish price action signals in November 2021.
- We told members that the S&P 500 likely bottomed in October 2022.
- Members navigated the turning points of the market confidently in our service.
- Members tuned out the noise in the financial media and focused on what really matters: Price Action.
Sign up now for a Risk-Free 14-Day free trial!