Summary:
- I’m adding Alibaba and JD.com to my radar, as I expect both Chinese players should fare better in a post-Beijing Stimulus plan China.
- Combined, both companies hold +69% of China’s e-commerce market. I expect them to benefit from a long-awaited macro recovery and higher consumer confidence and spend it’ll bring.
- Alibaba’s international presence and cloud computing advancements give it a better long-term edge over JD.com, but I remain a buy on both stocks.
- I hereon share my positive sentiment on BABA and JD and why I see green shoots after consumer spending takes off next year.
Krianti/iStock via Getty Images
Investment thesis:
If you’re living in China, the odds are that you’re doing your e-commerce business through either Alibaba or JD, or both. I’m here to put all my cards on the table and make the case for each company and why they should take up some space on your portfolio after the recent pullback.
I’m initiating both Alibaba (NYSE:BABA) and JD.com (NASDAQ:JD) with a buy after both companies reported earnings last week and suffered a massive pullback. Alibaba is down 12.7% on the one-month chart, against JD, down 11.6%, and the S&P500, up 0.6%. Needless to say, both stocks are cheap at current levels. But why I’m a buy on both stocks is a long story that I’ll narrate as we go further in the article. I want to answer the more obvious question: why are these two against each other? The simple answer is China. With the Beijing stimulus plan and the Chinese government’s efforts to revive the economy, I think these two e-commerce companies that rely heavily on consumer spending stand to benefit the most.
YChart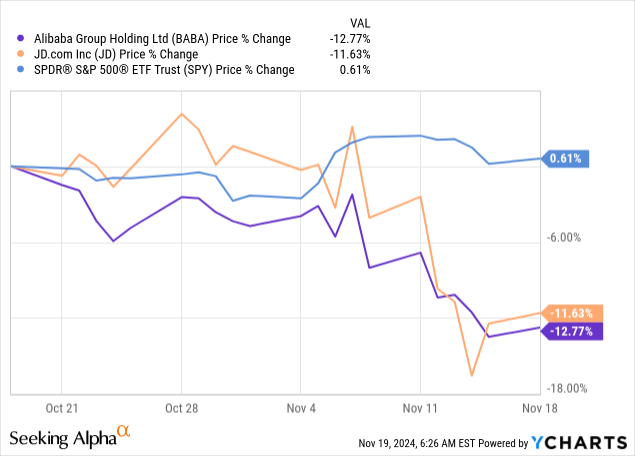
E-commerce in China:
China is now one of the largest e-commerce markets globally, with e-commerce sales increasing from 10.6% of total retail sales in 2014 to around 27.6% in 2023. According to data from Statista Market Insights, the value of e-commerce retail sales is estimated to reach over $3.99 trillion by 2026. But let’s stay in the now; revenue from e-commerce globally is projected to reach $1.469 billion in 2024, most of which will be coming out of China. The market will reach over $2.36 billion in volume by 2029, with a CAGR of 9.95% between 2024 and 2029. The number of users in the market is expected to be 1.36 million in 2029, and user penetration will be 78.8% in 2024, with expectations of hitting 97.4% by 2029.
According to data from Mordor Intelligence, the e-commerce market size is estimated at $8.8 trillion in 2024 and is projected to reach $18.8 trillion by 2029, with a CAGR of 15.8% during the forecasted period. But what I care about most at the moment is China, which, by the way, will witness an e-commerce market size of $1.4 trillion in 2024 and is expected to reach $2.31 trillion by 2029 with a CAGR of 10.07% during the same period as seen below.
Mordor Intelligence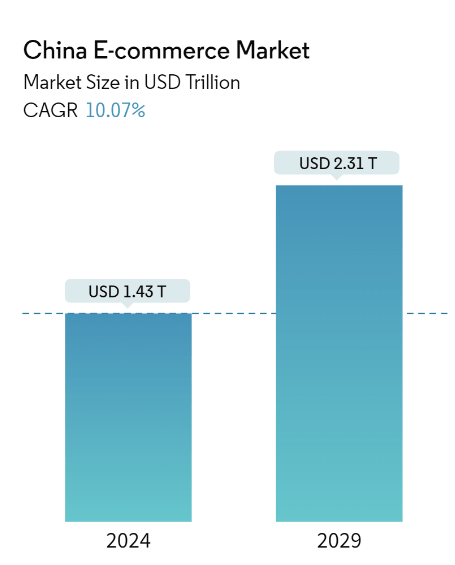
Why does this matter? Combined, both companies hold over 69% of China’s e-commerce market revenue, and despite the growing competition from rivals such as Pinduoduo, both these companies have found a way to be cost-effective in a recovering Chinese consumer spending environment. I’ll get to this in a second. Alibaba was ranked number one among China’s comprehensive e-commerce retailers and had a market share of 46% in 2023, against JD, which ranked second with 27.2% of the market share, as seen below.
Statista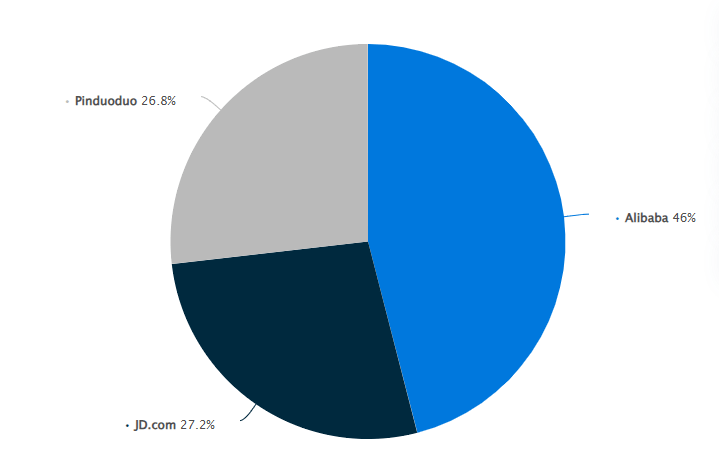
China E-commerce Titans’ Earnings Snapshot:
Alibaba & JD domestic :
Alibaba reported 2Q25 earnings last Friday, and shares were up 5.16% in premarket trading to $95.3, above the 52-week range of $66.6- $117.8. The company reported revenue up 5% year-over-year to $33.71 billion, above the consensus of $33.2 billion. Excluding consolidated subsidiaries, revenue was up 7% year-over-year, mainly driven by a double-digit public cloud growth along with increased adoption of AI-related products, but I’ll discuss this further in the next section.
Back to the -e-commerce business, which, for obvious reasons, is on my top-watch list. The Taobao and Tmall Group, which make up around 42% of total revenue, were up 1% year over year to $14.1 billion, with China commerce retail (making up 94% of the Taobao and Tmall) up 0.48% year over year to $13.2 billion. The increase was largely due to customer management revenues up 2% year over year, backed by online GMV growth, but offset by a decline in direct sales & other revenues, down 5% year over year to $3.2 billion. This is not in any way surprising, considering the Chinese government is trying to revive the economy by the skin of its teeth with the recent Beijing stimulus plan and the recent $1.4 trillion debt package. The remaining 6% of the Taobao and Tmall revenues came in at $853 million, up 17.5% year-over-year due to increasing revenues from value-added services.
As for JD, the company generated $37.11 billion for the quarter, 3Q24, with revenue up 5.1% year over year, beating consensus at $36.5 and also beating Alibaba’s revenue. By category, the revenue of electronics and home appliances was up 3% year over year, with September being notably strong for home appliances and PCs, which was backed by management’s contribution to the trading program and proved successful in boosting consumption. Revenue of general merchandise had another solid quarter with an 8% increase year over year, with revenues of “supermarket category, apparel, and sports and all sorts of fashion category also saw a double-digit increase year-on-year.”
As for the segment I care about most, retail, revenues were up 6% year over year in Q3 due to 1. turnaround of electronics and home appliances and 2. General merchandise growth. If I were to look at either of these companies as a basis for where Chinese consumer spending is now, I’d say JD fares better. But the market is forward-looking, and so am I. So, from that perspective, I’ll tell you about my favorite name and why.
Where you are matters: international presence
When choosing China’s next top e-commerce name to invest in, geography isn’t to be overlooked. While both are very established in China, Alibaba takes the title internationally. Alibaba’s international digital commerce group makes up over 25% of total revenues. The segment that comprises Lazada, AliExpress, and Trendyol makes up 25.78% of total revenues and generated $4.51 billion, up a staggering 29% year over year for the quarter. Out of that, international commerce retail, which makes up around 81% of the international business, was up another impressive 35% year over year to $3.6 billion due to the strong momentum in AliExpress and Trendyol. The rest, making up a little over 19% of international revenues, generated $863 million and was up 9% year-over-year due to strength in cross-border-related value-added services. JD’s international presence remains limited despite the efforts. In late August, the company announced several enhancements to its overseas shipping services for customers in Japan, Singapore, and the U.S. This gives customers in these regions access to improved logistics options, and said customers are Chinese consumers overseas. The risk here for the Chinese e-commerce giants lies in Trump taking office and his commentary on tariffs. Both these companies aren’t immune to this headwind, and while it’s too soon to tell, I will be watching that area closely.
Single’s Day: Double-digit growth
Both Chinese e-commerce giants had high expectations for this year’s Singles Day promotion, and the results exceeded all expectations, signifying a rebound in consumer spending in China. Both companies decided to start their campaigns on October 14, earlier than the previous two years (October 20), and the results proved the move successful. Let’s go back to 2009 when Alibaba first initiated the festival as a 24-hour online event on November 11. The event, now known as 11:11, is now used by investors to track consumer spending in China.
According to a report on Tuesday, Alibaba led the herd with 38% market share, with JD at 20%, ByteDance at 13%, and PDD Holdings’ Pinduoduo at 10%. On Tuesday, another Chinese consultancy, Analysys, also reported that Taobao and Tmall were responsible for over 50% of the share among the other major platforms in this year’s festival. According to TTG, the campaign had “a record number of active buyers,” while JD reported over 20% increase from a year ago. I expect the positives of the Single’s Day promotion will be reflected in the next quarter, particularly with the government’s stimulus plan, which is expected to boost consumer spending and confidence. I think aside from the quarter-over-quarter catalyst there, we will witness strong year-over-year comparisons as well due to the rebound in consumer spending.
Up in the cloud: a double-edged sword, but a sword nonetheless
Alibaba one ups JD as one of the top five cloud computing market leaders, up there with the “Big Three.” Amazon (AMZN) established itself as a leader in the cloud infrastructure market in the early days and remained so through AWS at 31% of the market share worldwide as of 3Q24. Following Amazon is the one and only Microsoft (MSFT), with its Azure platform snatching 20% and Google (GOOG) Cloud at 11%, as seen below from Synergy Research Group. All these together, and I’ll do the math for you, make up over 60% of the cloud market, leaving very little for the competition. From the latter, I only care about Alibaba, which makes up a good 4% of the market. Though still in the low single-digit, this quarter makes me all the more optimistic about Alibaba’s strides and progress in cloud computing.
Before I get to that, I want to discuss the market in more detail. In 3Q24, the global cloud infrastructure service spending grew 23% year over year to $15.7 billion, with total spending up to over $84 billion in the past quarter and over $313 billion over the past 12 months, indicating a robust and strong growth despite the size.
Statista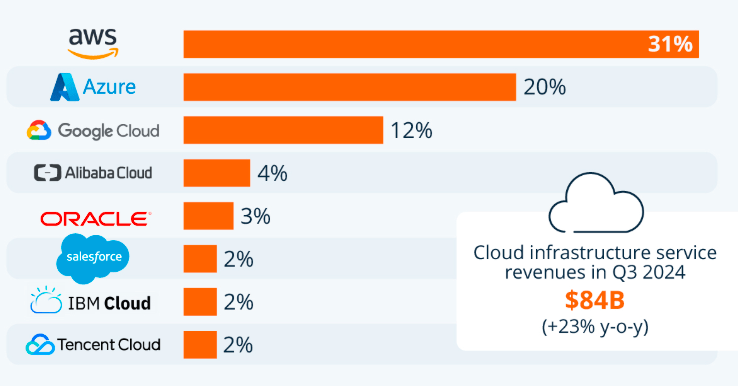
As for Alibaba, management continued optimizing the revenue mix and advancing the integrated cloud plus AI development strategy. Cloud revenue was 7% up year over year, and momentum remained strong due to increasing demand for AI, creating more demand for the company’s public cloud products. The latter witnessed double-digit growth, while AI-related product revenue was in triple-digit year-over-year growth for the fifth quarter in a row. Alibaba’s cloud intelligence group makes up 12.5% of total revenues and generated $4.21 billion this quarter, backed by strength in public cloud products and offset by non-public cloud products. And while all this is nice and dandy, investments in the cloud infrastructure weigh heavily on margins. Alibaba maintained a strong net cash position for the quarter at $50.2 billion, but the hit was on the free cash flow front, which decreased 70% year over year. Cloud-adjusted EBITDA was up 89%, while adjusted EBITDA margin was up 4% to 9% year over year, backed by the shit in product mix towards more high-margin public cloud products, including AI-related products.
The offset came as a result of increased investments in customer growth and technology, which I don’t anticipate that management will do less of anytime soon, and I say this optimistically. Management reiterated my belief and said they’re making “aggressive investments for the short term, but in the longer term, we view this opportunity around GenAI as a historic opportunity, it’s the kind of opportunity that probably comes along only once every 20 years, say, in terms of the ability to leapfrog technologically.” I think Alibaba has the technological advantage and the scale effect of balancing growing volume and also improving profitability.
According to management, they’re taking a long term “view” regarding profitability in the cloud infrastructure sector, “both in terms of software pricing and compute pricing.” While I recognize the road ahead is long and filled with competitors that all want a piece of the cake, I think Alibaba continues to position itself further as one of the leaders in the space. One point of concern is Alibaba’s ability to keep up with its Western competitors regarding spending, but I guess time will tell in that regard.
Valuation:
Alibaba has a market cap of $198.2 billion, higher than that of JD at $51.01 billion. The market is currently optimistic about Alibaba, and according to data from Refinitiv, around 30% of Street Analysts give the stock a strong buy, 53% give it a buy, and the rest are a hold. The case is similar to JD, and around 29% give the stock a strong buy, 57% give it a buy, 10.7% hold, and around 4% are a sell. The price target for both stocks reiterates my optimism, with both the PT mean and median having an upward trend. In the case of Alibaba, the PT median was at $109.5 in late August and September, was up to $120 in October, and is currently at $125. The mean was at $107.6 in late August and was slightly up in September to $107.8, $118.7 in October, and is now at $121.5. For JD, the PT median was $151 in late August, up slightly to $152.1 in September, dramatically to $190 in October, and is now down to $181. The mean had a smooth ride with $145.9 in August, $146.6 in September, $176.8 in October, and is now $182.8.
As for the valuation metrics, in my humble opinion, I think Alibaba’s is more attractive than JD, and I’ll tell you why. Alibaba has a trialing P/E ratio of 17.65 and a forward P/E ratio of 9.42, both of which are higher than JD’s at 11 and 8.16, respectively. I think Alibaba’s growth opportunities, along with its cross-border business and cloud business, excuse the high ratios. And while I’m not saying JD’s don’t, I think I’d put my money in Alibaba for now. If you’re approaching these stocks with a long-term mindset, then I really can’t play favorites as both these stocks seem to be in sync more or less, as seen below on the year-to-date chart.
YChart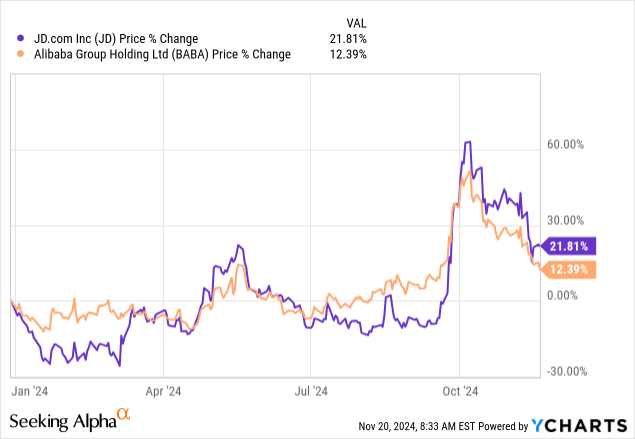
What’s next:
For the next quarter, I’m watching Alibaba for a rebound in the Taobao and Tmall businesses. Single’s Day should boost sales exponentially; I think the same will happen with JD. I remain optimistic about Alibaba’s cloud business and bet that it’s well on its way to being their next big thing. As for JD, with the recent announcement in September on the apparel category and with more investments underway in terms of product selections and the 50% off campaign on apparel, I think that will resonate with customers. During the 50% off campaign at the London Fashion Show, the company showcased its brand selection and “competitive pricing and all these campaigns have attracted new users with high purchasing power, who showed greater order values and high repurchasing rate within a month, especially during the single-segment promotion.” I share management’s sentiment and think this will yield new active users in the fashion and beauty segment, eventually boosting the top line. The recent deal that JD made with Alibaba’s Taobao and Tmall, which I expect is good news for both.
Analyst’s Disclosure: I/we have no stock, option or similar derivative position in any of the companies mentioned, and no plans to initiate any such positions within the next 72 hours. I wrote this article myself, and it expresses my own opinions. I am not receiving compensation for it (other than from Seeking Alpha). I have no business relationship with any company whose stock is mentioned in this article.
Seeking Alpha’s Disclosure: Past performance is no guarantee of future results. No recommendation or advice is being given as to whether any investment is suitable for a particular investor. Any views or opinions expressed above may not reflect those of Seeking Alpha as a whole. Seeking Alpha is not a licensed securities dealer, broker or US investment adviser or investment bank. Our analysts are third party authors that include both professional investors and individual investors who may not be licensed or certified by any institute or regulatory body.
