Summary:
- Alphabet’s stock is in strong uptrends across all time frames, supported by robust technicals and resilient fundamentals, making it a moderate buy.
- Despite competition from AI-driven search engines, Alphabet’s own AI advancements provide tailwinds, maintaining its search dominance.
- Recent earnings showed significant growth, with a 15% YoY revenue increase and a 37% YoY EPS rise, justifying current valuation multiples.
- Investors should focus on Alphabet’s strong technicals and fundamentals rather than potential AI competition, indicating a positive outlook for the stock.
Robert Way/iStock Editorial via Getty Images
Thesis
Recently, there has been an abundance of news of Perplexity and the newly released ChatGPT Search competing with Alphabet’s (NASDAQ:GOOGL) Google search engine. While this news could indicate potential headwinds, I believe it is just mainly noise as AI will also provide Alphabet with their own tailwinds that will make their search stronghold still incredibly hard to break. Instead, in my view, investors should focus on the strong technicals as the stock has a net positive outlook in all-time frames with charts showing the stock remains in strong uptrends. As for the fundamentals, the latest earnings were strong and the company is growing at a resilient rate. Furthermore, I believe the current valuation multiples correctly reflect the company’s growth. Since the vast majority of technicals are positive and the valuation is fair, I initiate Alphabet at a moderate buy rating.
Daily Analysis
Chart Analysis
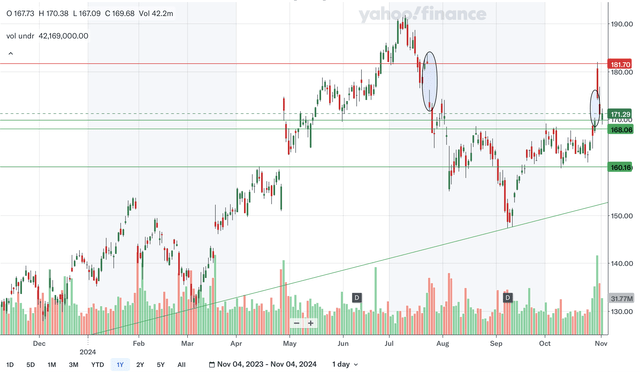
The daily chart shows that Alphabet remains in a short term uptrend despite the correction during the middle of the year. There is also plenty of support underneath while there is relatively minimal resistance above. The only area of resistance identified is at around 180 which was a downside gap that occurred back in July. That level was resistance just very recently and could be resistance moving forward. The closest area of support would be at 171 since that area was an upside gap that happened just very recently. Currently, the stock is sitting very near this level and could bounce off of it. We also have support in the high 160s since that area was major resistance back in August and in early October. The low 160s could also be support as that area acted as resistance earlier in the year and support in October. Lastly, we have distant support from the uptrend line that is nearing 155. Overall, I believe this daily chart shows a favourable near term for Alphabet as the stock remains in an uptrend with close support underneath.
Moving Average Analysis
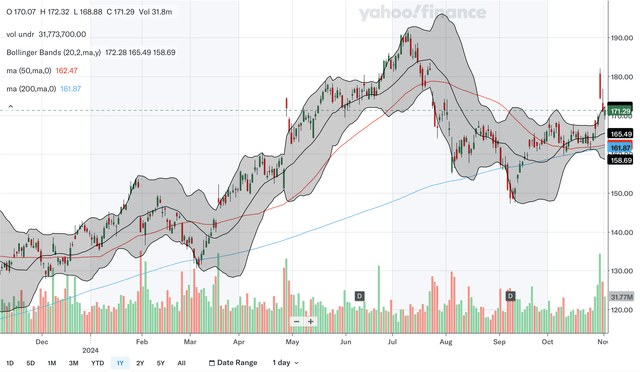
The has been no crossovers between the 50 day SMA and the 200 day SMA in the past year. However, the 50 day SMA has been getting dangerously close to the 200 day SMA as of late showing that bullish momentum has be relatively weak. The 50 day SMA’s trajectory has improved in past days and may in fact bounce off the 200 day SMA and so a bearish crossover can still be avoided. These SMAs should be monitored closely moving forward to see whether a bounce or a crossover occurs. For the Bollinger Bands, the stock rocketed above the upper band recently and has since receded back within the bands, showing that an overbought pullback was not surprising after the surge. The stock is still trading very near the upper band but with volatility expanding the bands, the stock may have new room to run. The 20 day midline would be the closest MA support and is currently at 165. In my view, the MA’s are net positive as bearish signals have yet to materialize even though the SMAs need monitoring.
Indicator Analysis
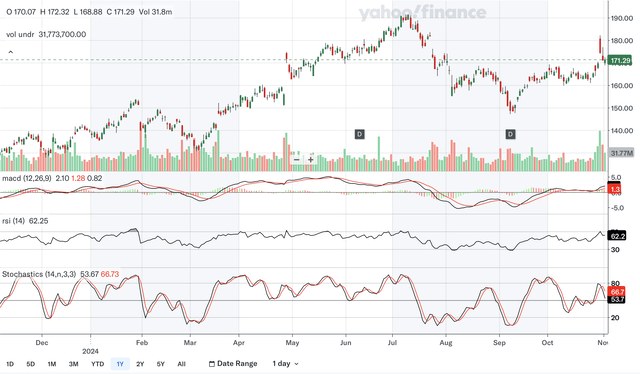
The MACD crossed above the signal line in late October, a bullish signal. The crossover came after weeks of indecisiveness as the two lines were almost inseparable for weeks. The MACD shows positive divergence back in September indicating that the bottom was in. While the stock declined below the August low, the MACD did not confirm, as it remained above its own August trough. This should have given investors an early indication that the bottom was in and the stock may be ready to advance. For the RSI, it is currently in the low 60s. It has held above the critical 50 level since reclaiming that level back in mid September demonstrating that the bulls have been in control lately. Lastly, for the stochastics, the %K just crossed below the %D in the past days reflecting the overbought pullback. Although this signal itself is bearish, as demonstrated by the Bollinger Bands, the stock was extremely overbought so a near term pullback is not at all surprising. These daily indicators, in my view show a net positive short term view as well since the stochastics bearish signal merely reflects a healthy pullback.
Takeaway
Although there were minor mixed signals in some of the analysis, all three analyses were net positive indicating a strong short term technical outlook for Alphabet stock. The chart shows that the stock remains in an uptrend with strong support while the MAs remain in bullish territory. Lastly, as discussed above, the indicators are also net positive despite some minor mixed signals.
Weekly Analysis
Chart Analysis
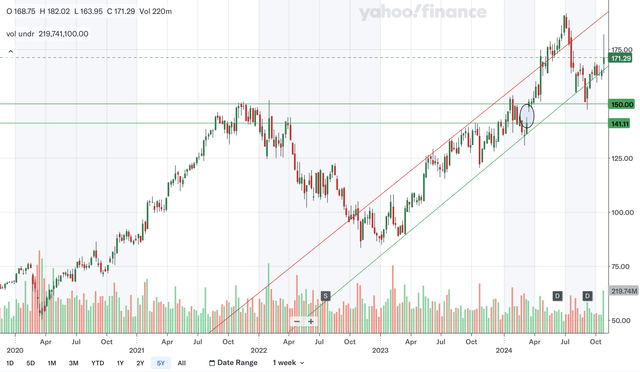
The weekly charts show that Alphabet is an intermediate term uptrend that dates back to the beginning of 2023. The stock has been bound in an upward channel until it broke above the upper channel line earlier this year. This breakout was proven to be false as the stock slumped back into the channel and actually broke the bottom channel line for a brief period before reentering the channel. This is quite a drastic change for the stock as it went from becoming an accelerated uptrend to breaking its uptrend line in a matter of months. Nonetheless, the stock currently is back in this upward channel and is a bullish indication. The only intermediate term resistance would be at the upper channel. For support, the nearest area would be the lower channel line. The next area would be at around 150 as that zone was resistance back in 2021 and was support just recently. Lastly, we also have an upside weekly gap in the low 140s that could provide support. Overall, the weekly chart is a positive one as the stock has reclaimed the important bottom channel line.
Moving Average Analysis
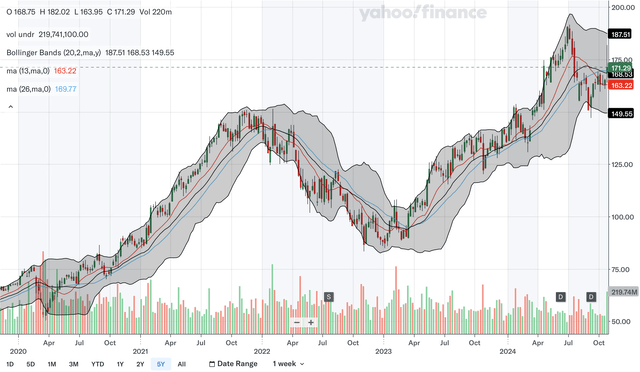
The weekly MAs show a mixed picture for Alphabet stock. The 13 week SMA had a bearish crossover with the 26 week SMA not too long ago but the stock has held up well since that signal. The stock has broken back above these SMAs and is currently trading modestly above the 26 week SMA. This shows that despite the bearish signal, the stock has shown strength. For the Bollinger Bands, the stock just broke above the 20 week midline which is another indication of strength. The midline currently sits just below the 26 week SMA and can also be support moving forward. In my view, despite the highly bearish SMA crossover signal, the stock’s recent developments largely nullifies this signal as the stock has powered through the 13 week and 26 week SMAs, and the Bollinger Bands midline showing it has recent strength.
Indicator Analysis
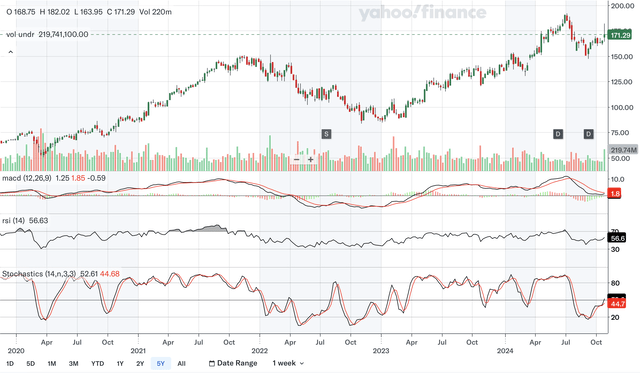
The MACD is currently still below the signal line but a bullish crossover seems to be imminent as the MACD regains its upward trajectory while the signal line continues to fall. This would be the first bullish crossover in months and should be a significantly positive signal. For the RSI, it is currently at 56.6 and it has just recently regained the critical 50 level, indicating that the bulls have wrestled control of the stock from the bears. Lastly, for the stochastics, the %K crossed above the %D not too long ago right at the oversold 20 zone, a highly bullish signal. The %K has recently bounced off of the %D and widened the gap indicating that the bulls remain resilient. From my analysis, these three key indicators shows a positive outlook for Alphabet as there are bullish signs all around.
Takeaway
The weekly analyses have shown a net positive intermediate term technical picture for Alphabet stock. The chart looks quite bullish as the stock has importantly reentered the upward channel. The moving averages were a bit mixed but there has not been bearish action since the crossover. Lastly, the indicators were positive as there were plenty of bullish signals there.
Monthly Analysis
Chart Analysis
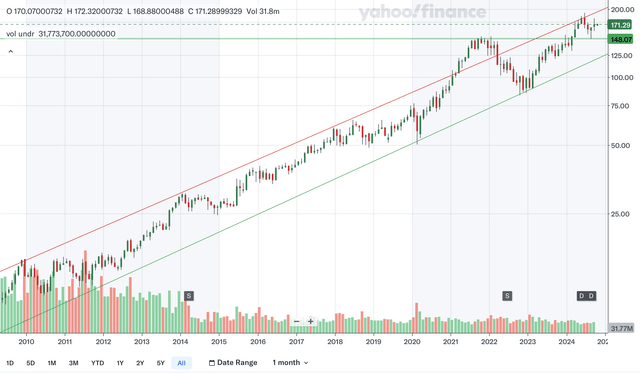
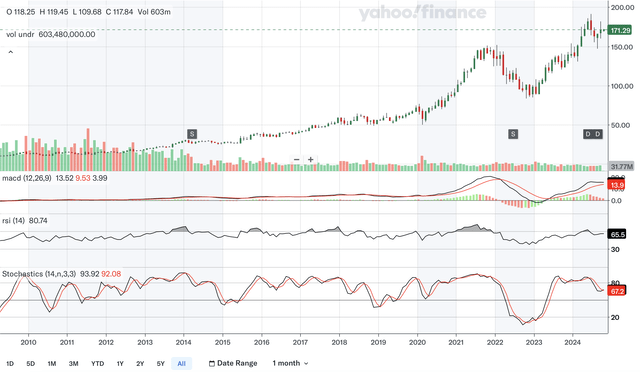
Note that the above chart is in a logarithmic scale to better reflect Alphabet’s long term trend. The stock is well within a long term upward channel that dates back to 2009. The stock did break above the upper channel line back in 2021 but that was a false breakout as the stock soon slumped all the way back down to the lower channel line. The stock hit the upper channel line earlier this year and so the pullback during the middle of this year was not so surprising. The stock has remained in the upper half of the channel since this pullback signalling that the stock is still strong. The only long term resistance would be the upper channel line. For support, the closest area would be at around 150, also identified in the weekly analysis. The lower channel line would also be support. Overall, the long term chart confirms that we are in an uptrend and that the stock is progressing well within a bullish channel.
Moving Average Analysis
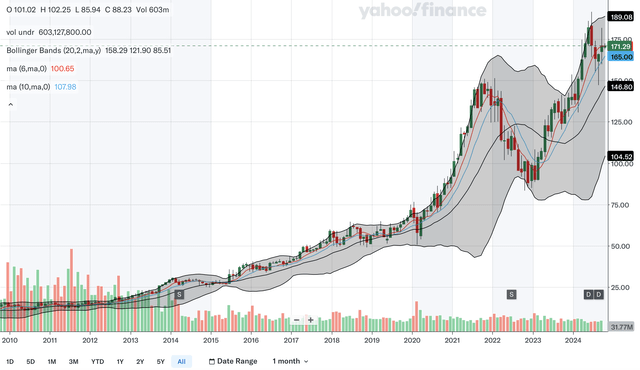
The 6 month SMA and 10 month SMA had a bullish crossover back in early 2023 and the stock has surged since that signal. After a narrowing of the gap earlier this year, the gap has widened indicating renewed bullish momentum. Lately, the 6 month SMA has stalled a bit reflecting the mid year correction. The stock currently trades right at the 6 month SMA and so support is expected very closely underneath. If you look very closely, the stock has actually just broken above this SMA already, a bullish signal. For the Bollinger Bands, the stock was touching the upper band for an extended period before the mid year pullback, again showing that the decline was not surprising as the stock was overbought. The stock did approach the 20 month midline in September but bounced off of it and is now a healthy margin above it, an indication of strength. Overall, in my view, these long term MAs are mainly bullish as the 6 month SMA’s trajectory may soon reaccelerate as the stock breaks past that SMA again.
Indicator Analysis
The MACD remains above the signal line after a bullish crossover back in early 2023. The gap has narrowed between the two lines showing a decrease in bullish momentum. Nonetheless, the bulls remain in control currently and a bearish crossover can likely still be avoided. There is a bit of negative divergence as the MACD reading, during this year’s all time high for the stock, failed to hit levels seen at the 2021 peak. This is another indication the mid year pullback was not surprising. For the RSI, it is currently at 65.5 and has held above the 50 level since early 2023, showing that the bulls have been resilient. The RSI also shows a bit of the negative divergence as it too failed to surpass the 2021 peak this year. Lastly, for the stochastics, the %K just crossed above the %D line which is a bullish signal even though it did not occur in the oversold 20 zone. Overall, I would say that these indicators remain relatively bullish but there are also some signals that should be monitored. The MACD should be monitored for a potential crossover and investors should also be on the look out for continued negative divergence if the stock returns to all time highs.
Takeaway
There were some mixed signals in the monthly analysis but once again, these analyses as a whole shows a positive technical outlook for Alphabet stock. The chart shows the stock is bound in a bullish upward channel while the moving averages were also mainly bullish. Lastly for the indicators, despite some monitoring required, there were important bullish indications shown as well.
Fundamentals & Valuation
Earnings
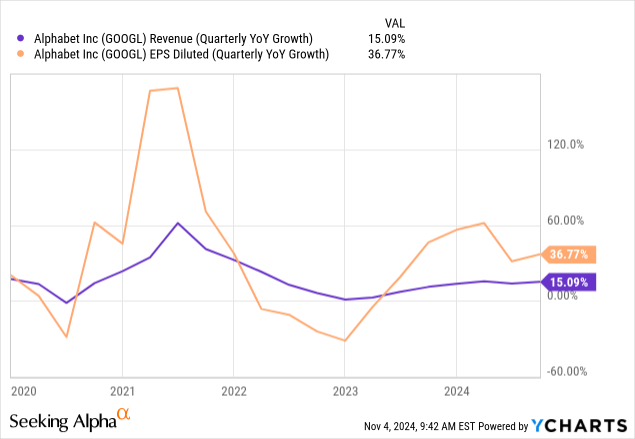
Alphabet reported their 2024 Q3 earnings in late October and showed strong results. They reported strong momentum across their business segments as they posted consolidated revenues of $88.3 billion, a 15% YoY increase. The all-important Google Cloud segment saw revenues increase by 35% YoY to $11.4 billion. They reported that they saw accelerated growth in their AI Infrastructure, Generative AI Solutions and core GCP products within their Google Cloud Platform segment. For EPS, they posted a figure of $2.12, a 37% increase YoY. Both revenue and EPS beat estimates as revenue beat by $2.05 billion and EPS beat by $0.27. Other highlights include their improvement in operating margin from 28% to 32% YoY. As shown above, although growth has remained below the 2021 pandemic boom, it has bounced back significantly from the lows of the past couple of years.
Valuation
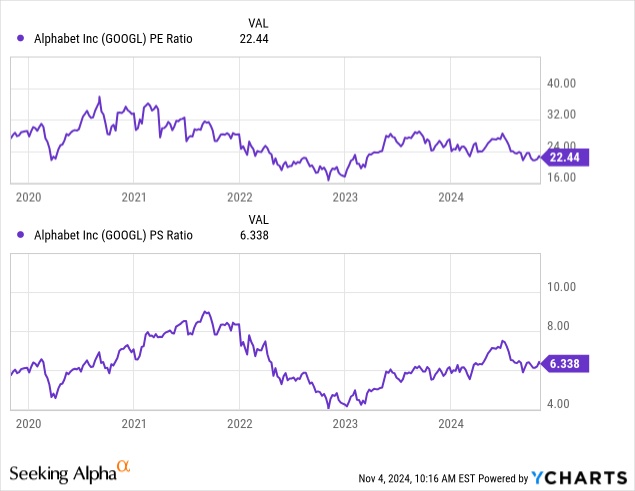
Alphabet’s P/E and P/S ratio currently sit near their average levels of the past five years. They are both well off their peaks seen during the pandemic years but have also rebounded significantly from the late 2022 lows. The P/E ratio is currently at 22 after nearing 40 in 2020 and being as low as around 16 in 2022. As for the P/S ratio, it is currently at 6.3 after being at around 9 in 2021 and being as low as around 4 back in 2022 as well. If you look at the EPS and revenue growth chart above and compare it to the P/E and P/S charts, you can see that the valuation multiples have generally risen and fallen along with the growth rates. The current relatively average growth rate in terms of the past 5 years is met with currently relatively average valuation multiples. Therefore, I believe Alphabet is currently fairly valued as it correctly reflects the business’ results. In my view, AI brings both tailwinds and headwinds for Alphabet’s business. On one hand, AI adds potential to Alphabet’s growth as they continue to add AI features to areas like Google Cloud and Gemini. But on the other hand, AI will also increase competition as companies like Perplexity and OpenAI come for Google search’s market share. I believe these tailwinds and headwinds will generally balance out and make Google’s lead in search still hard to overcome. Therefore, I would expect Alphabet to grow at average levels moving forward.
Conclusion
The technicals in all three time frames were all net positive showing that the technical outlook for the stock is bright. Alphabet remains in strong uptrends that should indicate the stock will have room to run. For the fundamentals, the most recent earnings were very strong as they reported healthy growth and beat expectations. The valuation multiples have been generally tracking the growth rate relatively well and so the current average-level P/E and P/S ratios are justified by the average-level growth rates, making the stock fairly valued. Overall, I believe investors should not be distracted too much by the Perplexity and ChatGPT Search news and should instead focus on the strong technicals and resilient fundamentals. Therefore, from my analysis, Alphabet stock is a buy at current levels.
Analyst’s Disclosure: I/we have no stock, option or similar derivative position in any of the companies mentioned, and no plans to initiate any such positions within the next 72 hours. I wrote this article myself, and it expresses my own opinions. I am not receiving compensation for it (other than from Seeking Alpha). I have no business relationship with any company whose stock is mentioned in this article.
Seeking Alpha’s Disclosure: Past performance is no guarantee of future results. No recommendation or advice is being given as to whether any investment is suitable for a particular investor. Any views or opinions expressed above may not reflect those of Seeking Alpha as a whole. Seeking Alpha is not a licensed securities dealer, broker or US investment adviser or investment bank. Our analysts are third party authors that include both professional investors and individual investors who may not be licensed or certified by any institute or regulatory body.

