Summary:
- Altria Group’s 7.5% dividend yield is already enough to make many investors fall in love.
- However, its cash dividend yield understates its return potential drastically.
- Its total shareholder yield can be irresistible.
- Once share buybacks and debt reductions are considered, I expect its TSY to potentially exceed 10%.

AngiePhotos/E+ via Getty Images
MO stock: Previous thesis and capital allocation
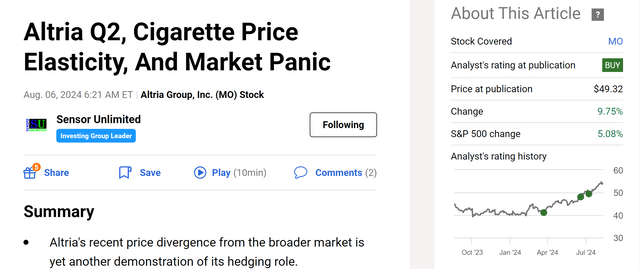
My last article on Altria Group (NYSE:MO) titled “Altria Q2, Cigarette Price Elasticity, And Market Panic” was published on Aug. 6, 2024, by Seeking Alpha. As you can see from the chart below, I rate the stock as a Buy based on the updates from its Q2 earnings report. More specifically,
I discussed Altria’s recent price divergence from the broader market and argued that this divergence is yet another demonstration of Altria’s hedging role. Furthermore, I argued that this role is very timely judging by the odds of a recession, its Q2 sales data, and the recent price elasticity data of its products. The combination of high yield and low P/E further enhances the potency of its hedging role.

Seeking Alpha
In this article, I want to examine the stock from a different perspective: Its capital allocation flexibility and total shareholder yield (“TSY”). As a poster boy of a dividend growth stock, MO’s dividend yield (currently around 7.5% as of this writing) is an anchor point underlying many bullish theses.
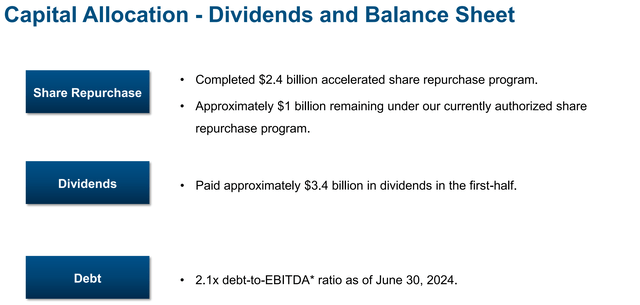
However, cash payouts are only one mechanism by which MO returns capital to shareholders. As you can see from the chart below, the company uses other mechanisms to return capital to its shareholders too. In terms of share repurchase, the company completed its $2.4 billion accelerated program in the past quarter. Additionally, it has approximately $1 billion remaining under its current authorized share repurchase program. Thus, the repurchases are about the same magnitude compared to the $3.4 billion of cash dividends paid in the last quarter. Finally, the company is also paying down its debt at a good pace, another important way of returning capital to shareholders.
Hence, I urge potential MO investors to look beyond the 7%+ dividend yield and consider its TSY, which includes cash dividends, share repurchases, and also debt reduction. Next, I will show that once all these mechanisms are considered, I expect a TSY easily exceeding 10% from the stock.

MO Q2 earnings report
MO stock: Share buybacks
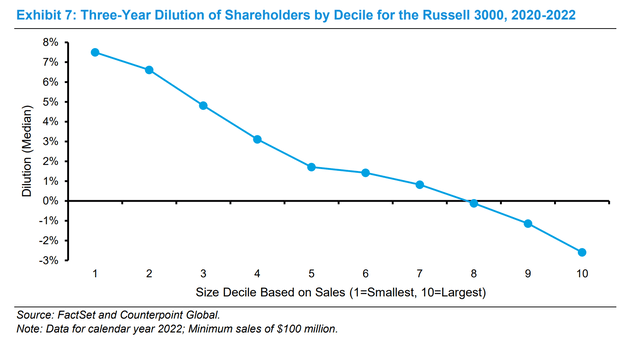
I will begin with share buybacks. First, I will provide a background to prime the more detailed discussion. The following was taken from a Morgan Stanley study, which displays the overall picture of share buybacks for companies in the Russell 3000 index. The data is organized by company market cap (in terms of decile). The key takeaways are quoted below, and the point highlighted by me is of particular interest for the case of MO in my view (and I will revisit this point later).
The companies in the smallest three deciles realized an average dilution of 6%, while the largest three deciles collectively retired equity. Share buybacks are a way to return capital to shareholders that are equivalent to dividends under strict assumptions. But unlike dividends, which treat all shareholders equally, buybacks that occur at any price other than fair value result in a wealth transfer. A company that buys back undervalued stock transfers wealth from the selling shareholders to the ongoing holders. And companies that repurchase overvalued stock transfer wealth from the ongoing shareholders to the selling shareholders.

Morgan Stanley
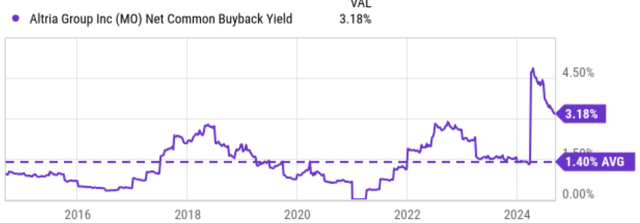
The first obvious takeaway is that the larger the company, the more likely it is that they will repurchase their shares because of their consistent and robust cash flow. This is the case with MO in the past, as you can see from the next chart below. It has been a consistent buyer of its own shares for many years. In the past decade, its average net common buyback yield is around 1.4% as seen. MO has ramped up its repurchase program in recent years as discussed earlier. With its accelerated program, the company’s current buyback yield is around 3.18%. When combined with the 7.5% cash dividend yield, the shareholder yield from these two channels already exceeds 10%.
Then there’s still the third channel that MO returns capital to shareholders: debt paydowns, as discussed next.

Seeking Alpha
MO stock: Debt paydowns
The two tables below were taken from MO’s latest cash flow statement and balance sheet.
Specifically, the first table compares the total debt issued and total debt repaid for MO stock in recent years. As seen, since 2021, the company’s total repayment has surpassed its net issuance by a noticeable gap. To wit, total debt issued decreased from about $5,472 million in 2021 to only $998 million as of TTM. In contrast, Altria repaid both its short- and long-term debt quite aggressively since 2021 as seen. As a net result, the company’s total liabilities have decreased from about $44.4 by the end of 2020 to the current $37.4B, a reduction of about $7B.
For shareholders who think like business owners, such a reduction has made the company more valuable to own/hold. Their role in shareholder return is as important, even though less visible, as cash dividend payouts and share repurchases.

Seeking Alpha

Seeking Alpha
MO stock: Valuation discounts and wealth transfer
Finally, let me revisit a point mentioned in the Morgan Stanley report earlier and argue why MO’s recent repurchases most likely represent a wealth transfer from the existing shareholders to the staying shareholders because these repurchases are very likely made at prices well below the company’s fair value.
Let me start with the commonly quoted P/E multiples. As seen from the first chart below, MO’s P/E ratios are attractive both in absolute terms (around 10x only on an FWD basis) and also in relative terms (e.g., when compared to the sector median). Moreover, I think the P/E ratio understates its valuation discounts because it ignored the debt paydown discussed above. The P/E ratio also ignores the quality of its earnings – the resilience and consistency of its earnings as detailed in my last article.
For these reasons, together with its dividend champ status, I think dividends are a much better representation of its true economic earning power and subsequently, dividend yields a better valuation metric than accounting P/E. Following this line of thinking, the second chart shows that its current yield (7.24% on a TTM basis and 7.5% on an FWD basis as I quoted above) is noticeably higher than its long-term average of 6.07%, serving as a strong indicator for a sizable discount.

Seeking Alpha

Seeking Alpha
MO stock: Other risks and final thoughts
In terms of risks, the top two key risks on my list faced by MO and its peers are regulatory changes and declining smoking rates. Government regulations can significantly impact the tobacco industry, such as increased taxes, restrictions on advertising, bans on smoking in public places, and also the approval of new products (MO’s recent JUUL debacle serves as a good example). Additionally, declining smoking rates due to public health campaigns and social changes pose a long-term threat to the industry’s revenue. Specific to MO, I expect sales from its Smokeable Products division to be under pressure due to these risks. In particular, I expect lower shipments of Marlboro and other premium and discount cigarettes. The company has also noticed the rapid spread of illicit e-vapor products. These products can create both profit headwinds and also regulatory risks for MO’s new category products.
All told, I see an overall picture dominated by the positives, both in the near and long term. In the near term, the unique nature of its products makes it a timely hedge against a potential economic downturn, judging by its latest Cigarette Price Elasticity data (the focus of my last article). In the longer term, its resilient cash flow and well-rounded capital allocation should provide robust total return potential to shareholders. Its cash dividend yield already exceeds 7% – a point that many MO investors love. However, the yield understates the return potential of the stock drastically in my view. When share repurchases and debt paydowns are considered, I expect its TSY to easily exceed 10%.
Analyst’s Disclosure: I/we have no stock, option or similar derivative position in any of the companies mentioned, and no plans to initiate any such positions within the next 72 hours. I wrote this article myself, and it expresses my own opinions. I am not receiving compensation for it (other than from Seeking Alpha). I have no business relationship with any company whose stock is mentioned in this article.
Seeking Alpha’s Disclosure: Past performance is no guarantee of future results. No recommendation or advice is being given as to whether any investment is suitable for a particular investor. Any views or opinions expressed above may not reflect those of Seeking Alpha as a whole. Seeking Alpha is not a licensed securities dealer, broker or US investment adviser or investment bank. Our analysts are third party authors that include both professional investors and individual investors who may not be licensed or certified by any institute or regulatory body.
Join Envision Early Retirement to navigate such a turbulent market.
- Receive our best ideas, actionable and unambiguous, across multiple assets.
- Access our real-money portfolios, trade alerts, and transparent performance reporting.
- Use our proprietary allocation strategies to isolate and control risks.
We have helped our members beat S&P 500 with LOWER drawdowns despite the extreme volatilities in both the equity AND bond market.
Join for a 100% Risk-Free trial and see if our proven method can help you too. You do not need to pay for the costly lessons from the market itself.

