Summary:
- This article explains why I like MO better than PM, following the so-called rule of 10xEBT (earnings before taxes).
- MO features a lower EBT multiple (only about 8.1x of its FWD EBT) than PM (about 15x).
- Thus, under Buffett’s 10x Pretax Rule, MO offers a much more compelling pretax earnings yield (over 12% vs. PM’s 6.4%).
- In the meantime, I also see higher growth prospects from MO with its higher return on capital employed.
FotografiaBasica
MO vs. PM: Previous Thesis and New Development
I last analyzed Altria Group (NYSE:MO) back in October. That article was titled “Altria: Dividends Still Don’t Lie” and argued for a Buy rating with a focus on its dividends. Quote:
For dividend champs like MO, dividends provide the most reliable insights into its true economic earnings. Given the stock’s recent dividend raise of 4%, I see a sizable margin of safety judging by the FWD yield. I anticipate the margin to further widen given the market‘s updated outlook for interest rate cuts. Despite some issues, the dominant picture I see is a highly resilient business with 10%-plus total shareholder yield trading at an attractive valuation.
As for Philip Morris International Inc. (NYSE:PM), I last covered it back in April 2024. That article was titled “Philip Morris Yields 6% But Faces Credit Downgrade Risk.” As already hinted in the title, I have more of a mixed view on the stock (quoted below) and rated it as a Hold.
Philip Morris International’s dividend yield is currently high and P/E low, indicating undervaluation. However, my concerns arise regarding the safety of the company’s dividend due to high payout ratios and debt levels. I also see a realistic chance of a credit rating downgrade in the next ~2 years or so.
Since those writings, there have been some new developments surrounding both stocks. In the remainder of this article, I will concentrate on the top one development on my list: The outcome of the presidential election. With Donald Trump’s victory in the election, I see a good chance for the “America First” agenda to materialize in the near future. Such a shift could benefit Altria more than Philip Morris in many ways. First, Altria primarily operates within the United States, whereas Philip Morris is a multinational company with a significant global presence. An “America First” policy could lead to increased domestic demand for Altria’s products and potentially favorable regulatory treatment. Second, protectionist measures under an “America First” agenda could also limit international competition for MO. And finally, I won’t be surprised by potential tax advantages for MO. An “America First” approach might include tax policies that benefit domestic companies like MO, potentially reducing their tax burden compared to multinational companies.
The final point, the tax consideration, also leads to another key attractiveness offered by MO under the current conditions. MO’s valuation is simply much more attractive than PM according to Warren Buffett’s 10x Pretax Rule, also referred to as the 10xEBT rule (earnings before taxes), as detailed next.
MO, PM, and Buffett’s 10x Pretax Rule
For readers new to the concept of 10xEBT, the first question I usually receive in the part is this: Out of all the profit measures, why pretax earnings? The detailed answers are provided in my earlier articles and a very recap is quoted below to ease reference:
First, Buffett himself paid ~10x pretax earnings for so many of his largest and best deals so it cannot be coincident.
Second, after-tax earnings do not reflect business fundamentals. Taxes can change from time to time due to factors that have no relevance to business fundamentals, such as tax law changes and capital structure change (and we will see this in a minute in the case of MO and PM).
Third, pretax earnings are easier to benchmark, say against bond earnings. The best equity investments are bond like, and when we speak of bond yield, that yield is pretax. So a 10x EBT would provide a 10% pretax earnings yield, directly comparable to a 10% yield bond.
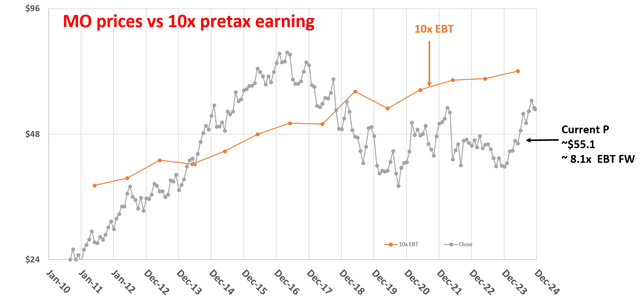
Under this background, in the next chart, I plotted MO’s historical prices (on a monthly basis) against its 10xEBT on an annual basis (the orange line). As you can see, over the long term, when stock prices have dipped well below the 10xEBT line, they are usually good entry points, and vice versa.
Looking ahead, my projection for its FWD EPS is around $5.1, and for its effective tax rates, this is around 25%. As such, my estimate for its FWD EBT is around $6.8 per share, translating into an FWD EBT multiple of only 8.1x at the current stock price of $55.1 as of this writing. As just mentioned, pretax earnings yield are more comparable to bond yields. If you subscribe to this thought, then buying a business with staying power at a price of 10xEBT is comparable to buying a bond with a 10% yield – even if its earnings stagnate indefinitely. In this case, MO’s pretax earnings yield is more than 12% already, and I also see good growth opportunities ahead as to be detailed later.
Author based on Seeking Alpha data
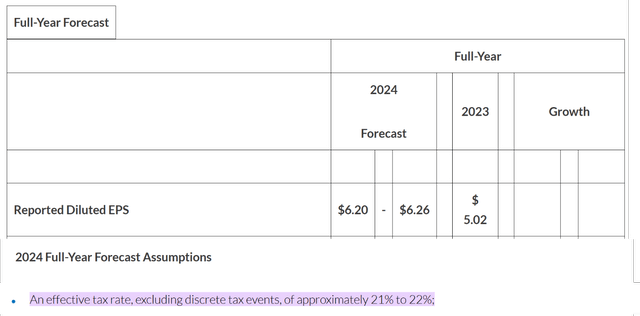
Now, let’s apply the same concepts for PM. The chart presents a full-year EPS forecast of PM for FY 2024 per its latest earnings report. As seen, its diluted EPS is projected to be in the range of $6.20 to $6.26 for FY 2024. Note that the forecast assumes an effective tax rate, excluding discrete tax events, of approximately 21% to 22%. Note that tax rates are noticeably difference from MO’s 25%, echoing the comments earlier that after-tax earnings do not always reflect business fundamentals accurately.
To be on the more aggressive side, let’s assume its EPS materializes at this high end of this range and tax rates also on the high end. These assumptions lead to an EBT forecast that is on the high end also, which works out to be $8.05 per share. At the price of this writing, PM’s stock price is around $126, thus the FWD EBT multiple is around 15.7x. The pretax earnings yield is about 6.4%, not too shabby at all, but far lower than what MO provides.
Moreover, I also have higher expectations for MO growth rate compared to PM, as detailed next.
MO vs. PM: Growth and Profitability Prospects
Also as described in my earlier writings, my method to estimate a mature company’s long-term growth rate involves the use of ROCE and reinvestment rates. Quote:
Longer-Term Growth Rate = ROCE * Reinvestment Rate
ROCE stands for the return on capital employed. ROCE considers the return of capital actually employed, and therefore provides insight into how much additional capital a business needs to invest in order to earn a given extra amount of income.
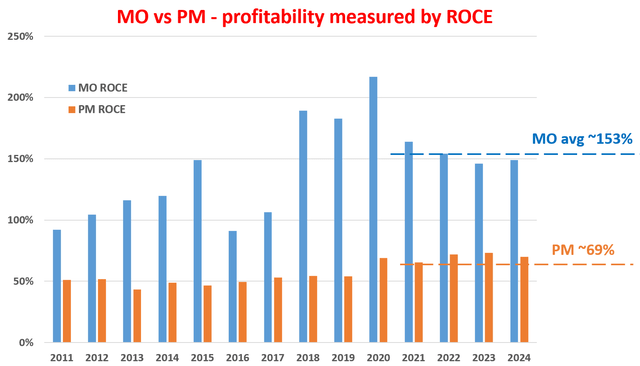
Under this context, the next chart compares the ROCE of MO and PM in the past since 2011. As seen, both companies were able to maintain quite high ROCEs in the long term. PM’s ROCE has been above 50% most of the years during this period and is on average 69% in the past four years. And MO’s ROCE is even higher, above 100% for most of the years and averaging 153% in the past four years. As a reference point, the overall economy’s ROCE is around 20% on average and the average ROCE for the FAANG stocks is around 70%.
Author based on Seeking Alpha data
As for the reinvestment rate, both PM and MO are quintessential examples of capital-light businesses. Neither of them spends too much on capital expenditures and my estimate is that PM has been maintaining a reinvestment rate of around 5% in recent years and MO around ~4%. Under these rates, I expect PM to sustainably and organically grow its earnings at about 3.5% per annum (69% ROCE* 5% reinvestment rate) and MO to grow at about 6% per annum. Note that these growth rates are organic and real growth rate. Actual growth rates could be higher due to external acquisitions and/or inflation adjustments.
These growth rates are admittedly nothing ground-shaking, especially for growth investors who are used to the growth rates from the likes of the Magnificent 7. However, per the 10xEBT, these seemingly modest growth rates are already sufficient to deliver a terrific total return for shareholders in the long term. Again, the fundamental idea here is that buying a business (i.e., from an owner’s perspective) at 10x EBT is like buying a bond with a 10% yield even if the profits do not grow. In the case of MO under current conditions, the current valuation is about 8.1x EBT only, thus comparable to owning a bond with over 12% yield and there is a good chance for a 6% annual growth in its coupon payments.
Other Risks and Final Thoughts
In terms of downside risks, the top two risks I see for both MO and PM are regulatory risks and also the declining demand for their traditional smokable products. Regulatory risks stem from potential changes in tobacco regulations, such as increased taxes, stricter advertising restrictions, or even bans on certain products.
The traditional tobacco business has been challenged by a secular demand decline industry-wide, and MO and PM are no exceptions. Looking ahead, I won’t be surprised if cigarette volumes continue to decline. Both companies are investing aggressively in smoke-free products and have made progress in this direction. For example, MO’s NJOY recently received the first and only marketing granted orders from the FDA for menthol e-vapor products.
Let me close by articulating that I’m not trying to argue that PM is a bad investment. Along the line of the 10xEBT rule, it’s a solid investment in itself. PM’s current valuation is about 15.7x of its FWD EBT, translating into a pretax yield is about 6.4%. Combined with the organic growth rate of 3.5% per annum estimate above, the total return could be easily in the double digits notionally (i.e., after inflation adjustment). My thesis is that MO is a better option, and this thesis is built on the consideration of my expected tailwinds from the incoming Trump administration, the lower EBT multiple, and also its higher ROCE and growth projection.
Analyst’s Disclosure: I/we have a beneficial long position in the shares of MO either through stock ownership, options, or other derivatives. I wrote this article myself, and it expresses my own opinions. I am not receiving compensation for it (other than from Seeking Alpha). I have no business relationship with any company whose stock is mentioned in this article.
Seeking Alpha’s Disclosure: Past performance is no guarantee of future results. No recommendation or advice is being given as to whether any investment is suitable for a particular investor. Any views or opinions expressed above may not reflect those of Seeking Alpha as a whole. Seeking Alpha is not a licensed securities dealer, broker or US investment adviser or investment bank. Our analysts are third party authors that include both professional investors and individual investors who may not be licensed or certified by any institute or regulatory body.
Join Envision Early Retirement to navigate such a turbulent market.
- Receive our best ideas, actionable and unambiguous, across multiple assets.
- Access our real-money portfolios, trade alerts, and transparent performance reporting.
- Use our proprietary allocation strategies to isolate and control risks.
We have helped our members beat S&P 500 with LOWER drawdowns despite the extreme volatilities in both the equity AND bond market.
Join for a 100% Risk-Free trial and see if our proven method can help you too. You do not need to pay for the costly lessons from the market itself.


