Summary:
- Making Altria the largest position of your dividend portfolio could help you to increase its potential for generating dividend income and reducing volatility.
- This is due to Altria’s Dividend Yield [FWD] of 7.46% and its low 24M Beta Factor of 0.16.
- In this article, I will demonstrate how you could build a $100,000 dividend portfolio across 2 ETFs and 10 dividend paying companies, while holding Altria as the largest portfolio position.
- This portfolio offers a reduced risk level, as indicated by a decreased portfolio volatility and a lowered company- and sector-specific concentration risk.
- The portfolio further integrates dividend income and dividend growth, reflected in its Weighted Average Dividend Yield [TTM] of 4.22% and 5-Year Weighted Average Dividend Growth Rate [CAGR] of 8.91%.
bmcent1
Investment Thesis
Portfolio allocation is a crucial factor that determines performance over the long term. This article will show you how to build a $100,000 dividend portfolio using 2 ETFs and 10 dividend paying companies, from which Altria (NYSE:MO) represents the largest position (when distributing the ETFs across their respective companies).
By allocating the largest proportion of your dividend portfolio to Altria, you can potentially increase its ability to generate dividend income (due to Altria’s Dividend Yield [FWD] of 7.46%), lower its volatility (as evidenced by Altria’s low 24M Beta Factor of 0.16), and reduce its downside risk (reflected in Altria’s low Valuation (P/E GAAP [FWD] Ratio of 8.97) and elevated Free Cash Flow Yield [TTM] of 8.94%).
This dividend portfolio offers the following benefits for investors:
- Strong potential for the generation of dividend income, as indicated by a Weighted Average Dividend Yield [TTM] of 4.22%.
- Strong potential for dividend growth, reflected in the portfolio’s 5-Year Weighted Average Dividend Growth Rate [CAGR] of 8.91%.
- An attractive risk-reward profile, since companies that are particularly attractive in terms of risk and reward hold an elevated proportion.
- Reduced volatility, evidenced by holding Altria (which has a 24M Beta Factor of 0.16) as the largest portfolio position.
- Reduced company-specific concentration risk, since no company accounts for more than 4% of the overall portfolio, even when distributing the selected ETFs across the companies they are invested in.
- Reduced sector-specific concentration risk as 10 of the 11 sectors account for less than 12% of the overall portfolio, indicating a reduced sector concentration.
- Reduced downside risk, due to the portfolio’s focus on companies that are financially healthy (nine of 10 individually selected companies have double-digit Net Income Margins [TTM]), and its focus on firms that can increase its earnings constantly (nine of the 10 individually selected companies have EPS Growth Rates [FWD] above 3%).
Altria
Investor Benefits when Holding Altria as the Largest Position of your Investment Portfolio
Altria, which is headquartered in Richmond, Virginia, was founded in 1822.
With a current Dividend Yield [FWD] of 7.46%, a 10-Year Dividend Growth Rate [CAGR] of 7.29%, and a P/E GAAP [FWD] Ratio of 8.97, Altria not only blends dividend income and dividend growth, it also offers investors an attractive Valuation.
Altria’s excellent competitive position is demonstrated by its strong Net Income Margin [TTM] of 50.51% (while the Sector Median stands at 4.31%), and its financial strength is confirmed through its A3 credit rating from the rating agency Moody’s.
By allocating a larger proportion of your investment portfolio to Altria you can potentially achieve the following benefits:
- Increase the Weighted Average Dividend Yield of your dividend portfolio due to Altria’s elevated Dividend Yield [FWD] of 7.46%, elevating your portfolio’s capacity to generate dividend income.
- Increase the dividend growth potential, as shown by Altria’s 10-Year Dividend Growth Rate [CAGR] of 7.29%.
- Reduce the downside risk, due to Altria’s relatively low Valuation (P/E GAAP [FWD] Ratio of 8.97) and relatively high Free Cash Flow Yield [TTM] of 8.94% (which shows that no high growth expectations are priced into the company’s stock price).
- Reduce the volatility, evidenced by Altria’s low 24M Beta Factor of 0.16.
Investor Risks when Allocating the Largest Proportion of your portfolio to Altria
It should be noted that making Altria the largest position of your investment portfolio can bring the following risks.
- Potentially limit the upside potential of your investment portfolio, evidenced by Altria’s limited growth perspective (EPS Diluted Growth [FWD] of 3.38%) and decreasing number of people who smoke.
- A dividend reduction of Altria could negatively impact the company’s stock price and your portfolio’s Total Return.
- Regulatory risk factors, such as tax increases on tobacco products, for example, can have a significant adverse impact on Altria’s financial results and – as a consequence – on the Total Return of your investment portfolio when allocating a disproportionally high percentage of your portfolio to the company.
To minimize these risks, I suggest setting an allocation limit that does not exceed 4% of your overall portfolio (even when allocating the ETFs that are part of your portfolio across the companies they are invested in).
I am following the same strategy with the dividend portfolio I am presenting today, ensuring that Altria’s proportion does not exceed 4%. Such an approach ensures an attractive risk-reward profile for your portfolio.
I have considered the following factors when determining the allocation for each company that is part of this dividend portfolio:
- The risk-reward profile of the company
- The company’s current Valuation
- The sustainability of the company’s dividend
- The company’s ability to blend dividend income with dividend growth
- The financial health of the company
- The company’s competitive advantages
- The company’s growth outlook
- The company’s competitive position within its industry
It is important to mention that I believe that the better the risk-reward profile of a company, the higher its allocation can be within the overall portfolio. Therefore, I have allocated a significantly higher proportion to some companies compared to others.
I have selected the following two ETFs for this dividend portfolio:
I believe that combining the Schwab U.S. Dividend Equity ETF™ and the JPMorgan Nasdaq Equity Premium Income ETF can be an effective strategy, since both complement each other well.
While the Schwab U.S. Dividend Equity ETF™ effectively combines dividend income and dividend growth, and prioritizes companies from the Financial Sector (20.23% of this ETF is allocated to the Financial Sector), the Health Care Sector (14.74%), the Consumer Defensive Sector (13.34%) and the Energy Sector (12.39%), JPMorgan Nasdaq Equity Premium Income ETF has a strong focus on the Technology Sector (which represents 49.42% of this ETF). The principal reason for including JEPQ is to increase the portfolio’s potential for the generation of dividend income, helping us to increase the Weighted Average Dividend Yield [TTM].
I generally suggest allocating a significantly higher proportion to the Schwab U.S. Dividend Equity ETF™ compared to the JPMorgan Nasdaq Equity Premium Income ETF, since it offers investors superior potential for dividend growth and capital appreciation.
I have followed the same strategy with this dividend portfolio, allocating 60% to the Schwab U.S. Dividend Equity ETF™ while allocating 10% to the JPMorgan Nasdaq Equity Premium Income ETF.
Additionally, I have selected the following individual companies for this dividend portfolio:
- Altria
- BB Seguridade Participações S.A. (OTCPK:BBSEY)
- VICI Properties (VICI)
- Realty Income (O)
- Ares Capital (ARCC)
- Mastercard (MA)
- Alphabet (GOOG) (GOOGL)
- Nike (NKE)
- Linde (LIN)
- Brookfield Infrastructure Partners (BIP)(BIPC)
I included Altria in this dividend portfolio to elevate the potential for generating dividend income and to reduce the volatility and downside risk. It is important to mention that I have only allocated 1.5% to Altria, since the portfolio has a 60% allocation to SCHD, which already holds a significant stake in the company. By allocating 1.5% to the individual position of Altria, we ensure that it becomes the largest portfolio position (when allocating SCHD and JEPQ across their companies) while maintaining a reduced company-specific concentration risk for our portfolio (Altria’s proportion in the overall portfolio does not exceed 4%).
I have incorporated BB Seguridade Participações S.A. to elevate the portfolio’s potential for dividend income (the company pays a Dividend Yield [TTM] of 9.07%). It is important to highlight that I suggest that you don’t allocate more than 1.5% to the company due to its elevated risk level (such as currency risk, geopolitical risk factors and the risk of a possible dividend reduction).
Mastercard and Nike have been incorporated to this dividend portfolio given their strong potential for dividend growth (5-Year Dividend Growth Rate [CAGR] of 14.87% and 10.78%, respectively) and capital appreciation. Given their attractive risk-reward profiles, I have allocated an amount of 3.5% to each of them, following my strategy to overweight companies that are attractive in terms of risk and reward.
VICI Properties and Realty Income are particularly attractive for this dividend portfolio as SCHD is not invested in the Real Estate Sector at all and JEPQ only with a small proportion (0.23% of this ETF is allocated to the Real Estate Sector). VICI Properties’ and Realty Income’s inclusion helps us to increase the portfolio’s allocation to the Real Estate Sector (the Real Estate Sector represents 7.11% of this dividend portfolio). Considering their compelling risk-reward profile, I have allocated a proportion of 3.5% to each of them.
Ares Capital and Brookfield Infrastructure Partners further help us to increase the portfolio’s capacity for generating dividend income, underlined by their Dividend Yields [TTM] of 8.92% (Ares Capital) and 4.70% (Brookfield Infrastructure Partners). Each of the companies holds a proportion of 3.50%.
Both Alphabet and Linde have been included (with a proportion of 3% each) to increase the portfolio’s allocation to the Materials and the Communication Services Sector while, simultaneously, elevating its potential for dividend growth and capital appreciation.
Overview of the Composition of This Dividend Portfolio
|
Symbol |
Name |
Sector |
Industry |
Country |
Dividend Yield [TTM] |
Dividend Growth 5 Yr [CAGR] |
Allocation in % |
Amount in $ |
|
SCHD |
Schwab U.S. Dividend Equity ETF™ |
US Equity ETF |
Large Value ETF |
United States |
3.41% |
12.00% |
60.00% |
60000 |
|
JEPQ |
JPMorgan Nasdaq Equity Premium Income ETF |
Nontraditional Equity ETF |
Derivative Income |
United States |
9.37% |
0.00% |
10.00% |
10000 |
|
MO |
Altria |
Consumer Staples |
Tobacco |
United States |
6.93% |
4.10% |
1.50% |
1500 |
|
BBSEY |
BB Seguridade Participações S.A. |
Financials |
Multi-line Insurance |
Brazil |
9.07% |
-8.40% |
1.50% |
1500 |
|
VICI |
VICI Properties |
Real Estate |
Other Specialized REITs |
United States |
5.34% |
7.66% |
3.50% |
3500 |
|
O |
Realty Income |
Real Estate |
Retail REITs |
United States |
5.47% |
3.55% |
3.50% |
3500 |
|
ARCC |
Ares Capital |
Financials |
Asset Management and Custody Banks |
United States |
8.92% |
3.84% |
3.50% |
3500 |
|
MA |
Mastercard |
Financials |
Transaction & Payment Processing Services |
United States |
0.50% |
14.87% |
3.50% |
3500 |
|
GOOG |
Alphabet |
Communication Services |
Interactive Media and Services |
United States |
0.23% |
– |
3.00% |
3000 |
|
NKE |
Nike |
Consumer Discretionary |
Footwear |
United States |
1.97% |
10.78% |
3.50% |
3500 |
|
LIN |
Linde |
Materials |
Industrial Gases |
United Kingdom |
1.47% |
4.91% |
3.00% |
3000 |
|
BIP |
Brookfield Infrastructure Partners |
Utilities |
Multi-Utilities |
United Kingdom |
4.70% |
5.87% |
3.50% |
3500 |
|
4.22% |
8.91% |
100% |
100000 |
Source: The Author, data from Seeking Alpha
Risk Analysis of This Dividend Portfolio
Risk Analysis of the Portfolio’s Company-Specific Concentration Risk When Distributing SCHD and JEPQ Across Their Companies
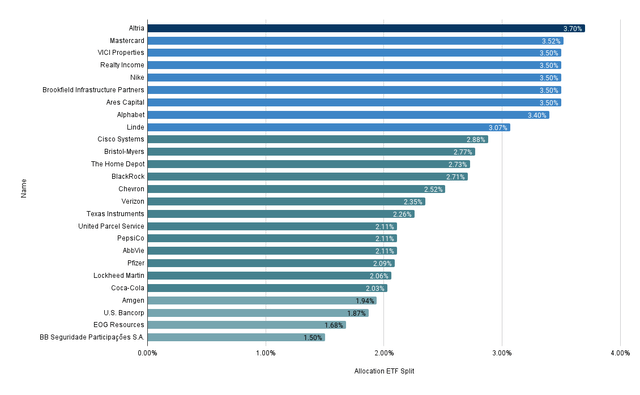
When distributing SCHD and JEPQ across the companies they are invested in, Altria represents the largest position, accounting for 3.70% of the overall portfolio. The second largest position is Mastercard, with a proportion of 3.52%.
By not allocating more than 4% to a single company (even when distributing the ETFs across their companies) and by overweighting companies with particularly attractive risk-reward profiles, we achieve a reduced risk level for this dividend portfolio.
Such an allocation approach ensures that the portfolio’s performance is not particularly dependent on a single company.
VICI Properties, Realty Income, Nike, Brookfield Infrastructure Partners, and Ares Capital represent 3.50% of the overall portfolio each.
Alphabet makes up 3.40% of this portfolio and Linde accounts for 3.07%.
All other companies represent less than 3% of the overall portfolio.
It is worth noting that the chart below only illustrates companies that represent at least 1.50% of the overall portfolio.
Source: The Author, data from Morningstar
Risk Analysis of the Portfolio’s Sector-Specific Concentration Risk When Distributing SCHD and JEPQ Across Their Sectors
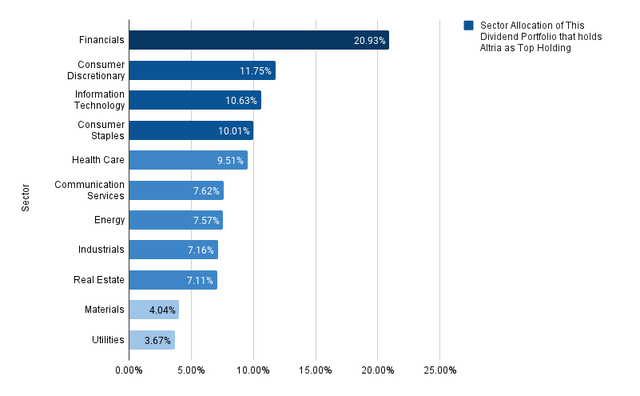
10 of the 11 sectors account for less than 12% of the overall portfolio, indicating a lowered sector-specific concentration risk when distributing both SCHD and JEPQ across the sectors they are invested in.
Only the Financials Sector (with a proportion of 20.93%) accounts for an elevated percentage of the overall portfolio, representing by far the largest sector of this dividend portfolio.
The second largest is the Consumer Discretionary Sector, accounting for 11.75%, followed by the Information Technology Sector (with 10.63%), and the Consumer Staples Sector (10.01%).
The Health Care Sector represents 9.51% of the overall portfolio, the Communication Services Sector 7.62%, the Energy Sector 7.57%, the Industrials Sector 7.16% and the Real Estate Sector 7.11%.
Source: The Author, data from Seeking Alpha and Morningstar
Risk Analysis of the 10 Individual Positions of This Dividend Portfolio
The Dividend Yield [TTM]
The portfolio’s capacity to provide you with a significant amount of dividend income is illustrated by the chart below.
It is shown that five of the 10 individually selected companies pay a Dividend Yield [TTM] above 5%.
The companies with the strongest ability to generate dividend income are BB Seguridade Participações S.A. (Dividend Yield [TTM] of 9.07%), Ares Capital (8.92%), Altria (6.93%), Realty Income (5.47%), and VICI Properties (5.34%).
Source: The Author, data from Seeking Alpha![Dividend Yield [TTM]](https://static.seekingalpha.com/uploads/2024/12/14/55029283-17341876730289843.png)
5-Year Dividend Growth Rate [CAGR]
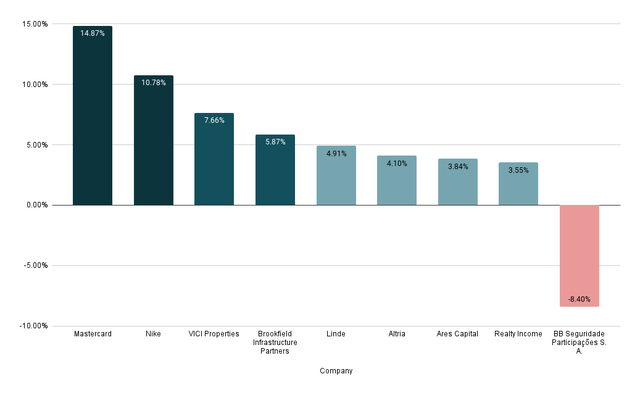
The strong dividend growth potential of this dividend portfolio is not only achieved by allocating 60% to SCHD (the ETF exhibits a 5-Year Dividend Growth Rate [CAGR] of 12.00%), but also by eight of the 10 individually selected companies offering a 5-Year Dividend Growth Rate [CAGR] above 3%.
The companies with the highest 5-Year Dividend Growth Rates [CAGR] are Mastercard (14.87%), Nike (10.78%), VICI Properties (7.66%), and Brookfield Infrastructure Partners (5.87%), making them strategically important components to elevate the portfolio’s dividend growth potential.
Source: The Author, data from Seeking Alpha
The Payout Ratios [TTM]
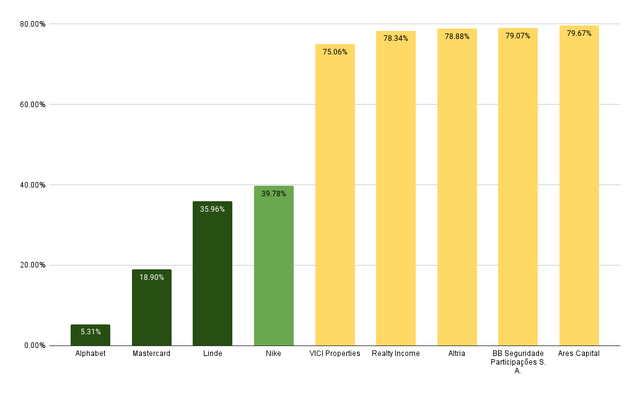
The dividend growth potential of this dividend portfolio is not only underlined by the companies’ elevated 5-Year Dividend Growth Rates [CAGR], but also by their attractive Payout Ratios.
It can be noted that four companies exhibit Payout Ratios below 40%, indicating strong dividend growth potential: Alphabet (with a Payout Ratio of 5.31%), Mastercard (18.90%), Linde (35.96%), and Nike (39.78%).
Source: The Author, data from Seeking Alpha
5-Year Revenue Growth Rate [CAGR]
The growth perspective of this dividend portfolio is underlined by the companies’ elevated 5-Year Revenue Growth Rates [CAGR].
Each of the individually selected companies has shown a positive 5-Year Revenue Growth Rate [CAGR].
Additionally, it is worth mentioning that nine of 10 companies have produced a 5-Year Revenue Growth Rate [CAGR] above 4%. Seven companies even exhibit double-digit 5-Year Revenue Growth Rates [CAGR], reflecting their strong growth perspective.
The companies with double-digit 5-Year Revenue Growth Rates [CAGR] are VICI Properties (33.92%), Realty Income (28.40%), Brookfield Infrastructure Partners (26.41%), Alphabet (16.99%), Ares Capital (14.59%), BB Seguridade Participações S.A. (14.24%), and Mastercard (10.84%).
Source: The Author, data from Seeking Alpha![5-Year Revenue Growth Rate [CAGR]](https://static.seekingalpha.com/uploads/2024/12/14/55029283-1734187864965183.png)
EPS Growth Rates [FWD]
The portfolio’s strong potential for dividend growth and capital appreciation is further underlined by the increased EPS Growth Rates [FWD] of the 10 individually selected companies.
Six of the 10 companies exhibit double-digit EPS Growth Rates [FWD]: Brookfield Infrastructure Partners (EPS Growth Rate [FWD] of 55.85%), VICI Properties (29.19%), Alphabet (25.16%), Ares Capital (22.68%), Mastercard (15.30%), and Linde (11.34%).
Source: The Author, data from Seeking Alpha![EPS Growth Rates [FWD]](https://static.seekingalpha.com/uploads/2024/12/14/55029283-17341879432301617.png)
Net Income Margins [TTM]
The reduced risk level of this dividend portfolio is further evidenced by the strong financial health of the individually selected companies.
It can be noted that nine of 10 companies exhibit double-digit Net Income Margins [TTM], as illustrated by the chart below.
Source: The Author, data from Seeking Alpha![Net Income Margin [TTM]](https://static.seekingalpha.com/uploads/2024/12/14/55029283-17341880085141363.png)
Conclusion
Allocating an elevated proportion of your dividend portfolio to Altria can bring you a range of benefits, such as increased potential for generating dividend income and dividend growth, a reduced downside risk (evidenced by Altria’s low Valuation (P/E GAAP [FWD] Ratio of 8.97) and elevated Free Cash Flow Yield [TTM] of 8.94%), and a decreased portfolio volatility (Atria has a 24M Beta Factor of 0.16).
This dividend portfolio that holds Altria as the largest position offers you a Weighted Average Dividend Yield [TTM] of 4.22%, along with a 5-Year Weighted Average Dividend Growth Rate [CAGR] of 8.92%, suggesting that it effectively integrates dividend income and dividend growth.
This means that when investing an amount of $100,000, the portfolio could potentially generate a dividend income of $4,220 before taxes in the first year. Given the portfolio’s strong potential for dividend growth (underlined by its 5-Year Weighted Average Dividend Growth Rate [CAGR] of 8.92% and the relatively high EPS Growth Rates [FWD] of most of the individually selected companies), you could potentially be able to increase the dividend payments year after year to a significant degree.
Investing the amount of $100,000 and assuming an Average Dividend Growth Rate of 8.92% (which is based on the portfolio’s 5-Year Weighted Average Dividend Growth Rate [CAGR] of 8.92%) for the next 20 years, would mean potentially generating a dividend income before taxes of $6,469.20 in 5 years, $9,917.19 in 10 years, $15,202.92 in 15 years, and $23,305.86 in 20 years.
Such a scenario could be possible thanks to the effective and balanced combination of dividend income and dividend growth of this dividend portfolio. This calculation of the dividend payments has assumed that the companies can maintain their 5-Year Average Dividend Growth Rate. It is important to note that changing assumptions would result in differing dividend payments.
What is particularly attractive when implementing such a dividend portfolio is that it not only effectively combines dividend income and dividend growth, but also allows you to benefit from capital appreciation. This is thanks to the careful selection process of companies that are able to increase their earnings over the long term and their strong dividend growth potential.
Next week, I plan to publish an article about my latest acquisition for The Dividend Income Accelerator Portfolio, which might interest you if you are considering implementing an investment approach that balances dividend income and dividend growth.
Author’s Note: Feel free to share your thoughts on this dividend portfolio. I would love to hear your thoughts on this analysis. Do you own any of the companies in this portfolio? Are there other companies you would suggest adding to this dividend portfolio?
Editor’s Note: This article discusses one or more securities that do not trade on a major U.S. exchange. Please be aware of the risks associated with these stocks.
Analyst’s Disclosure: I/we have a beneficial long position in the shares of ALTRIA, SCHD, O, VICI, ARES CAPITAL, MA, GOOG, NKE, LIN either through stock ownership, options, or other derivatives. I wrote this article myself, and it expresses my own opinions. I am not receiving compensation for it (other than from Seeking Alpha). I have no business relationship with any company whose stock is mentioned in this article.
Seeking Alpha’s Disclosure: Past performance is no guarantee of future results. No recommendation or advice is being given as to whether any investment is suitable for a particular investor. Any views or opinions expressed above may not reflect those of Seeking Alpha as a whole. Seeking Alpha is not a licensed securities dealer, broker or US investment adviser or investment bank. Our analysts are third party authors that include both professional investors and individual investors who may not be licensed or certified by any institute or regulatory body.
