Summary:
- We conducted an expense analysis on Amazon’s operating expenses in 2022 and deduced that wage growth was the biggest cause for its increase in technology and content and SG&A expenses.
- Though, Amazon’s biggest contributor to its net loss of $2.4 bln was its investment in Rivian, which suffered a loss of $12.7 bln.
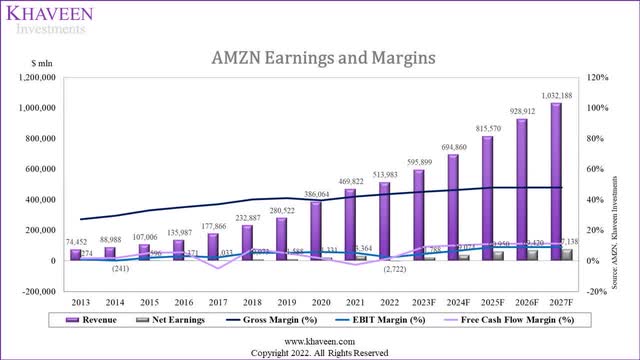
- Going forward, we expect its profitability to gradually improve and modeled a 5-year forward net margin and FCF margin of 6.34% and 10.6%, respectively.
- We believe this translates to a huge potential upside for Amazon, indicating there is much left to gain for this Mega-Cap blue chip stock.
HJBC
In the following analysis of Amazon.com, Inc (NASDAQ:AMZN), we shall delve into the factors underlying its negative net income in 2022 and present a forward-looking outlook based on two key considerations. Firstly, we shall examine the sustainability of its significant revenue growth across major segments. Secondly, we shall evaluate the sustainability of its high margins, particularly in relation to AWS.
Negative Income in 2022
|
Amazon Earnings & Margins ($ mln) |
2018 |
2019 |
2020 |
2021 |
2022 |
|
Revenue |
232,887 |
280,522 |
386,064 |
469,822 |
513,983 |
|
Cost of Sales |
123,815 |
143,747 |
208,127 |
237,911 |
246,910 |
|
Gross Profit |
93,731 |
114,986 |
152,757 |
197,478 |
225,152 |
|
Earnings Before Interest & Taxes (EBIT) |
12,421 |
14,541 |
22,899 |
24,879 |
12,248 |
|
Interest Income |
440 |
832 |
555 |
448 |
989 |
|
Interest Expense |
(1,417) |
(1,600) |
(1,647) |
(1,809) |
(2,367) |
|
Other Income (Expenses) |
(183) |
203 |
2,371 |
14,633 |
(16,806) |
|
Net Income |
10,073 |
11,588 |
21,331 |
33,364 |
(2,722) |
|
Revenue Growth % |
30.9% |
20.5% |
37.6% |
21.7% |
9.4% |
|
Gross Margin (%) |
40.2% |
41.0% |
39.6% |
42.0% |
43.8% |
|
EBIT Margin (%) |
2.3% |
5.3% |
5.2% |
5.9% |
5.3% |
|
Net Margin (%) |
4.3% |
4.1% |
5.5% |
7.1% |
-0.5% |
|
Free Cash Flow Margin (%) |
7.8% |
5.0% |
1.6% |
-2.6% |
1.7% |
Source: Amazon, Khaveen Investments
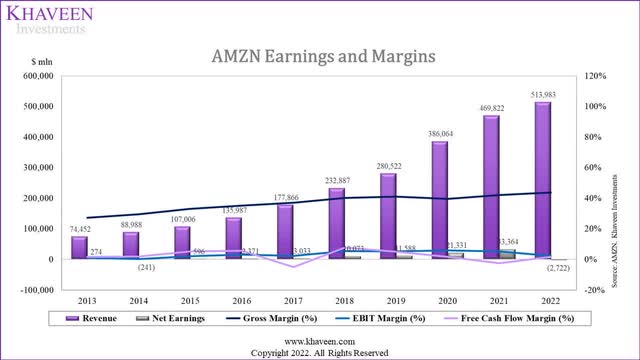
From the table above, Amazon’s gross margins have been increasing gradually, reaching an all-time high of 43.8% in 2022, with a 5-year average of 41.3%. In 2022, however, EBIT margins decreased to 5.3% and its net margins were negative at -0.5%, below their 3-year averages of 5.5% and 4.0% respectively.
Although gross profit increased by 14.0% in 2022, its EBIT dropped by 50.8%. Coupled with a huge loss of $16.8 bln in other expenses, Amazon had a net loss in 2022. In the following parts, we explain the reasons for the dip in EBIT and the reasons for its net loss.
|
Amazon Expenses (as a % of Revenue) |
2017 |
2018 |
2019 |
2020 |
2021 |
2022 |
|
Cost of Sales (Excluding Shipping) |
50.7% |
47.9% |
45.5% |
44.6% |
41.6% |
39.9% |
|
Shipping Costs |
12.2% |
11.9% |
13.5% |
15.8% |
16.3% |
16.2% |
|
Fulfillment |
14.2% |
14.6% |
14.3% |
15.2% |
16.0% |
16.4% |
|
Technology and Content |
12.7% |
12.4% |
12.8% |
11.1% |
11.9% |
14.2% |
|
SG&A Expenses |
7.7% |
7.8% |
8.6% |
7.4% |
8.8% |
10.5% |
|
Other Operating Expenses (Income) |
0.1% |
0.1% |
0.1% |
0.0% |
0.0% |
0.2% |
|
Total Operating Expenses |
97.7% |
94.7% |
94.8% |
94.1% |
94.7% |
97.6% |
|
Interest Income |
-0.1% |
-0.2% |
-0.3% |
-0.1% |
-0.1% |
-0.2% |
|
Interest Expenses |
0.5% |
0.6% |
0.6% |
0.4% |
0.4% |
0.5% |
|
One-off Expenses (Income) |
-0.2% |
0.1% |
-0.1% |
-0.6% |
-3.1% |
3.3% |
|
Total Expenses |
97.9% |
95.2% |
95.0% |
93.7% |
91.9% |
101.2% |
Source: Amazon, Khaveen Investments
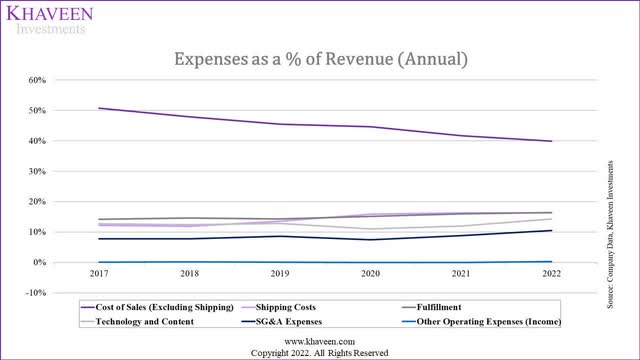
From the chart, Amazon’s cost of sales has continued to decline as a % of revenue from 41.6% in 2021 to 39.9% in 2022; whereas other expenses, such as shipping costs, fulfillment and other operating expenses (income) have remained relatively constant. However, technology and content and SG&A expense has increased significantly in 2022, from 11.9% to 14.2% and 8.8% and 10.5% respectively. Thus, total operating expenses increased by 2.9% as a % of revenue in 2022. The increase of one-off expenses by 6.4% led to total expenses being 101.2% of its total revenue.
Hence, the biggest differences in the 2021 and 2022 expenses were caused by:
- Cost of sales from 41.6% to 39.9%
- Technology and content expenses from 11.9% to 14.2%
- SG&A expenses from 8.8% to 10.5%
- One-off Expenses from -3.1% to 3.3%
|
Amazon Operating Margins % |
2018 |
2019 |
2020 |
2021 |
2022 |
Average |
|
North America |
5.1% |
4.1% |
3.7% |
2.6% |
-0.9% |
2.9% |
|
International |
-3.3% |
-2.3% |
0.7% |
-0.7% |
-6.6% |
-2.4% |
|
AWS |
28.4% |
26.3% |
29.8% |
29.8% |
28.5% |
28.6% |
|
Total |
5.3% |
5.2% |
5.9% |
5.3% |
2.4% |
4.8% |
Source: Amazon, Khaveen Investments
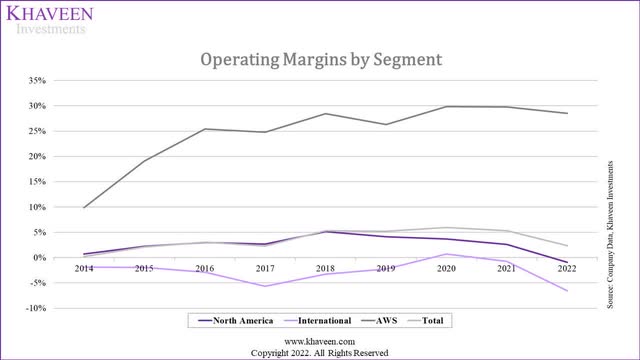
Based on the company’s annual report, Amazon’s margins for its 3 reportable segments have declined in 2022 with the North America and International segments having negative margins, though AWS remained its most profitable segment with the highest margins (28.5%) which was in line with its 5-year average but a slight 0.9% decrease from 2021. However, North America and International operating margins decreased by 3.5% and 5.9% to -0.9% and -6.6% respectively. Thus, the increase in operating expenses is more likely to be in Amazon’s other revenue segments (Online stores, physical stores, retail third-party seller services, subscription services and advertising services) than AWS.
Cost of Sales
Cost of sales (excluding shipping) as a % of revenue decreased in 2022 by 1.7%. However, this is unsurprising considering it has decreased continuously over the past 5 years by an average of 2.2% per year, which we attribute to economies of scale and its shift towards 3P in e-commerce. Thus, we can rule out that the cost of sales resulted in a drop in EBIT.
Technology and Content
|
Expense Analysis ($ mln) |
2017 |
2018 |
2019 |
2020 |
2021 |
2022 |
|
Technology and Content |
22,650 |
28,837 |
35,932 |
42,708 |
56,052 |
73,213 |
|
Growth % |
27.3% |
24.6% |
18.9% |
31.2% |
30.6% |
|
|
% of Revenue |
12.7% |
12.4% |
12.8% |
11.1% |
11.9% |
14.2% |
Source: Amazon, Khaveen Investments
Next, we analyzed the company’s Technology and Content Expenses which increased from 11.9% in 2021 to 14.2% in 2022. Based on Amazon’s annual report about Technology and Content Expenses, we believe it consists of 3 main components which are:
- Payroll related to research and development (R&D): “Technology and content costs include payroll and related expenses for employees involved in the research and development of new and existing products and services, development, design…”
- Curation of products and services for Online Stores: “…maintenance of our stores, curation and display of products and services made available in our online stores…”
- Infrastructures costs for AWS and other Amazon businesses: “…and infrastructure costs. Infrastructure costs include servers, networking equipment, and data center related depreciation and amortization, rent, utilities, and other expenses necessary to support AWS and other Amazon businesses.” – Amazon Annual Report 2022
An increase in technology and content expenses for AWS is not unexpected due to its high revenue growth (28.8%) in 2022. As AWS grows, we expect an increase in depreciation and amortization costs of infrastructure, servers, networking equipment and data centers as well as its payroll related to R&D costs. Since AWS’s margins remained relatively similar to its 5-year average, this leads us to believe that AWS was not the reason for the unexpected increase in technology and content expenses.
To find out the growth of related expenses related to R&D, we analyzed the number of patent publications in 2022 which was 3,286, a decrease from 3,517 patent publications in 2021. This led us to believe that expenses related to R&D would have declined and thus would not have led to an increase in expenditure for technology and content.
As a result, we look towards the last 2 components of technology and content costs which are infrastructure costs of non-AWS Products and payroll.
The increase in technology and content costs is primarily due to an increase in spending on technology infrastructure and increased payroll and related costs associated with technical teams responsible for expanding our existing products and services and initiatives to introduce new products and service offerings. – Amazon Annual Report 2022
According to Auxis, “tech job salaries increased 6.7% in the first half of 2022″. Battling for tech talent, Amazon “boosted their corporate and tech base pay from $160,000 to $350,000″ in February 2022. As a result, the sharp increase in tech and content expenses is likely due to the increase in the payroll of their technology and content staff.
|
Amazon Stock-Based Compensation ($ mln) |
2017 |
2018 |
2019 |
2020 |
2021 |
2022 |
Average |
|
Revenue |
135,987 |
177,866 |
232,887 |
280,522 |
386,064 |
469,822 |
|
|
Cost of Sales |
47 |
73 |
149 |
283 |
540 |
757 |
|
|
Growth % |
55.3% |
104.1% |
89.9% |
90.8% |
40.2% |
||
|
% of Revenue |
0.0% |
0.0% |
0.1% |
0.1% |
0.1% |
0.2% |
0.1% |
|
Fulfillment |
911 |
1,121 |
1,182 |
1,357 |
1,946 |
2,745 |
|
|
Growth % |
23.1% |
5.4% |
14.8% |
43.4% |
41.1% |
||
|
% of Revenue |
0.7% |
0.6% |
0.5% |
0.5% |
0.5% |
0.6% |
0.5% |
|
Technology and Content |
2,305 |
2,888 |
3,725 |
5,061 |
6,645 |
10,621 |
|
|
Growth % |
25.3% |
29.0% |
35.9% |
31.3% |
59.8% |
||
|
% of Revenue |
1.7% |
1.6% |
1.6% |
1.8% |
1.7% |
2.3% |
1.8% |
|
Sales and Marketing |
511 |
769 |
1,135 |
1,710 |
2,530 |
3,875 |
|
|
Growth % |
50.5% |
47.6% |
50.7% |
48.0% |
53.2% |
||
|
% of Revenue |
0.4% |
0.4% |
0.5% |
0.6% |
0.7% |
0.8% |
0.6% |
|
General and Administrative |
441 |
567 |
673 |
797 |
1,096 |
1,623 |
|
|
Growth % |
28.6% |
18.7% |
18.4% |
37.5% |
48.1% |
||
|
% of Revenue |
0.3% |
0.3% |
0.3% |
0.3% |
0.3% |
0.3% |
0.3% |
|
Total Stock-Based Compensation |
4,215 |
5,418 |
6,864 |
9,208 |
12,757 |
19,621 |
|
|
Growth % |
28.5% |
26.7% |
34.1% |
38.5% |
53.8% |
||
|
% of Revenue |
3.1% |
3.0% |
2.9% |
3.3% |
3.3% |
4.2% |
3.4% |
Source: Amazon, Khaveen Investments
From the table, stock-based compensation as a % of revenue increased the most for technology and content expenses, from $6.65 bln in 2021 (1.7% of revenue) to $10.6 bln in 2022 (2.3% in revenue). Cost of sales, fulfillment and sales and marketing expenses increased by 0.1% as a % of revenue whereas general and administrative remained constant, indicating that the increase in stock-based compensation was driven primarily by the 0.6% increase in technology and content costs.
SG&A Expenses
|
Amazon Expense Analysis ($ mln) |
2017 |
2018 |
2019 |
2020 |
2021 |
2022 |
|
Advertising and Other Promotional Costs |
6,300 |
8,200 |
11,000 |
10,900 |
16,900 |
20,600 |
|
Growth % |
30.2% |
34.1% |
-0.9% |
55.0% |
21.9% |
|
|
% of Revenue |
3.5% |
3.5% |
3.9% |
2.8% |
3.6% |
4.0% |
|
Payroll and Related Expenses |
3,768 |
5,614 |
7,879 |
11,110 |
15,651 |
21,638 |
|
Growth % |
49.0% |
40.3% |
41.0% |
40.9% |
38.3% |
|
|
% of Revenue |
2.1% |
2.4% |
2.8% |
2.9% |
3.3% |
4.2% |
|
Total Sales and Marketing |
10,068 |
13,814 |
18,879 |
22,010 |
32,551 |
42,238 |
|
Growth % |
37.2% |
36.7% |
16.6% |
47.9% |
29.8% |
|
|
% of Revenue |
5.7% |
5.9% |
6.7% |
5.7% |
6.9% |
8.2% |
|
General and Administrative |
3,673 |
4,336 |
5,203 |
6,668 |
8,823 |
11,891 |
|
Growth % |
18.1% |
20.0% |
28.2% |
32.3% |
34.8% |
|
|
% of Revenue |
2.1% |
1.9% |
1.9% |
1.7% |
1.9% |
2.3% |
|
Total SG&A |
13,741 |
18,150 |
24,082 |
28,678 |
41,374 |
54,129 |
|
Growth % |
32.1% |
32.7% |
19.1% |
44.3% |
30.8% |
|
|
% of Revenue |
7.7% |
7.8% |
8.6% |
7.4% |
8.8% |
10.5% |
Source: Amazon, Khaveen Investments
According to Amazon’s annual report, total expenses related to sales and marketing increased from 6.9% of revenue ($32.6 bln) to 8.2% of revenue ($42.2 bln) in 2022. The definition of the various SG&A expenses is stated below:
- Advertising and other promotional costs: “Sales and marketing costs include advertising… We direct customers to our stores primarily through a number of marketing channels, such as our sponsored search, social and online advertising, television advertising…” – Amazon Annual Report 2022
- Payroll and related expenses: “…payroll and related expenses for personnel engaged in marketing and selling activities, including sales commissions related to AWS, third party customer referrals and other initiatives. Our marketing costs are largely variable, based on growth in sales and changes in rates. To the extent, there is increased or decreased competition for these traffic sources, or to the extent our mix of these channels shifts, we would expect to see a corresponding change in our marketing costs.” – Amazon Annual Report 2022
- General and administrative: “General and administrative expenses primarily consist of costs for corporate functions, including payroll and related expenses; facilities and equipment expenses, such as depreciation and amortization expense and rent; and professional fees.” – Amazon Annual Report 2022
An increase in advertising and other promotional expenses can be observed in the table above, from $16.9 bln in 2021 (3.6% of revenue) to $20.6 bln in 2022 (4.0% of revenue). For general and administrative expenses, there was a slight increase in expenses from $8.8 bln in 2021 (1.9% of revenue) to $11.9 bln in 2022 (2.3% of revenue).
The increase in sales and marketing costs in absolute dollars in 2022, compared to the prior year, is primarily due to increased payroll and related expenses for personnel engaged in marketing and selling activities and higher marketing spend. – Amazon Annual Report 2022
However, payroll and related expenses experienced the biggest increase in expenses out of the 3 components, increasing from $15.7 bln in 2021 (3.3% of revenue) to $21.6 bln in 2022 (4.2% of revenue).
|
Office and Admin Support Growth % |
2017 |
2018 |
2019 |
2020 |
2021 |
2022 |
Average |
|
Wage Growth for Office and Admin Support |
2.67% |
3.26% |
3.21% |
2.72% |
3.57% |
5.42% |
3.64% |
Source: FRED, Khaveen Investments
Out of the 3 components of SG&A expenses, payroll and related expenses had the sharpest increase between 2021 and 2022 at 0.9% of revenue, compared to advertising and other promotional expenses and general and administrative expenses, each with an increase of 0.4% of revenue. We believe that payroll is the primary cost in these 3 components and increases in expenses across the components are due to the wage growth of office and administrative support of 5.42% in 2022 compared to 3.57% in 2021.
One-off Expenses (Income)
Under one-off expenses (income), Amazon suffered a $16.8 bln loss where it primarily records the gains or losses of equity securities valuations, adjustments, equity warrant valuations and foreign exchange.
Amazon’s shareholdings in Rivian (RIVN) maintained relatively constant, holding about 16.6% of voting power at the end of 2021 as mentioned in Rivian’s 2021 annual report. As of February 2023, Amazon has seemingly not divested its share in Rivian, holding about 158.4 mln shares, representing about 17.2% of the company.
Since Amazon has ownership of less than 20% of Rivian, the marketable securities are recorded in Amazon’s balance sheet at fair value “based on quoted prices in active markets for identical assets or liabilities” from Amazon’s annual report. Since Amazon’s investment in Rivian never exceeded 20%, it shall be recorded at fair value in Amazon’s balance sheet. Amazon’s equity investment in Rivian suffered an 81.7% drop in its share price since its IPO in November 2021. Comparatively, the S&P500 only suffered an 18.1% drop during the same period in 2022.
|
Marketable Securities ($ mln) |
2017 |
2018 |
2019 |
2020 |
2021 |
2022 |
|
Marketable Securities |
10,464 |
9,500 |
18,929 |
42,274 |
59,829 |
16,138 |
|
Growth % |
-9.2% |
99.3% |
123.3% |
41.5% |
-73.0% |
Source: Amazon, Khaveen Investments
Included in one-off expenses, net in 2021 and 2022 is a marketable equity securities valuation gain (loss) of $11.8 billion and $(12.7) billion from our equity investment in Rivian. – Amazon Annual Report 2022
After conducting an expenses analysis, we determined that the increase in payroll costs in technology and content expenses and SG&A expenses caused a sharp increase in operating expenses which resulted in a decrease in EBIT. Wage growth of 6.7% for tech workers and 5.4% for office and administrative staff resulted in increased expenses for their respective segments – a 2.3% increase as a % of revenue for technology and content expenses and a 1.7% increase as a % of revenue for SG&A expenses. Even though this was slightly offset by the improving margins from the cost of sales by 1.7% as a % of revenue, total operating expenses increased by 2.9% to 97.6% in 2022. However, it was the one-off expenses of $16.8 bln contributed mainly by investment losses in Rivian that primarily resulted in a huge loss for Amazon in 2022, causing it to end the year with a net loss of $2.7 bln.
Slowing Growth But Still Double-Digit
|
Amazon Revenue by Products ($ bln) |
2018 |
2019 |
2020 |
2021 |
2022 |
Average |
Our 2022 Forecast |
|
Online stores |
123.0 |
141.3 |
197.4 |
222.1 |
220.0 |
203.97 |
|
|
Growth % |
13.5% |
14.8% |
39.7% |
12.5% |
-0.9% |
15.9% |
-8.15% |
|
Physical stores |
17.2 |
17.2 |
16.2 |
17.1 |
19.0 |
18.2 |
|
|
Growth % |
196.9% |
-0.2% |
-5.6% |
5.2% |
11.1% |
41.5% |
6.60% |
|
Retail third-party seller services |
42.8 |
53.8 |
80.5 |
103.4 |
117.7 |
129.2 |
|
|
Growth % |
34.1% |
25.8% |
49.7% |
28.5% |
13.9% |
30.4% |
25.03% |
|
Subscription services |
14.2 |
19.2 |
25.2 |
31.8 |
35.2 |
39.49 |
|
|
Growth % |
45.8% |
35.6% |
31.2% |
26.0% |
10.9% |
29.9% |
24.32% |
|
AWS |
25.7 |
35.0 |
45.4 |
62.2 |
80.1 |
88.3 |
|
|
Growth % |
47.0% |
36.5% |
29.5% |
37.1% |
28.8% |
35.8% |
41.92% |
|
Advertising services |
12.6 |
19.8 |
31.2 |
37.7 |
41.93 |
||
|
Growth % |
56.6% |
57.6% |
21.1% |
45.1% |
34.56% |
||
|
Other |
10.1 |
1.5 |
1.7 |
2.2 |
4.2 |
2.7 |
|
|
Growth % |
117.4% |
-85.6% |
15.1% |
29.5% |
95.2% |
34.3% |
22.30% |
|
Total |
232.9 |
280.5 |
386.1 |
469.8 |
514.0 |
523.76 |
|
|
Total Growth % |
30.9% |
20.4% |
37.6% |
21.7% |
9.4% |
24.0% |
11.48% |
Source: Amazon, Khaveen Investments
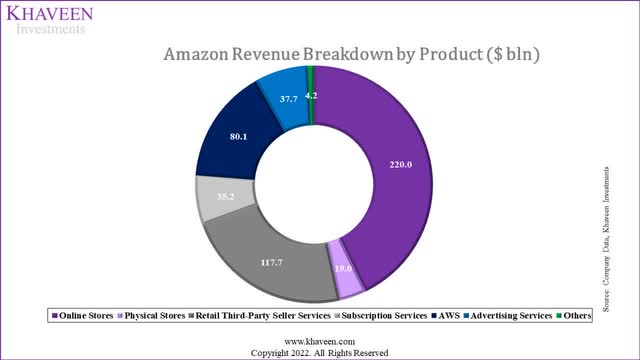
From the table above, all segments of Amazon grew in revenue except Online Stores, where revenue decreased by 0.9%. Based on 5-year average revenue growth, Advertising Services grew the most followed by Physical. Online Stores still made up most of its revenue, followed by Retail Third-Party Seller Services then AWS. Overall, the company’s growth slowed down in 2022 at 9.4% YoY compared to its 5-year average of 24%. In comparison, our revenue forecast of 11.48% was in line with its actual growth rate. Its lower growth rate is due to lower growth in retail third-party seller services, AWS, subscription services and advertising which was below our forecast. Though, online stores’ revenue growth was above our forecast.
Online Stores
eMarketer, Amazon, Khaveen Investments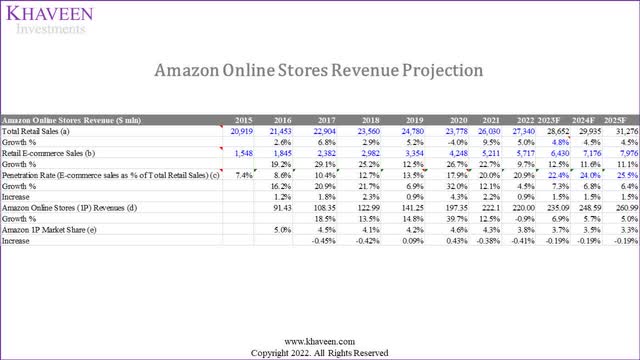
*b = a × c, d = c × e
We updated our revenue forecast for Amazon’s online stores (1P) revenue from our previous analysis. According to SDG Group, global retail sales growth is forecasted to increase by 4.8% in 2023 compared to 5% in the prior year. We forecasted the penetration rate of e-commerce as a % of total retail sales to increase at a 6-year average (excluding 2020) of 1.5% per year through 2025 reaching 25.5%. Its decrease in the drop of revenue by 0.9% is due to its decrease in market share of 0.4% in 2022, coupled with a market-wide decrease in e-commerce sales in 2022.
eMarketer, Khaveen Investments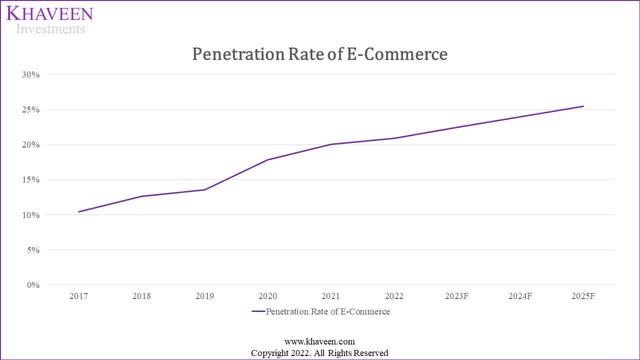
Based on this, we forecasted e-commerce sales to reach $6.4 tln in 2023 which is a growth of 12.5% compared to 9.7% in the prior year and a forward average of 11.7% which is lower compared to the past 7-year average of 20.7% as we expect lower growth in the penetration rate of e-commerce due to the higher penetration levels in the future compared to the past.
According to Kasikorn Research Center, e-commerce sales’ slowing growth is due to “market saturation in the wake of the pandemic coupled with high inflation”. Thus, as we continue to project the increase in penetration rate based on 1.5%, we see the growth in penetration rate slowly declining from 7.3% in 2023 to 6.4% by 2025. This is lower than the past 6-year penetration rate growth of 13.7% which is why the forward e-commerce sales growth is also lower than in the past.
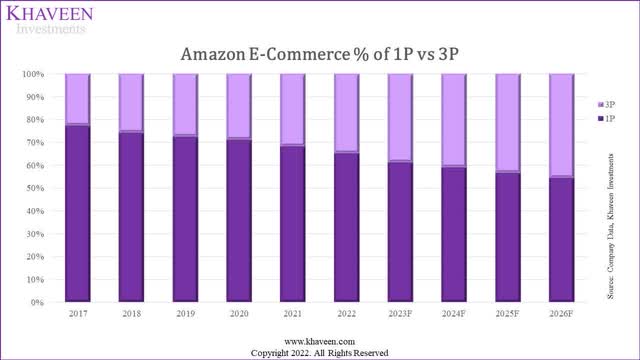
We forecasted Amazon’s 1P segment revenues based on its 2022 1P market share of 3.85% but reduced by an average share loss of 0.2% per year as Amazon’s sales mix shifted towards 3P as seen in the chart below. We multiplied this with our calculated e-commerce sales forecast through 2025. Overall, we derived a forecasted growth of 6.9% for Amazon’s 1P revenues in 2023.
Third-Party Seller Services
eMarketer, Amazon, Khaveen Investments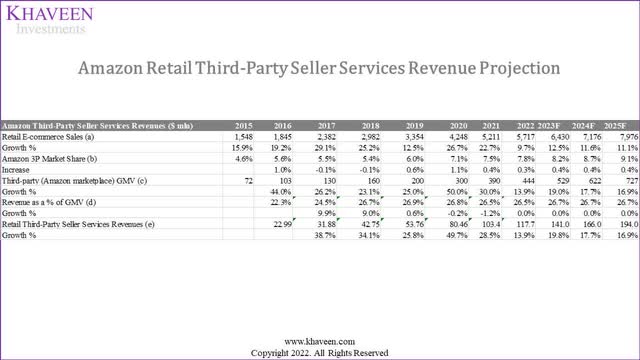
*c = a × b, e = c × d
Moreover, for Amazon’s 3P revenues, we forecasted its market share to increase based on its 5-year average share gains of 0.4%, thus reaching 9.1% by 2025. Based on our e-commerce sales forecast above, we multiplied our share forecast for its 1P segment to forecast its GMV growth of 19% in 2023. Furthermore, based on its 5-year average revenue as a % of GMV of 26.7%, we forecasted its 3P seller revenue growth at 19.8% in 2023 which is higher than 2022 at 13.9%.
Amazon’s shift to 3P is due to an increase in cost efficiency as it reduces middleman costs and promotes competition among 3P sellers. Thus, we can observe the shift from the small decrease in Amazon’s 1P market share of -0.2% and the increase in its 3P market share of 0.4%.
Additionally, as revenue as a % of GMV is expected to remain relatively constant at 26.7%, Amazon’s growth in 3P revenues is expected to decline along with the growth of Amazon’s 3P GMV. This decrease in GMV was expected due to unusually high growth from 2020 and 2021. If we average its post-pandemic growth from 2020 to 2025, it would have an average of 24.6% which is in line with its 3-year pre-pandemic growth of 24.8% from 2017 to 2019.
AWS
Synergy Research Group, Company Data, Khaveen Investments Synergy Research Group, Company Data, Khaveen Investments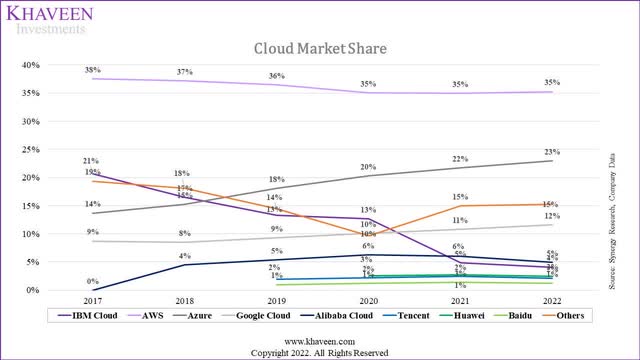
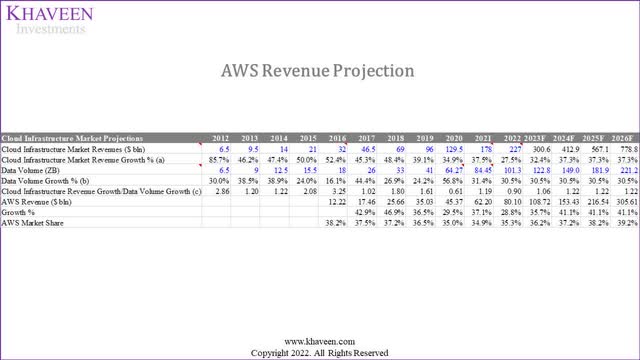
*a = b × c
In cloud, Amazon maintained its market share of 35% in 2022 despite its AWS growth slowing to 28.8% compared to 37.1% in the prior year. We believe this is due to the slowdown in growth in the cloud market which grew by 27.5% in 2022 according to Synergy Research which attributed the slowdown to a stronger US dollar, constrained Chinese market and macroeconomic headwinds.
Our customers are looking for ways to save money, and we spend a lot of our time trying to help them do so. This customer focus is in our DNA and informs how we think about our customer relationships and how we will partner with them for the long term. As we look ahead, we expect these optimization efforts will continue to be a headwind to AWS growth in at least the next couple of quarters” – Amazon CEO
We projected AWS revenue to grow at 35.7% in 2023 based on cloud infrastructure revenue growth of 32.4% multiplied by the adjustment factors of 1.10x (that considers the competitive forces of its prices, data center availability and the number of services as calculated in our previous coverage of IBM’s (IBM) cloud segment) of AWS as calculated previously in our coverage of IBM’s cloud segment.
We updated our projection for the cloud infrastructure market based on data volume growth from our previous analysis. We based the 2024 cloud infrastructure revenue/data volume growth factor on the 5-year average of 1.22x and prorated the factor in 2022 to conservatively increase to its 5-year average with the headwinds in the cloud market.
Subscription Services
|
Subscription Services |
2018 |
2019 |
2020 |
2021 |
2022 |
2023F |
2024F |
2025F |
2026F |
|
Number of Amazon Prime Members (‘mln’) (‘a’) |
100 |
120 |
150 |
200 |
220 |
243.5 |
267.0 |
290.5 |
314.0 |
|
Increase in Members |
34 |
20 |
30 |
50 |
20 |
23.5 |
23.5 |
23.5 |
23.5 |
|
Average Revenue per User (ARPU) (‘b’) |
141.7 |
160.1 |
168.1 |
158.8 |
160.1 |
164.2 |
168.5 |
172.8 |
177.3 |
|
Growth % |
-3.8% |
13.0% |
5.0% |
-5.5% |
0.8% |
2.6% |
2.6% |
2.6% |
2.6% |
|
Subscription Services Revenue ($ bln) (‘c’) |
14.2 |
19.2 |
25.2 |
31.8 |
35.2 |
40.0 |
45.0 |
50.2 |
55.7 |
|
Growth % |
45.8% |
35.6% |
31.2% |
26.0% |
10.9% |
13.5% |
12.5% |
11.6% |
10.9% |
*c = a x b
Source: Amazon, Khaveen Investments
For Amazon’s Subscription Services revenue, we forecasted it based on the number of Prime members and average revenue per Prime member. In 2023, we forecasted its Prime member growth based on a 4-year average increase (excluding 2020 and 2021) of 23.5 mln per year to reach 243.5 mln Prime members. Moreover, we forecasted its average revenue per member to increase by 2.6% based on its 6-year average. In total, we expect its Subscription services revenue to grow by 13.5% in 2023.
Advertising Services
|
Amazon Advertising Revenue Projections ($ bln) |
2019 |
2020 |
2021 |
2022 |
2023F |
2024F |
2025F |
|
Internet Usage Growth (‘a’) |
12.8% |
24.3% |
16.8% |
10.9% |
11.8% |
15.1% |
13.7% |
|
Ad Market growth/ Total usage growth (‘b’) |
1.07 |
0.57 |
1.49 |
1.19 |
1.19 |
1.19 |
1.19 |
|
Digital Ad Market Growth (‘c’) |
13.8% |
14.0% |
25.06% |
13.02% |
14.0% |
18.0% |
16.4% |
|
Digital Ad Market ($ bln) |
292.8 |
333.78 |
417.42 |
471.78 |
538.0 |
635.0 |
739.1 |
|
Amazon Market Share (%) |
4.31% |
5.92% |
7.46% |
8.00% |
8.73% |
8.96% |
9.19% |
|
Share Growth % |
1.61% |
1.54% |
0.53% |
0.73% |
0.23% |
0.23% |
|
|
Amazon Ad Revenue ($ bln) |
12.625 |
19.773 |
31.16 |
37.7 |
46.96 |
56.88 |
67.90 |
|
Growth % |
56.62% |
57.59% |
21.11% |
24.44% |
21.13% |
19.36% |
*c = a x b
Source: Amazon, Khaveen Investments
For its Advertising Services revenue, we forecasted it based on our market share projections and updated digital ad market growth from our previous analysis. In 2022, we calculated Amazon’s digital ad market share increased to 8%, we forecasted its market share to increase based on its 3-year share gain of 1.2% but tapered down by 0.5% as a conservative estimate. Multiplying our share assumption of 8.7% for Amazon, we forecasted its digital ad revenue to grow by 24.4% in 2023.
|
Amazon Revenue Projections ($ bln) |
2022 |
2023F |
2024F |
2025F |
Average |
|
Online stores |
220.0 |
235.1 |
248.6 |
261.0 |
|
|
Growth % |
-0.9% |
6.9% |
5.7% |
5.0% |
5.9% |
|
Physical stores |
19.0 |
19.9 |
20.8 |
21.7 |
|
|
Growth % |
11.1% |
4.8% |
4.5% |
4.5% |
4.6% |
|
Retail third-party seller services |
117.7 |
141.0 |
166.0 |
194.0 |
|
|
Growth % |
13.9% |
19.8% |
17.7% |
16.9% |
18.1% |
|
Subscription services |
35.2 |
40.0 |
45.0 |
50.2 |
|
|
Growth % |
10.9% |
13.5% |
12.5% |
11.6% |
12.5% |
|
AWS |
80.10 |
108.7 |
153.4 |
216.5 |
|
|
Growth % |
28.8% |
35.7% |
41.1% |
41.1% |
39.3% |
|
Advertising services |
37.7 |
47.0 |
56.9 |
67.9 |
|
|
Growth % |
21.1% |
24.4% |
21.1% |
19.4% |
21.6% |
|
Other |
4.25 |
4.25 |
4.25 |
4.25 |
|
|
Telehealth |
3.77 |
4.67 |
5.86 |
||
|
Growth % |
24.0% |
25.6% |
24.8% |
||
|
Total |
514.0 |
595.9 |
694.9 |
815.6 |
|
|
Total Growth % |
9.4% |
15.9% |
16.6% |
17.4% |
16.6% |
Source: Amazon, Khaveen Investments
Based on the table above, we have projected Amazon’s revenue to have an average 3-year forward revenue growth of 16.6%, mainly driven by retail third-party seller services and AWS as their revenue growth is projected to increase by $23.3 bln and $28.6 bln from 2022 to 2023 respectively. However, this is lower compared to its historical 5-year and 10-year, both with an average revenue growth of 24%. Hence, we believe that Amazon cannot sustain its past revenue growth, but we believe that its forward revenue growth still has a double-digit growth of 16.6% which is relatively high compared to other companies.
Margin Expansion Ahead
|
Expenses (as a % of Revenue) |
2022 |
2023F |
2024F |
2025F |
|
Cost of Sales (Excluding Shipping) |
39.9% |
37.8% |
35.6% |
33.5% |
|
Shipping Costs |
16.2% |
17.1% |
17.9% |
18.7% |
|
Fulfillment |
16.4% |
16.8% |
17.3% |
17.7% |
|
Technology and Content |
14.2% |
13.7% |
13.1% |
12.5% |
|
SG&A Expenses |
10.5% |
9.9% |
9.3% |
8.6% |
|
Other Operating Expenses (Income) |
0.2% |
0.1% |
0.1% |
0.1% |
|
Total Operating Expenses |
97.6% |
95.3% |
93.2% |
91.1% |
|
Interest Income |
-0.2% |
-0.2% |
-0.2% |
-0.2% |
|
Interest Expense |
0.5% |
0.5% |
0.5% |
0.5% |
|
One-off Expenses (Income) |
3.3% |
-0.1% |
-0.1% |
-0.1% |
|
Total Expenses |
101.2% |
95.5% |
93.4% |
91.3% |
Source: Amazon, Khaveen Investments
From the table above, we project Amazon’s margins for the next 3 years and forecast that the company will reduce its total expenses to 91.3% of total revenue by 2025. This is mainly supported by the reduction of cost of sales, technology and content and SG&A expenses due to reducing wage costs from 2023 onwards; but is partially offset by increasing shipping and fulfillment costs.
Cost of Sales
For the cost of sales, we projected the next 3 years using the average decrease in the cost of sales over the past 5 years which is 2.2% per year. We believe that Amazon’s shift from 1P to 3P would lower its costs of sales, as previously analyzed.
This trend is also believed to be significant for margin expansion of the company as gross margins third-party seller services is estimated to be between 60% to 75% of sales which is lower than AWS at 80% but still higher than the company’s overall gross margin of 37% due to high costs tied up with the cost of sales which represents 60% of its total sales.” – Khaveen Investments
Shipping Costs
|
Shipping Costs |
2018 |
2019 |
2020 |
2021 |
2022 |
Average |
|
Baltic Dry Index |
1,347 |
1,340 |
1,062 |
2,892 |
1,890 |
1,608 |
|
Growth % |
20.7% |
-0.6% |
-20.7% |
172.2% |
-34.6% |
34.7% |
Source: Investing.com, Khaveen Investments
Shipping Costs spiked in 2021 due to pent-up demand for goods post-pandemic and a huge stimulus policy from the US government which overwhelmed the capacity of the shipping industry as it slowly reopened from extensive lockdowns during Covid-19. Eventually, in 2022, shipping costs started to decrease due to rising inflation and the shift of spending from goods to services, thus reducing the demand for shipping.
|
Expenses as a % of Revenue |
2017 |
2018 |
2019 |
2020 |
2021 |
2022 |
Average |
|
Shipping Costs |
12.2% |
11.9% |
13.5% |
15.8% |
16.3% |
16.2% |
14.8% |
Source: Amazon, Khaveen Investments
Despite the negative growth of the Baltic Index in 2019, 2020 and 2022, shipping costs either barely decreased on increased as a % of revenue. Thus, we projected average shipping costs to increase based on the 5-year average of increments in shipping costs of 0.8%, thus reaching 18.7% by 2026.
Fulfillment
|
Amazon (‘000) |
2017 |
2018 |
2019 |
2020 |
2021 |
2022 |
Average |
|
Number of Employees |
566 |
648 |
798 |
1,298 |
1,608 |
1,541 |
|
|
Increase |
82 |
151 |
500 |
310 |
(67) |
195 |
|
|
Fulfillment expenses as a % of Revenue |
14.2% |
14.6% |
14.3% |
15.2% |
16.0% |
16.4% |
15.3% |
Source: Macrotrends, Amazon, Khaveen Investments
Fulfillment costs primarily consist of those costs incurred in operating and staffing our North America and International fulfillment centers, physical stores, and customer service centers and payment processing costs. – Amazon Annual Report 2022
Since there is an increase in the number of employees employed by Amazon by 195,000 year-on-year, we projected that fulfillment expenses would continue increasing.
Thus, based on the incremental increase of the 5-year average as a % of revenue of 0.4% each year, we projected fulfillment expenses as a % of revenue to reach 17.7% by 2025.
Technology and Content
|
Expenses as a % of Revenue |
2017 |
2018 |
2019 |
2020 |
2021 |
2022 |
Average |
|
Technology and Content |
12.7% |
12.4% |
12.8% |
11.1% |
11.9% |
14.2% |
12.5% |
Source: Amazon, Khaveen Investments
As previously identified, we believe the rise in technology and content expenses as a % of revenue is due to the increasing wages of tech staff and related stock-based compensation. Despite the average increase of 195,000 jobs per year over the last 5 years, there was a recent decrease in staff in 2022 of 67,000 and another 18,000 layoffs announced by Amazon in 2023. Hence, we expect technology and content expenses as a % of revenue to return to its 5-year average expenses of 12.5% by 2025, with a gradual decline of 0.6% every year from 2022 onwards.
SG&A Expenses
|
Expenses as a % of Revenue |
2017 |
2018 |
2019 |
2020 |
2021 |
2022 |
Average |
|
SG&A Expenses |
7.7% |
7.8% |
8.6% |
7.4% |
8.8% |
10.5% |
8.6% |
Source: Amazon, Khaveen Investments
As identified in our first point, payroll is the primary cost in the 3 components of SG&A expenses. As such, similar to technology and content expenses, we expect SG&A expenses to decline as per the forecasted decline in wage growth by the Congressional Budget Office. Thus, we have projected SG&A expenses to decrease to its 5-year SG&A expenses as a % of revenue of 8.6% in 2025, with a gradual decline of 0.6% every year from 2022 onwards.
Other Operating Expenses (Income), Interest Income, Interest Expense
|
Expenses as a % of Revenue |
2017 |
2018 |
2019 |
2020 |
2021 |
2022 |
Average |
|
Other Operating Expenses (Income) |
0.1% |
0.1% |
0.1% |
0.0% |
0.0% |
0.2% |
0.1% |
|
Interest Income |
0.1% |
0.2% |
0.3% |
0.1% |
0.1% |
0.2% |
0.2% |
|
Interest Expense |
-0.5% |
-0.6% |
-0.6% |
-0.4% |
-0.4% |
-0.5% |
-0.5% |
Source: Amazon, Khaveen Investments
Since other operating expenses (income), interest income and interest expense did not change much as a % of revenue, we projected its 5-year average figures of 0.1%, 0.2% and -0.5% respectively for 2023 to 2025.
One-off Expenses (Income)
|
Earnings & Margins ($ mln) |
2018 |
2019 |
2020 |
2021 |
2022 |
Average |
|
One-off Expenses (Income) |
183 |
(203) |
(2,371) |
(14,633) |
16,806 |
|
|
Rivian Investment Gains/(Losses) |
– |
– |
– |
11,800 |
(12,700) |
|
|
One-off Expenses (Income) (Minus Rivian) |
183 |
(203) |
(2,371) |
(2,833) |
4,106 |
|
|
Revenue |
232,887 |
280,522 |
386,064 |
469,822 |
513,983 |
|
|
One-off Expenses as a % of Revenue |
0.1% |
-0.1% |
-0.6% |
-3.1% |
3.3% |
-0.09% |
|
One-off Expenses (Minus Rivian) as a % of Revenue |
0.1% |
-0.1% |
-0.6% |
-0.6% |
0.8% |
-0.08% |
Source: Amazon, Khaveen Investments
From the table above, we can see that disclosures of Rivian by Amazon were only done in 2021 where it recorded an $11.8 bln gain and in 2022 where it suffered a $12.7 bln loss. One-off expenses as a % of revenue with and without the investment of Rivian had a 5-year average decline of 0.09% and 0.08% respectively. Thus, since one-off expense (income) as a % of revenue is insignificant, we continue to use the 5-year average of -0.1% to project its future income.
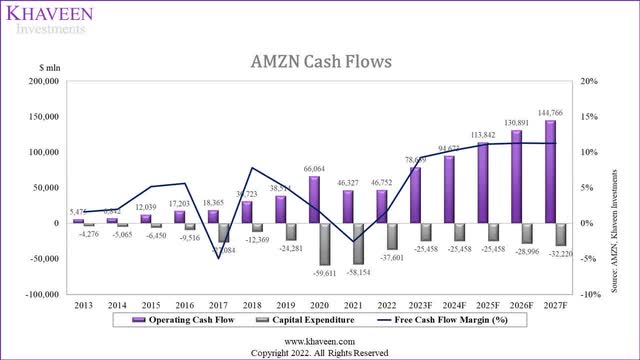
More importantly, Amazon’s FCF margins have improved in 2022 and turned positive from the prior year but were low at only 1.72%. We updated our capex projections where we expect its capex as a % of revenue to normalize in the future as it completes its expansion projects for its AWS segment which accounted for 60% of capex from our previous analysis. This would result in a forecasted 5-year forward cash flow margin of 10.6%.
Risk: E-commerce Slowdown
We believe one of the risks for Amazon is the slowdown in e-commerce revenue. We believe that e-commerce is reaching its maturing stage, thus its growth is likely to plateau. In our second point, we highlighted our forecast for the e-commerce market with a lower 3-year forward growth compared to the past growth based on our penetration rate forecast which is a lower growth compared to the past 7 years as we forecasted the e-commerce market to represent 25.5% of retail sales by 2025. The past 6-year average penetration rate growth was 13.7% compared to our forward average of 6.8% at an average increase in the penetration rate of 1.5% per year. Based on this, we forecasted e-commerce sales growth at a forward average of 11.7% which is lower compared to the past 7-year average of 20.7%
Additionally, Amazon lost market share in 2022 at a net rate of 0.1% which could indicate intensifying competition the company is facing and could result in lower e-commerce revenue growth in the future for the company.
Moreover, we projected lower retail sales growth of 4.8% in 2023 based on SDG Group due to the high inflation of goods across most sectors and a shift of spending habits towards services. Lastly, the Consumer Confidence Index, an indicator of consumer spending habits, has also shown that it largely declined for the whole of 2022 before picking up in the last few months.
Valuation
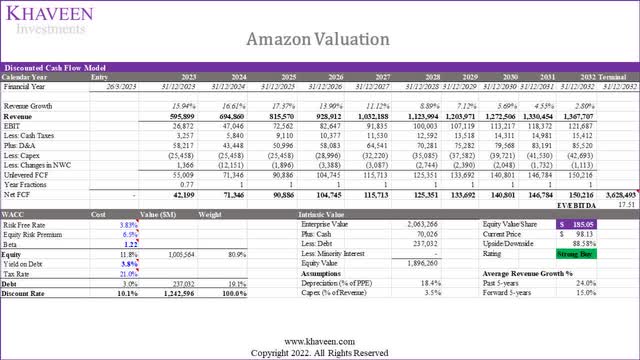
We updated our valuation of Amazon based on a DCF analysis with a discount rate of 10.1% (company’s WACC) and obtained an upside of 89% for its shares.
Verdict
Regarding our first point, we have observed a significant increase in Amazon’s technology and content as well as SG&A costs in 2022. However, we attribute Amazon’s net loss in that year to a singular occurrence, namely the decrease in the fair value of Rivian. In the coming years, while we anticipate an increase in shipping and fulfillment costs as a percentage of revenue, we expect this to be offset by a decline in cost of sales as a percentage of revenue. This is due to Amazon’s shift from its 1P to 3P model in e-commerce. Additionally, we expect Amazon’s technology and content as well as SG&A expenses as a percentage of revenue to decrease, as wage growth across tech, office, and administrative sectors normalizes.
Secondly, we anticipate Amazon’s revenue growth to improve in 2023, supported by high-growth segments such as retail third-party seller services, underpinned by an e-commerce growth recovery, and AWS growth. Overall, we expect Amazon’s margins to improve, with operating expenses projected to drop to 91.1% of revenue, and a 5-year forward net margin of 6.34%.
Overall, we updated our total revenue forecast lower at a forward 3-year average of 16.6% compared to our previous 5-year forward average forecast of 17.8% due to lower e-commerce and AWS growth. Based on our DCF valuation, we obtained a lower price target of $185.05 compared to our previous valuation, but we still maintain our Strong Buy rating on the company with a still significant upside potential of 89%.
Disclosure: I/we have a beneficial long position in the shares of AMZN either through stock ownership, options, or other derivatives. I wrote this article myself, and it expresses my own opinions. I am not receiving compensation for it (other than from Seeking Alpha). I have no business relationship with any company whose stock is mentioned in this article.
Additional disclosure: No information in this publication is intended as investment, tax, accounting, or legal advice, or as an offer/solicitation to sell or buy. Material provided in this publication is for educational purposes only, and was prepared from sources and data believed to be reliable, but we do not guarantee its accuracy or completeness.

