Summary:
- Amazon, according to Morningstar analysts, has a wide moat which gives it huge competitive advantages.
- Its price valuations are reviewed using Morningstar, Value Line, CFRA and Yahoo Finance analyst metrics.
- FASTgraphs charts are shown, P/Es discussed and a recommendation made.

4kodiak/iStock Unreleased via Getty Images
Amazon
Amazon (NASDAQ:AMZN) is in the consumer discretionary sector as an internet and direct marketing retailer incorporated in 1994 and is headquartered in Seattle, WA. The internet portion known as Amazon Web Services “AWS” operates primarily through internet retailing in the USA and internationally, along with some physical stores. It operates its own warehouses and shipping along with internet streaming media content, manufactures and sells numerous products under its own labels such as Kindle and Fire. Amazon Prime services and the logo are very evident on trucks, packages and TV viewing. The following are a few statistics:
- $902 Billion market capitalization.
- AA S&P credit rating
- 45% long term debt/ capital
- no dividend
Analyst Pricing
The following abbreviations are used in the chart that follows:
Curr Pr/Sh = Current price per share
M* FV = Morningstar fair value
M* Buy = Morningstar lowest and very inexpensive price to buy
VL = Value Line safety score: 1 is the safest/ best and 5 would be very unsafe
VL Mid PT = Value Line 18 month future price target or Mid 2024.
YF PT = Yahoo Finance 1 year future price target
CFRA = TD Ameritrade analyst price target
52 wk Low = current 52 week price low
52 wk High = current 52 week price high
|
Stock |
Curr |
M* |
M* |
VL |
YF |
52 wk |
52 wk |
||
|
Ticker |
Pr/Sh |
FV |
Buy |
VL |
Mid Pt |
PT |
CFRA |
Low |
High |
|
AMZN |
87.86 |
$150 |
$90 |
1 |
$123 |
$140.64 |
$152 |
$85.87 |
$174.17 |
Amazon is below fair value according to all analysts and sitting right darn close to its 52 week low of $85.87.
FASTgraphs – FG
FG shows in one picture graph statistics and numbers that help visualize price, dividend attractiveness and much more. The FAST part of FG, just in case you were wondering, means, Fundamental Analyzer Software Tool, which was developed and introduced by Chuck Carnevale, a writer at SA. I have a grandfathered subscription price and enjoy using it.
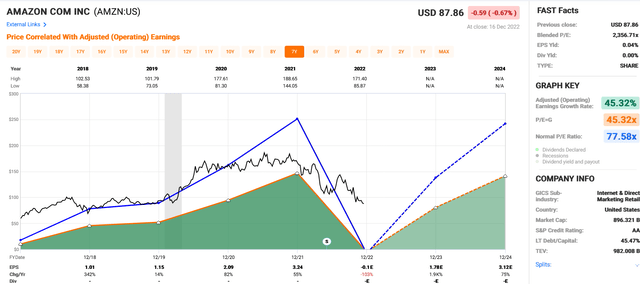
The following colors/ lines on the chart represent the following”
Black line = price
White line = dividend
Orange line = Graham average of usually 15 P/E “price/earnings” for most stocks.
Blue line = Normal P/E
Dashed or dotted lines are estimates only.
Green Area represents earnings.
Statistics by year are noted for high and low prices at the top of each chart in black and for earnings and dividends at the bottom of it. The % shown is for the change from year to year for earnings.
Shown below is a 7-year chart for each company representing the last 5 years along with 2 years of future estimates (dotted lines).
The “S” shown in a white circle near the bottom in the green area designates the 1:20 split that occurred at the end of 2021, with all prices adjusted for it.
Amazon

7 year FG Price earnings Amazon (FASTgraphs Chuck Carnevale)
Note the poor earnings that occurred this year 2022, down to -10c, yes negative. 2023 estimate shows earnings rising back up to $1.78 and then to $3.12 in 2024. The 2021 level was $3.24. The recovery will take a few years, so probably some time to watch the price.
Using the above 7-year chart, the current P/E is a huge 2357, which agrees with the negative earnings. The blue normal P/E is 77.58x while the orange line P/E = G is 45.32.
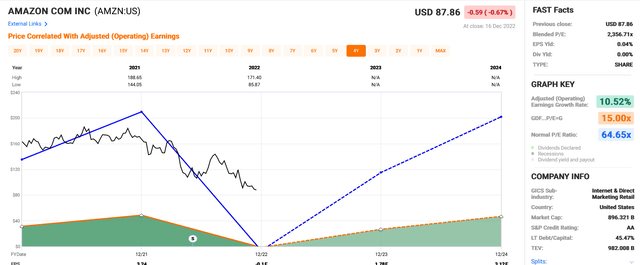
Now, looking at a more compressed chart of 4 years showing the last 2 years and 2 years of estimates, the orange line becomes a lower 15 GDF P/E. This is a more realistic view of how generally over valued this company has been. Using this chart and considering a future recession and the estimated earnings suggested, the price moves lower to the more normal growth and would sell nearer to $50 or less. See the green box on the right showing 10.52% growth, a nice number, but not what is expected from a growth stock with no dividend.

AMZN 4 yr FG earnings/ price Dec 22 (FASTgraphs by Chuck Carnevale)
Summary/ Conclusion
Right now AMZN is sinking slowly, along with the earnings to that lower price. Seeing it at $60, or lower (and actually earnings of $3.12 X 15 P/E brings it lower to $46.80) and that is for 2024. Retail sales are suffering and this probably could happen. I rate this a watch and might just buy one share because it just looks too enticing to not just get one. Waiting and watching, however, is probably the wisest method for investing in this no dividend stock. One day it should rise back up and maybe even pay a dividend.
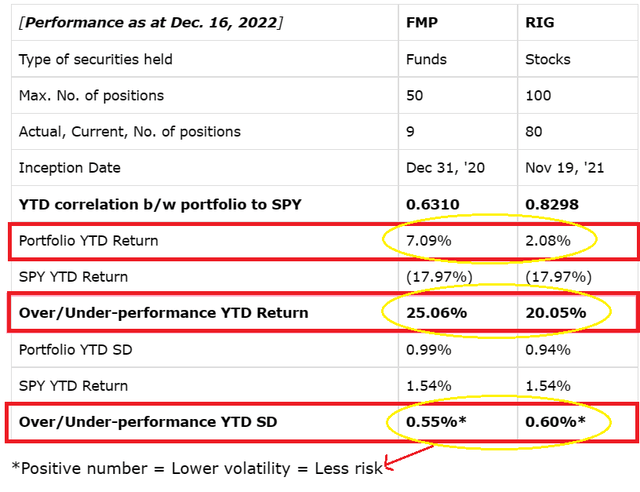
Rose’s Income Garden is a mostly dividend paying portfolio, so it’s important to buy a growth stock at proper value. Below are the current performance statistics for it and the FMP “Funds Macro Portfolio” at MTF.

FMP/ RIG Performance Results Dec 22 (Macro Trading Factory )
Please see the information in the bullet points if you have interest in learning more.
Happy Investing All!
Disclosure: I/we have no stock, option or similar derivative position in any of the companies mentioned, but may initiate a beneficial Long position through a purchase of the stock, or the purchase of call options or similar derivatives in AMZN over the next 72 hours. I wrote this article myself, and it expresses my own opinions. I am not receiving compensation for it (other than from Seeking Alpha). I have no business relationship with any company whose stock is mentioned in this article.
Additional disclosure: Amazon is quality and has a wide moat with an attractive price, but the unknown retail recession might lower the price more. Its a buy, but with that caution.
Macro Trading Factory is a macro-driven service, run by a team of experienced investment managers.
The service offers two portfolios: “Funds Macro Portfolio” & “Rose’s Income Garden”; both aim to outperform the SPY on a risk-adjusted basis, in a relaxed manner.
Suitable for those who either have little time/knowledge/desire to manage a portfolio on their own, and/or wish to get exposed to the market in a simple, though more risk-oriented (less volatile), way.
Each of our portfolios, spanning across all sectors, offers you a hassle-free, easy to understand and execute, solution.
