Summary:
- Amazon.com, Inc.’s free cash flow has significantly improved, suggesting increased profitability and sustainable growth.
- Analysts expect double-digit earnings growth for Amazon in the next decade.
- I share the optimism thanks to key growth drivers like the recovery of its e-commerce operations and AWS.
- The discounted free cash flow model indicates a fair share price of ~$195, signaling the stock is currently close to fair valuation.
ogichobanov
Amazon generated $35B+ FCF TTM
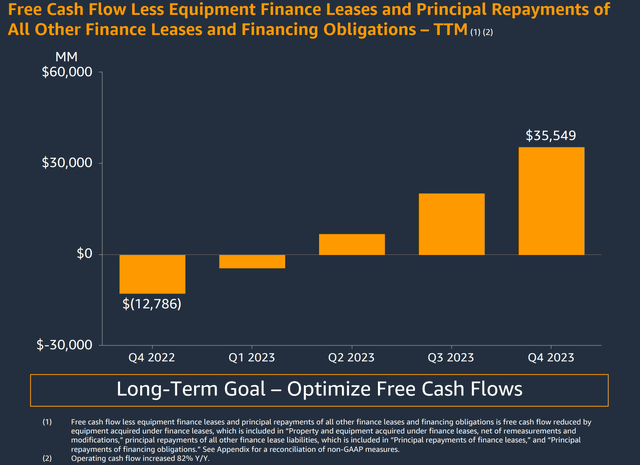
I used to be very concerned about the free cash flow (“FCF”) of Amazon.com, Inc. (NASDAQ:AMZN) stock. It is not only because its FCF has been in the negative for several quarters (see the chart below), but also because of the distortions caused by AMZN’s substantial reliance on lease obligations. Readers interested in the distinction between the usual definition of FCF (operation cash minus CAPEX) and FCF after accounting for leasing obligation can see my earlier article here for a more detailed analysis.
Now, I think AMZN has definitively overcome the FCF problem, and my concern is removed. The chart below shows Amazon’s FCF, less equipment finance leases and principal repayments of all other finance leases and financing obligations, for the past four quarters on a TTM basis. As seen, Amazon’s FCF flow has continuously improved over this period. In Q4 2022, the company had a negative FCF of -$12.79 billion. By Q4 2023, that number had grown to a positive $35.55 billion.
To me, this significant improvement in free cash flow suggests that Amazon is becoming more profitable and better positioned for sustainable growth. And I will elaborate on the specific growth drivers immediately below.
Robust growth prospects
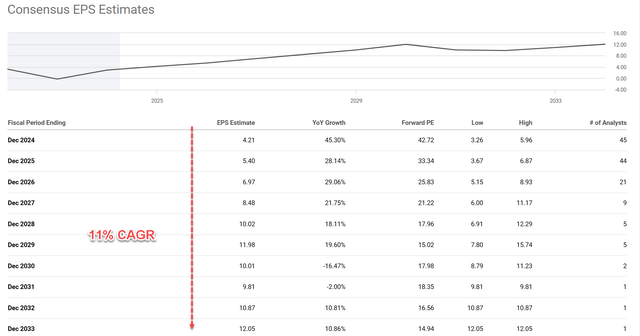
Analysts expect Amazon’s earnings to grow at a double-digit rate over the next few years. For example, the consensus estimate for EPS growth in fiscal 2025 is 28%, and the estimate for fiscal 2026 is 29%. Overall, growth in the next 10 years is expected to be at a CAGR of 11%.
I see good catalysts to support consensus optimism. The top two catalysts in my mind are the recovery of its e-commerce operations and its AWS.
After a challenging 2022, Amazon’s e-commerce operations are succeeding post-pandemic. Whereas Amazon used to compete mostly on pricing and convenience, its retail profits are now rebounding, thanks mostly to enhanced logistics and distribution efficiencies. Operation profit in this segment swung from a loss of $2.9 billion a year ago to an operating income of $4.2 billion in the latest quarter. Although earnings comparisons will become more difficult, there are still opportunities to improve efficiency associated with the relatively new broader fulfillment network and better utilize AI to serve customers.
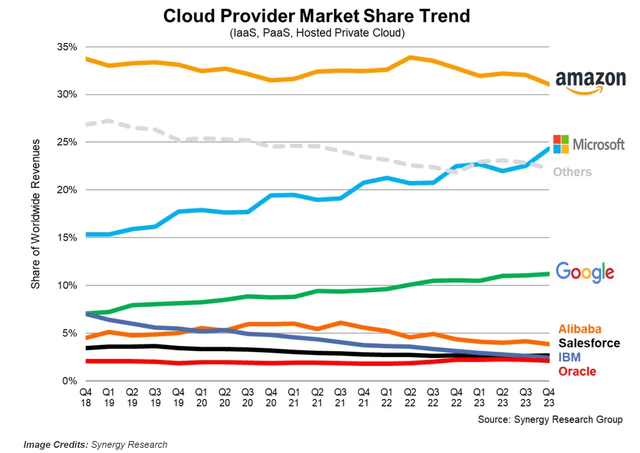
Amazon Web Services, or AWS, has also been growing at a robust rate and remains the leading could provider (see the chart below). AWS’ third quarter sales increased 12% from year-ago levels and contributed operating income of $7.0 billion, up from $5.4 billion in the September period of 2022. Looking ahead, I see AWS results further improve from AMZN’s ongoing efforts to integrate artificial intelligence capabilities. Customized semiconductors, coding assistance tools, and a new partnership with Anthropic are a few initiatives that I think are very promising to boost its generative AI potential.
Valuation
As argued in my earlier articles, due to AMZN’s special business and capital structure, the usual accounting P/E ratio does not provide too much insight here. As such, this article will rely on the discounted FCF model. The concept here is very straightforward and kind of self-evident: the worth of a stock is the sum of all the FCF it can generate in the future. In particular, I will use a two-stage discounted FCF model, with the first stage to capture its rapid growth and the second stage to capture its terminal growth. There are a total of 3 key parameters in this model: the discount rate, the growth rate in stage 1, and the terminal growth rate. I will detail my estimates of these parameters one-by-one next, and the end results are shown in the second chart below toward the end of this section.
For the discount rate, I relied on the so-called WACC, the weighted average cost of the capital model (details provided via this link. The discount rate for AMZN is about 9% on average in recent years following this model. For the growth rate in the first stage, I will simply follow a consensus projection of an 11% CAGR for the next 10 years. Finally, my approach for estimating the terminal growth rates is detailed in my early articles. A brief recap is provided here:
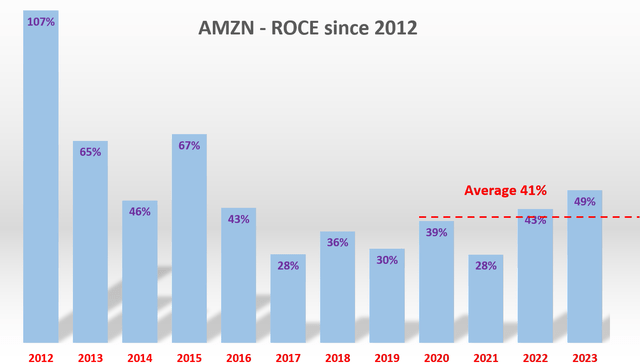
The approach involves the return on capital employed (“ROCE”) and the reinvestment rate (“RR”). The ROCE for AMZN is around 41% as seen in the chart below. AMZN’s reinvestment rate is about 10% on average, higher than the average for other major tech firms largely due to its aggressive use of lease obligations. With these inputs, AMZN’s perpetual growth rate would be ~4.10% (41% ROCE x 10% reinvestment rate = 4.10%). Note this number is the real growth rate without inflation. To obtain a notional growth rate, one would need to add an inflation escalator.
Now with all the key parameters in place, the following spreadsheet did the number crunching. The calculations were based on a TTM FCF of $3.31 per share. It was obtained based on $35.5B of FCF as aforementioned divided by a total of 10.7B outstanding shares on a diluted basis. For the terminal growth rate, I added an annual inflation rate of 2.4% (which is the long-term average inflation) so the nominal growth rate is 6.5%.
The bottom line is that the present value of an AMZN share is about $195 based on these parameters. As I am typing these lines, the market share price is about $180, actually slightly below this fair value.
Other Risks and Final Thoughts
There are some uncertainties to the above long-term projection. The emergence of artificial intelligence poses both threats and opportunities at the same time. For now, the AI revolutionary is in its early explosive stage and the tide is lifting all boats. But I suspect that the market may become more discerning about the relative winners and losers in the next 1~2 years. Whether AMZN’s AI initiatives on this front can be among the winners by then is unclear to me.
There are also some concerning signs on the cloud front. If you recall from an earlier chart, even though AWS is still the market leader, its market share has been declining. Microsoft’s (MSFT) Azure and Google (GOOGL) Cloud have been gaining market share in recent quarters. Besides these major cloud providers shown on the chart, other providers such as Meta and Apple are also jostling for positions in the marketplace. Investors need to monitor each company’s technological advances, partnerships, and potential product development paths to see if AWS can keep its market share.
All told, my overall conclusion is that Amazon stock presents a compelling opportunity for investors under current conditions. I think the positive catalysts will be the dominating force here. To recap, the key Amazon positives in my mind are its robust FCF (even after adjusting for its lease obligations), its healthy growth prospects, and its reasonable valuation based on its discounted future FCF.
Analyst’s Disclosure: I/we have no stock, option or similar derivative position in any of the companies mentioned, and no plans to initiate any such positions within the next 72 hours. I wrote this article myself, and it expresses my own opinions. I am not receiving compensation for it (other than from Seeking Alpha). I have no business relationship with any company whose stock is mentioned in this article.
Seeking Alpha’s Disclosure: Past performance is no guarantee of future results. No recommendation or advice is being given as to whether any investment is suitable for a particular investor. Any views or opinions expressed above may not reflect those of Seeking Alpha as a whole. Seeking Alpha is not a licensed securities dealer, broker or US investment adviser or investment bank. Our analysts are third party authors that include both professional investors and individual investors who may not be licensed or certified by any institute or regulatory body.
As you can tell, our core style is to provide actionable and unambiguous ideas from our independent research. If your share this investment style, check out Envision Early Retirement. It provides at least 1x in-depth articles per week on such ideas.
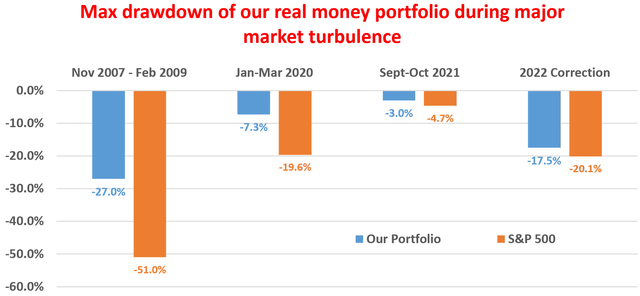
We have helped our members not only to beat S&P 500 but also avoid heavy drawdowns despite the extreme volatilities in BOTH the equity AND bond market.
Join for a 100% Risk-Free trial and see if our proven method can help you too.
