Summary:
- Trends in OPEX and CAPEX as a percentage of revenue are changing in the market.
- Amazon has been one of the heaviest opex spenders in the Mag7, suppressing GAAP income, this may be ready to change.
- With a new AI suite of offerings in AWS, Andy Jassy is a player in the AI arms race.
FinkAvenue
Trends are changing
With the recent AI boom sparked by demand for NVIDIA (NVDA) chips, the expensing of many of the MAG 7 is about to have an about-face. Companies like Amazon (NASDAQ: AMZN), Google (GOOGL)(GOOG), Microsoft (MSFT), and Meta (META) have historically taken immediate expensing on the income statement in the form of SG&A and R&D. The aforementioned usually results in lower GAAP income but higher cash flows, as SaaS companies tend to have lower CAPEX needs versus industrial companies that rely on manufacturing facilities to produce products or other heavy machinery.
Now with the massive demand for AI development, expenses will begin to migrate from the income statement to the cash flow statement as at least some portion of OPEX will naturally flow to CAPEX when these companies build more data centers and buy more GPUs. These will not be immediate expenses as is the case with OPEX, they will rather be capitalized and depreciated to a greater extent.
With that in mind, these companies also have large cash balances and huge capacities to borrow, since they generate massive revenues and are widely under-leveraged. What proportion of CAPEX comes from cash reserves and borrowing versus a reconfiguration from OPEX to CAPEX will determine how much actual GAAP profit these companies start to show in future quarters as this story begins to materialize.
My thesis is Amazon is the prime candidate for this future GAAP earnings growth, which will begin to make it seem as if profits are appearing out of thin air. In reality, these hyper-scalers were taking advantage of immediate expensing all along to dominate their markets and ramp up a customer base. With Amazon being famous for avoiding taxes to grow the top line, they may have no choice but to show larger GAAP profits should the need for larger CAPEX expenses dominate their immediate future.
The hour glass
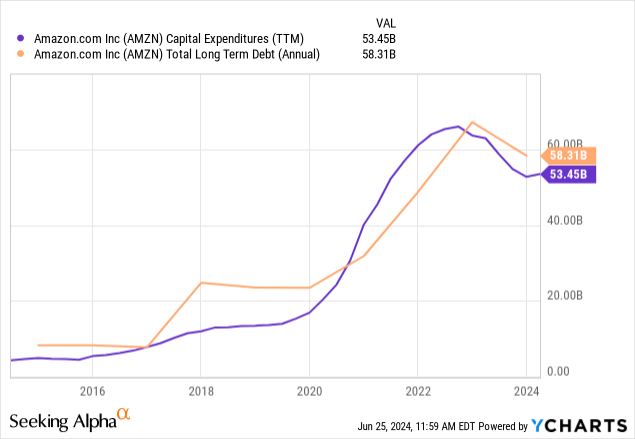
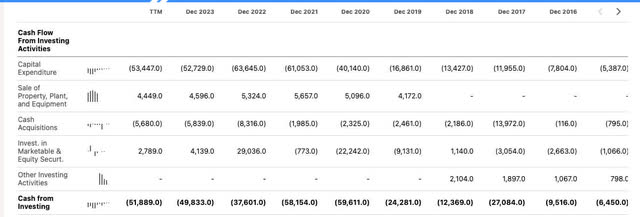
During Covid, Amazon massively ramped up logistic centers and other “hard cost” CAPEX spending. This also coincided with ultra-low interest rates where it made all the sense in the world to borrow in order to finance this expansion, and borrow they did. The LT debt line traces the CAPEX trend line almost to a T.
Now, the cost of capital isn’t cheap. Not only is Amazon faced with maintenance CAPEX demands from their newly built empire of data centers and warehouses, but they also have more industry pressure to pursue the same AI development as the rest of the MAG7 cadre ex NVIDIA who is the drug dealer. In my mind, I imagine a great portion of this maintenance and growth CAPEX now coming from a reconfiguration of OPEX R&D and SG&A, migrating to the cash flow statement.
This should result in lower operating expenses, which were always hailed as Amazon’s greatest weapon, their operating leverage. This will in turn increase GAAP earnings. As this process slowly begins to take place, investors will begin to realize that Amazon wasn’t really as expensive as they had assumed. Using the hourglass analogy, Amazon has historically placed the grains of sand in the accounting hourglass representing CAPEX at the top of the pile, with a greater proportion of OPEX at the bottom.
Which grains hit the bottom of the glass first will determine if we see more free cash flow or more GAAP earnings. While as a percentage of revenue, CAPEX recently has been highly competitive with OPEX, but the chart above demonstrates that debt was largely the co-factor rather than gross profit resources.
Historical OPEX as a percentage of revenue
Historical CAPEX
Running these two side by side, we currently see the following on a TTM basis:
- OPEX as a percentage of revenue: 39.57%
- CAPEX as a percentage of revenue: 9%
In previous articles I have written on Amazon, I observed that the sore thumb of operating leverage and tax sheltering came in the form of Research and development. The stock is up 61.9% since said previous article.
Seeking Alpha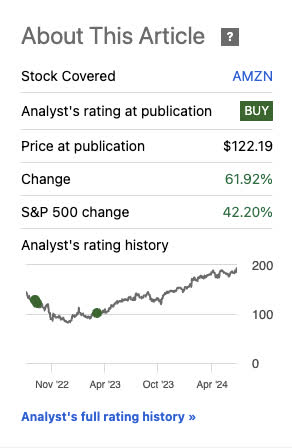
Using similar assumptions then as I am now, I found Amazon undervalued and continue to hold that belief.
Nick Sleep and Bill Miller were popular in pointing this out and noting that when backing this number out even by a quarter to half of what it is on a per-annum basis, Amazon appears to be un-profitable by choice. There is some controversy in this notion, what proportion of their R&D is needed to maintain current operations and what portion is purely by choice.
MRQ revenue and profit breakdown
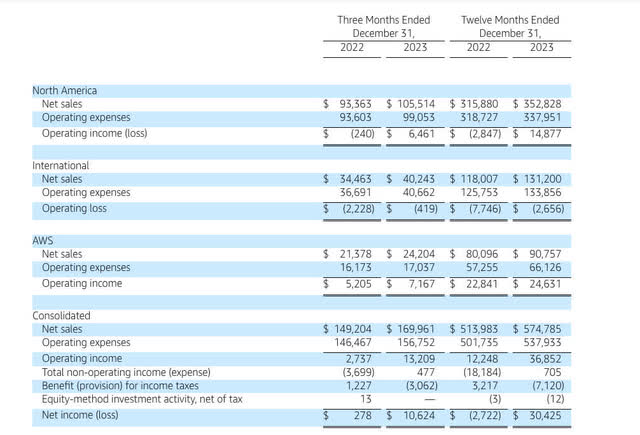
Here is the MRQ revenue comps year over year:
As a percentage of sales, AWS keeps climbing. AWS now represents 25.6% of all sales, growing nearly $10 Billion year over year. This is the number investors focus on to the greatest extent, being that it is the profit growth driver. As we’ll see later in the article, Amazon’s AWS offering language is now littered with AI verbiage. They fully intend to join the headline parade of companies trying to become the leader in AI solutions.
R&D and operating leverage
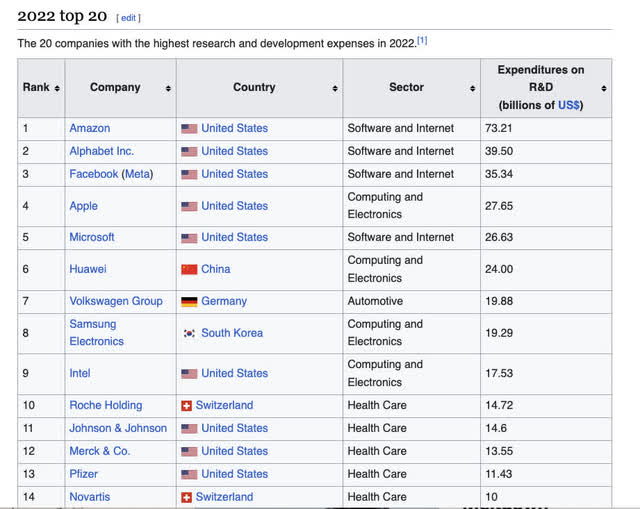
While the above is from 2022, and R&D expensing from Amazon has only increased since then, this is a great visualization of where Amazon sits in the pecking order for Research and Development. They are #1 in this expenditure by a fairly large margin. The company does have AWS and is constantly updating their e-commerce algorithms, but do they really need about 2x the budget of Google, which is almost purely in the realm of soft cost expensing and data science?
my own excel data from Seeking Alpha
A visualization of what a complete add back of the R&D expense line to operating income shows the following:
- $132.54 Billion adj. operating income backing out R&D on a TTM basis.
- This results in $12.73 per share currently in adjusted operating income per share when backing out R&D taking into consideration 10.406 Billion shares outstanding.
- A trailing 5 year CAGR of 19.39% can be seen in this metric from 2018-2023
- Using a modified PEG ratio valuation based on this model would result in a multiplier of 19.39 as the growth rate being used becomes the multiplier in a PEG ratio analysis.
- Thus 19.39 X $12.73= $246.98/share fair value
To clarify, the PEG ratio equivalent of 1, or Peter Lynch’s fair value indicator for GARP, is simply the PE divided by the growth rate. So if I were assuming Amazon had a growth rate of 19.39%, then a P/E of 19.39 would be equivalent to a PEG ratio of 1 or, in other words, fair value. This instance visualizes adjusted operating income, which was that $12.73/share number backing out R&D. Thus, 12.73 x 19.39 would be equivalent to a modified PEG 1 since 19.39/19.39=1.
Since my last article, this valuation method of Amazon has made me even more optimistic because I believe increased CAPEX requirements will continue to force Amazon to peel back OPEX and start to reveal how much operating leverage they really had all along.
Nvidia has turned the market on it’s head and may help compress the market multiple
The following quip is from Marcelo Lima of the Heller House Opportunity Fund from 2018:
There is another reason “cheap” is a poor proxy for value: the new business models I described above—SaaS in particular—are not well suited to traditional GAAP accounting.Here’s why: if distribution costs are zero, the optimal strategy is to gain as many customers for your software product, as quickly as possible. In digital businesses, there are increasing advantages to scale, and many of these companies operate in winner-take-all or winner-take-most markets. The name of the game is thus to build, grow, then monetize.
Frequently, this means spending a lot of money in sales and marketing, which depresses reported earnings.Thus, SaaS companies spend to acquire customers upfront , and recognize revenue from those customers over many years . This mismatch burdens the income statement. Some of the most successful—and highest performing stocks—in the SaaS world have spent many years growing despite producing no meaningful accounting profits.- Marcelo Lima
This was one of the better summations I have stumbled across, succinctly highlighting the front-running success of many software-as-a-service models. This was also highlighted in Gautam Baid’s The Joys of Compounding.
In a nutshell, the AI movement is forcing the hand of many successful SaaS companies to begin showing GAAP profits as hard costs related to data centers, GPUs, server racks, semiconductors etc. are making for far more capitalized costs than immediately expensed operating costs. This is a paradigm shift.
NVIDIA is one of the greatest growth stories we’ve ever witnessed, I was wrong in previous assessments regarding NVIDIA’s value and could have never imagined this earnings growth to have materialized. I was basing NVIDIA’s value on trailing growth rates, which is a mistake for a cyclical stock. NVIDIA is currently enjoying the up cycle to end all up cycles that could last for several years. Truly amazing.
Every software company has to be all in on AI to appease their investor bases. This should spurn more economic growth in construction, and energy production. This should also help compress the multiple of the S&P 500 simply by changing the accounting equations of where the expenses are going. Like magic.
Amazon AI plans
From a recent article at GeekWire:
Amazon is developing its own consumer-focused AI chatbot that would compete with OpenAI’s ChatGPT and could be revealed later this year, according to a report from Business Insider.
The chatbot service, code-named “Metis,” would be accessed via web browser and powered by a new foundational model, according to Business Insider, which cited sources and documents.
The move would add Amazon to a growing list of tech giants and startups offering new AI assistants, including Microsoft, Google, and Amazon-backed Anthropic, among several others.
Amazon declined to comment in response to an inquiry from GeekWire.
I guess we would have been naive to assume that Amazon was sitting on the sidelines and not developing competing IPs to Microsoft’s ChatGPT. This is on top of improvements to Alexa that may see the cash burner go on a paid subscription model soon, and improved tool sets for AWS users.
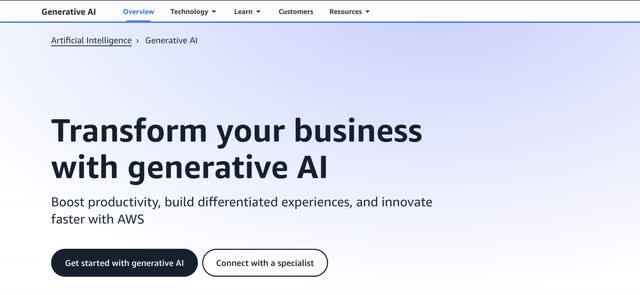
The promotional headline on AWS is generative AI. CEO Andy Jassy is certainly jumping on the AI wave, with more to come. Their GEN AI tools include the following:
- Amazon Q: Gen AI assistants
- Amazon Bedrock: Build and scale with LLMs and GEN AI tools
- Amazon SageMaker:Build and deploy FM models
- AI infrastructure: Train and run inference
- Data Foundation: Build data foundation on AWS
A few goals and use cases:
- Chatbots and virtual assistants
- Conversational analytics
- Employee assistants
- Code generation
Analyst estimates and GAAP earnings expectations
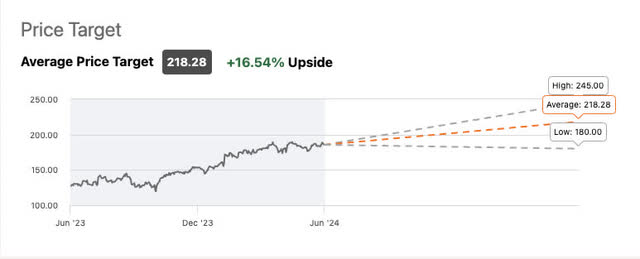
My estimate comes in above the high end, but just barely. At $246, I am on the bullish end of Wall St. Estimates, but still in line with what they are seeing.
GAAP estimates
Balance sheet
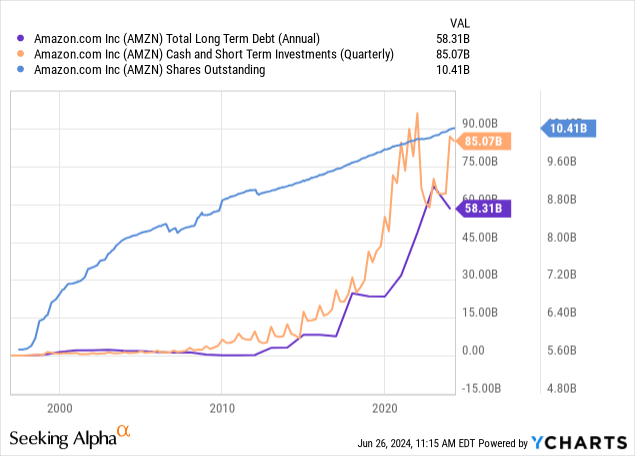
Similarly to Meta, Google, Microsoft, and Apple, Amazon has a cash and short-term investment fortress. On a TTM basis, they are now joining the ranks of the select few companies now earning a net profit on cash versus interest expense to the tune of $328 million. Having a negative interest rate is a great spot to be in. Cash remains well above long-term debt. The only issue with Amazon is share dilution, which continues. Rather than a dividend, we Amazon shareholders should be hoping for a buyback program to reduce the float as the first priority.
Forward-looking assumptions
Looking at the high-end camp of Wall St. estimates, we can already see an expectation year over year in Amazon earnings growth for FY 24 versus FY 25 to be at 24%. With 2023 full year EPS at $2.95/share, the growth between then and the high end of 2025 would be a greater than 2 X in GAAP EPS growth for that period.
I am quoting the high end because for all the reasons I mentioned the accounting abnormalities that will occur when Amazon and the other hyper-scalers start reconfiguring expensed OPEX to capitalized CAPEX will uncover greater GAAP earnings numbers than anyone could have ever anticipated.
I think this moment in time is also exactly what Andy Jassy was put here for. He was the founder of AWS and is now going to be instrumental in transforming data centers into AI powerhouses. There may not be a more qualified CEO to chase down this TAM outside of Jensen Huang himself.
I will continue to monitor this thesis and watch the percentage of OPEX to revenue vs CAPEX to revenue. The greater the change, the more bullish I would become.
Risks
With all of the MAG 7 ex NVIDIA, the AI arms race is the biggest risk. A product being released not yet ready to be considered post-beta can cause a lot of negative headline risk. Additionally, blindly spending on data centers and GPUs to get ahead could result in a lot of waste, this goes for the entire group. Whoever thinks this through with the most clarity, will come out the back end in the best shape. Others may be stuck with a lot of worthless, depreciating assets that now need maintenance CAPEX on an ongoing basis.
Summary
Amazon and Google remain my two favorite, most fairly valued AI MAG 7 plays. They are also candidates to eventually be chip producers as they vie to control their own costs when it comes to data centers and cloud computing. I continue to buy, but not at the rate of 2022. I firmly believe the forward accounting changes are going to make several companies look cheaper than many realized. Buy.
Analyst’s Disclosure: I/we have a beneficial long position in the shares of MSFT, AMZN, GOOGL, META either through stock ownership, options, or other derivatives. I wrote this article myself, and it expresses my own opinions. I am not receiving compensation for it (other than from Seeking Alpha). I have no business relationship with any company whose stock is mentioned in this article.
The information provided in this article is for general informational purposes only and should not be considered as financial advice. The author is not a licensed financial advisor, Certified Public Accountant (CPA), or any other financial professional. The content presented in this article is based on the author's personal opinions, research, and experiences, and it may not be suitable for your specific financial situation or needs.
Seeking Alpha’s Disclosure: Past performance is no guarantee of future results. No recommendation or advice is being given as to whether any investment is suitable for a particular investor. Any views or opinions expressed above may not reflect those of Seeking Alpha as a whole. Seeking Alpha is not a licensed securities dealer, broker or US investment adviser or investment bank. Our analysts are third party authors that include both professional investors and individual investors who may not be licensed or certified by any institute or regulatory body.
