Summary:
- Amazon is focused on lowering its cost to serve in its stores businesses.
- The regionalization of fulfillment and transportation in the US has resulted in a 20% reduction in touches and a 19% reduction in miles traveled for packages.
- The company aims to achieve margins similar to pre-COVID levels and believes that expanding same-day facilities will improve cost structures.

Daria Nipot
Introduction
My thesis is that Amazon (NASDAQ:AMZN) is doing a good job lowering their cost to serve in their non-AWS segments. They’re always lowering their cost to serve in the AWS segment as well, but those considerations are beyond the scope of this article. As my June article said, AWS is a powerhouse and a large part of Amazon’s overall valuation.
The Numbers
CEO Andy Jassy names lowering Amazon’s cost to serve in their stores businesses as the first key priority in the 2Q23 call. Central to this effort has been the transition of fulfillment and transportation from a single national network in the US to a series of eight separate regions. This regionalization has brought about a 20% reduction in the number of touches and a 19% reduction in miles traveled for the average package. Regionally fulfilled deliveries in the US are now at 76%.
CEO Jassy explains later in the call that shipments from regional fulfillment centers travel shorter distances which means the transportation cost is less, the packages get there faster and the setup is better for the environment. He says regional same-day fulfillment facilities are the fastest fulfillment mechanism and one of the least expensive.
CFO Brian Olsavsky repeats the cost to serve message, saying it has been one of the largest drivers in the improved operating income of the stores business. He specifies that the North American operating margin bottomed out in 1Q22 and it has seen consecutive improvement for five quarters in a row:
Since North America segment operating margins bottomed out in Q1 of 2022, we have seen five consecutive quarters of improvement, with second quarter operating margin of 3.9%. This is an improvement of 620 basis points over these past five quarters. One of the largest drivers of this operating income improvement in the stores business has been reducing our cost to serve, with shipping costs and fulfillment costs continuing to grow at a slower pace than our unit growth. Most recently, regionalization is an important contributor. Faster delivery speed from better network connectivity and better inventory placement means less miles traveled and fewer touches, resulting in less cost.
Later in the 2Q23 call, Morgan Stanley (MS) Analyst Brian Nowak reminded us that in the 1Q23 call, CEO Jassy talked about North America retail margins going back to pre-COVID levels – something in the range of 4%. Nowak asked how we should think about this as investments are made in operating income expense lines with respect to grocery and the expansion of the same-day footprint. CEO Jassy clarified the picture with his answer, saying same-day facilities are the most cost-effective mechanisms and fulfillment vehicles (emphasis added):
In general, they’re smaller facilities with less conveyance and with more streamlined pick directly to pack and to get out to the dock to ship. And so they’re just much more efficient as well. So we actually think that the expansion of those is going to not just help with speed and with demand, but we’re going to also like the cost structure associated with that. And I continue to believe what I said last quarter, Brian, which is I do believe that we’ll get back to margins like what we had pre COVID. And I don’t think that’s the end of what’s possible for us there.
Valuation
I like to look at Amazon’s valuation with a sum of the parts lens where AWS is separated from other segments. The 2004 letter to shareholders from then CEO Jeff Bezos says it is free cash flow (“FCF”) as opposed to earnings that matters from a valuation standpoint (emphasis added):
Our ultimate financial measure, and the one we most want to drive over the long-term, is free cash flow per share. Why not focus first and foremost, as many do, on earnings, earnings per share or earnings growth? The simple answer is that earnings don’t directly translate into cash flows, and shares are worth only the present value of their future cash flows, not the present value of their future earnings. Future earnings are a component – but not the only important component – of future cash flow per share. Working capital and capital expenditures are also important, as is future share dilution.
There are several challenges making it hard for us to do a sum of the parts valuation based on FCF. The first challenge is Amazon not breaking down FCF by segment. CFO Olsavsky did give us some hints about the FCF improvements in the 2Q23 call, saying the largest driver has been increased operating income, most notably in North America (emphasis added):
On a trailing 12-month basis, free cash flow was positive and improved for the fourth sequential quarter. Our financial focus remains on driving long-term sustainable free cash flows. The largest driver of the recent improvement in free cash flow is our increased operating income, most notably in the North America and international segments where, as I said, we’ve made meaningful improvement in our fulfillment network productivity and operating leverage and benefited from moderating inflationary pressures.
CFO Olsavsky also cites improved working capital contributions, saying inventory efficiency has improved as we’ve gotten past supply chain disruptions. A second challenge to a sum of the parts FCF valuation is Amazon not differentiating between growth capex and maintenance capex. A third challenge is Amazon not breaking out investments in income statement lines outside of depreciation. Complications with lease repayments and obligations also make it difficult to see a clear picture of economic FCF. We do know that Amazon has TTM cash provided by operating activities of 61,841 million including AWS while the figure for Walmart (WMT) is $37,232 million or $4,633 million + $28,841 million – $(3,758) million.
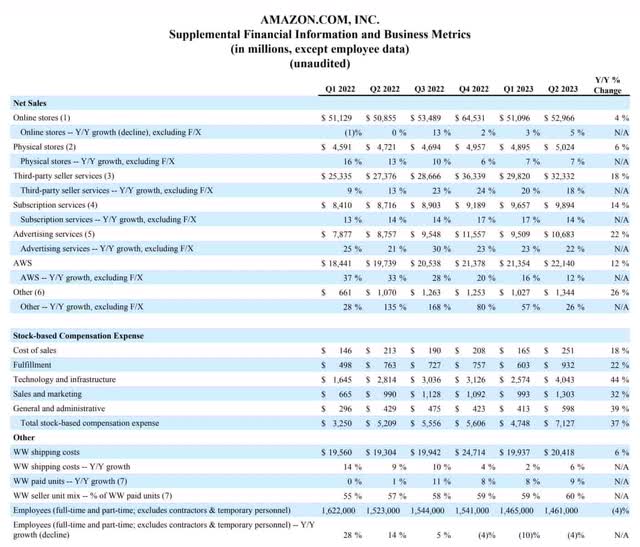
The decrease in year over year (“Y/Y”) sales growth at AWS is concerning. 1Q22 sales were 37% higher than 1Q21 but the Y/Y growth rate for this segment has gone down every quarter since such that 2Q23 sales were only 12% higher than 2Q22 sales:

Amazon segment revenue (2Q23 release)
Trailing twelve month (“TTM”) North America operating income is $3,457 million or $4,109 million + $(2,847) million – $(2,195) million and this comes from sales of $331,633 million or $159,427 million + $315,880 million – $143,674 million. TTM International operating income is $(6,836) million or $(2,142) million + $(7,746) million – $(3,052) million on revenue of $121,003 million or $58,820 million + $118,007 million – $55,824 million. TTM AWS operating income is $21,096 million or $10,488 million + $22,841 million – $12,233 million on revenue of $85,410 million or $43,494 million + $80,096 million – $38,180 million.
I don’t think F/X issues alone explain all the pain we’re seeing on the International side. We could be mollified with the International operating losses if there was robust revenue growth, but 2Q23 International revenue of $29,697 million was only 9.7% higher than 2Q22 revenue of $27,065 million while 2Q23 North America revenue of $82,546 million was 10.9% higher than 2Q22 revenue of $74,430 million.
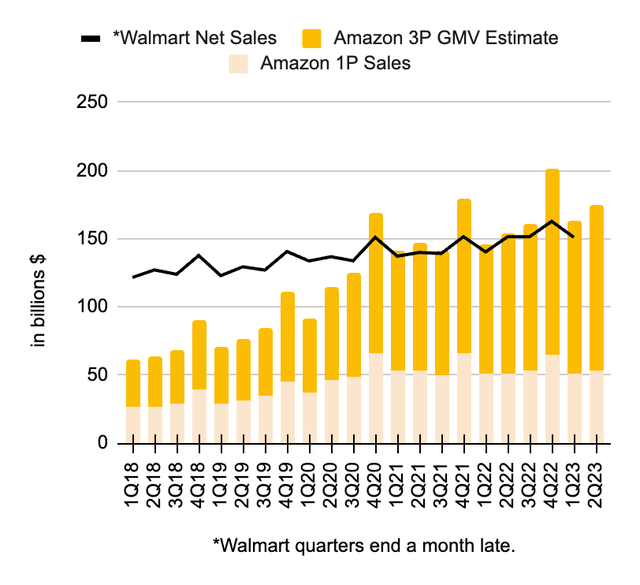
Walmart had TTM operating income through April 2023 of $21,350 million or $6,240 million + $20,428 million – $5,318 million based on revenue of $622,021 million or $152,301 million + $611,289 million – $141,569 million for an overall operating margin of 3.5%. Amazon already moves more merchandise than Walmart and Amazon is growing faster:

Amazon vs Walmart (Author’s spreadsheet)
Despite my frustrations with Amazon’s International segment, I think the non-AWS segments of Amazon are worth about two Walmarts (WMT) or maybe 5% more.
The market cap for Walmart is $433 billion based on the 2,692,835,112 shares in the 10-Q through April and the August 9 share price of $160.92. As such, I believe the non-AWS segments of Amazon are worth $865 to $910 billion when rounding to the nearest $5 billion.
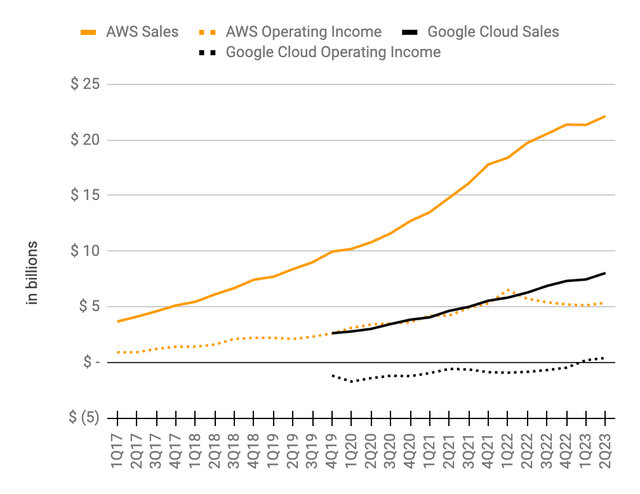
Despite short-term challenges at AWS, I am getting more optimistic about the long-term valuation as there doesn’t seem to be room for more than three hyperscale cloud companies and I am hopeful they will compete rationally. Google Cloud (GOOG) (GOOGL) had 2Q23 operating income of $395 million on revenue of $8,031 million and it was the second quarter in a row with positive operating income. This is a positive development because it shows that Amazon, Microsoft (MSFT) and Google, the hyperscale cloud companies, can all grow not just revenue but operating income as well. The barriers are too high for a fourth hyperscale cloud competitor to enter the picture any time soon and I think the existing companies will begin to prioritize profit over market share:

AWS vs Google Cloud (Author’s spreadsheet)
I think AWS is worth 25 to 27x the TTM operating income of $21.1 billion implying a range of $530 to $570 billion when rounding to the nearest $5 billion.
Summing up, I think Amazon is worth about $1.395 to $1.480 trillion.
The 2023 10-Q shows 10,317,750,796 shares as of July 21, 2023. Multiplying this count by the August 9 share price of $137.85 gives us a market cap of $1.422 trillion. The market cap is inside my valuation range so I think the stock is a hold.
Disclaimer: Any material in this article should not be relied on as a formal investment recommendation. Never buy a stock without doing your own thorough research.
Analyst’s Disclosure: I/we have a beneficial long position in the shares of AMZN, GOOG, GOOGL, TSM, VOO either through stock ownership, options, or other derivatives. I wrote this article myself, and it expresses my own opinions. I am not receiving compensation for it (other than from Seeking Alpha). I have no business relationship with any company whose stock is mentioned in this article.
Seeking Alpha’s Disclosure: Past performance is no guarantee of future results. No recommendation or advice is being given as to whether any investment is suitable for a particular investor. Any views or opinions expressed above may not reflect those of Seeking Alpha as a whole. Seeking Alpha is not a licensed securities dealer, broker or US investment adviser or investment bank. Our analysts are third party authors that include both professional investors and individual investors who may not be licensed or certified by any institute or regulatory body.
