Summary:
- eBay’s future remains misunderstood and undervalued, despite slow to no growth in revenues.
- Amazon remains overvalued, especially if a recession hits in 2023, because of slim margins.
- I have suggested a successful spread trade, long eBay vs. short Amazon since the end of 2020.
- This trade may work again in 2023.
Kativ/iStock Unreleased via Getty Images
At the end of December 2020 here, I suggested a successful spread trade idea would be to own eBay Inc. (NASDAQ:EBAY) as a long position, equally weighted against Amazon.com Inc. (NASDAQ:AMZN) as a short. The goal was to reduce coming volatility and downward moves in the overall market, while pairing something of a high-margin value pick against a low-margin growth favorite (with Amazon extremely stretched for a valuation during the middle of the COVID pandemic ship-to-home craze). And, this trade has worked out quite handsomely over two years and several months, with eBay delivering a slight total return loss of -2.5% vs. a substantial -41.7% loss from Amazon.
YCharts – eBay vs. Amazon, Total Returns since December 30th, 2020 StockCharts.com – eBay, 26 Months of Daily Price & Volume Changes StockCharts.com – Amazon, 26 Months of Daily Price & Volume Changes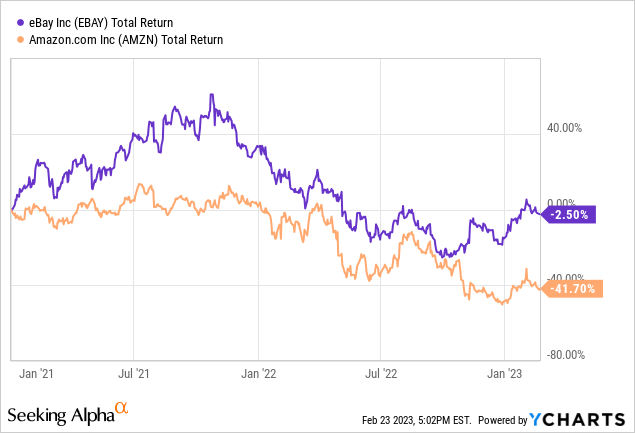
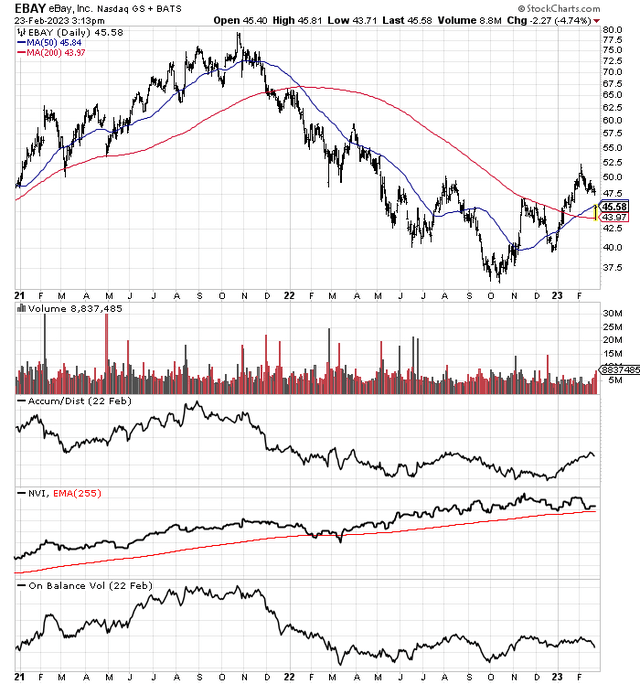
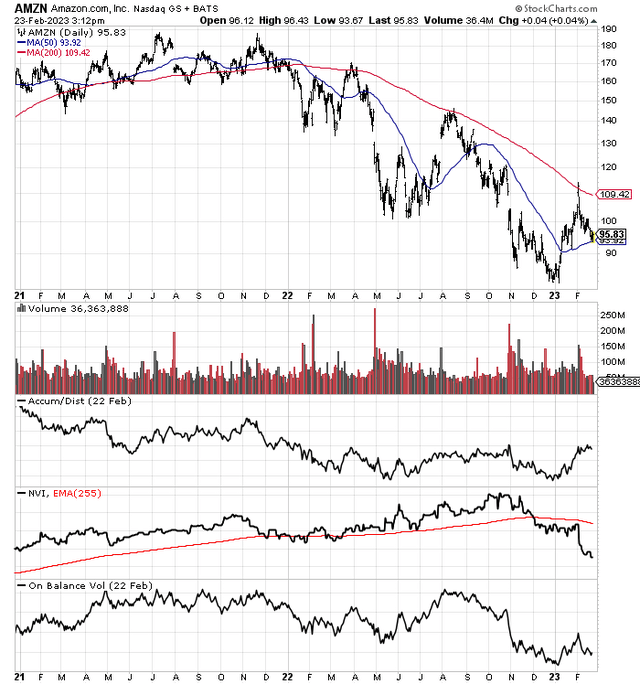
Granted the +39% net theoretical return (before trading expenses and any margin interest on the short transaction) has not been spectacular (+30% including fair carrying costs), but it has bested the minimal +10% investment performance of a buy-and-hold total return outlined by the SPDR S&P 500 ETF (SPY) since the end of December 2020.
In fact, eBay has been “outperforming” Amazon since March 2020, almost 3 years ago. Why? Starting valuations are the first reason. Amazon has been coming off nosebleed valuation territory and sky-high Wall Street excitement after the pandemic peak in shipping supplies to your home. The second reason from the middle of 2022 is eBay will likely survive a recession in consumer demand far better than Amazon’s retail-dependent business model. The main difference for this setup is eBay’s super-strong profit margins vs. Amazon’s relatively low return on sales.
The interesting part of the historical record is eBay’s share price (plus a small dividend) divided by Amazon’s equivalent value bottomed just as the U.S. economy was shut down during March-April 2020. I have circled in green this long-term change in performance. At that point, the lack of Wall Street interest in eBay before the pandemic, a major restructuring and refocus on the core eBay product listing online website, and a monster share repurchase program have supported its quote.
StockCharts.com – eBay vs. Amazon, Relative Share Price Performance, 10 Years, Author Reference Point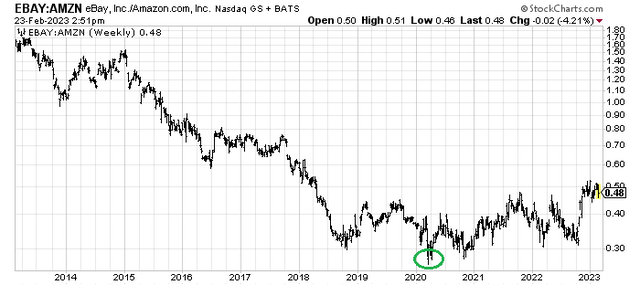
I remain confident eBay will continue to beat Amazon for investment performance (possibly for another 6-12 months) as the valuations of these online retailers continue to converge. In addition, my primary worry for Amazon is operating results grow best during a low-inflation, economic expansion backdrop. Without sales growth, slight margins are at risk of a big decline.
Amazon’s Margin Risk
In a recessionary environment, which is my baseline forecast backed by the 40-year record inversion in the Treasury yield curve during late 2022 into early 2023, I expect eBay’s earnings to hold up better. Why? During a flat sales period, companies with higher margins usually witness smaller percentage decreases in cash flow and income. Well, the difference in margins is night and day between the two. Below is a graph of gross and operating profit margins. eBay’s 25% trailing operating margin is a real plus vs. Amazon’s 2.4%, assuming sales stagnate. If margins shrink 3% equally for both, eBay is still wildly profitable, while Amazon is breakeven to a money burner (potentially having to issues shares or borrow capital to pay bills).
YCharts – eBay vs. Amazon, Gross & Operating Profit Margins, 3 Years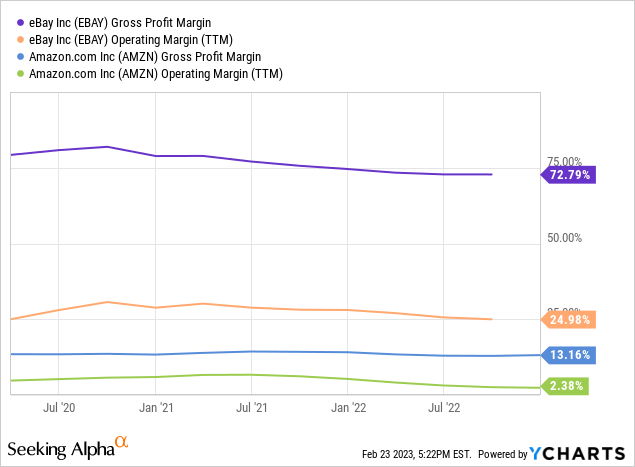
Value vs. Growth
In the end, the two represent a classic “value” vs. “growth” equity investment battle. eBay is priced at less than 10x EPS estimates for 2025, while Amazon stands at 30x EPS estimates three years out. If a recession hurts future income growth, the multiple is even higher. All else being equal and assuming neither business will grow quickly in 2023, shouldn’t investors decide to own the lower P/E business and shun an extended and riskier choice?
YCharts – eBay vs. Amazon, Forward Earnings Forecast 2023-25, Made on Feb 23rd, 2023, 9-Month Changes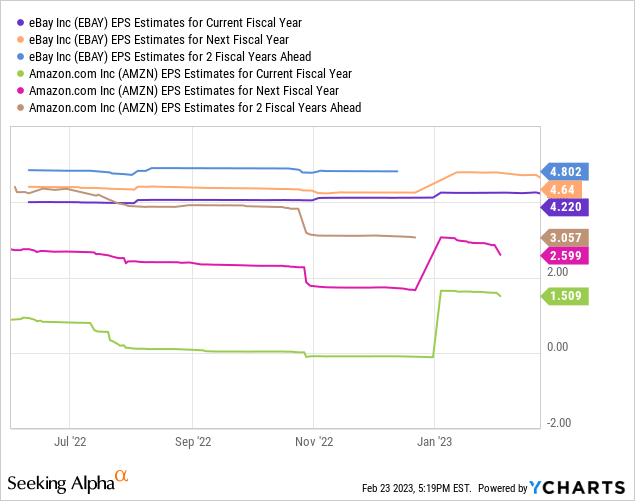
Earnings and Free Cash Flow Yields
When you get down to investing basics, owners of a business want cash in their pocket, pure and simple. Earnings and free cash flow yields are the way to gauge and compare probable and actual cash returns on your investment dollar (using current stock quotes).
The “forward” earnings yield story is drawn below, as Wall Street likes to look into the future. This week’s minor selloff in eBay and confirmed guidance has helped the projected 2023 earnings yield to a terrific number above 9.3%. Amazon’s 1.6% yield does not come close to cost-of-living adjustments in the U.S. CPI of 6.4%. Why do you want to own a business struggling in a recession, that is throwing off a negative -4.8% “real” inflation-adjusted return on your upfront investment? I do not.
YCharts – eBay vs. Amazon, Forward Earnings Yield, 6 Months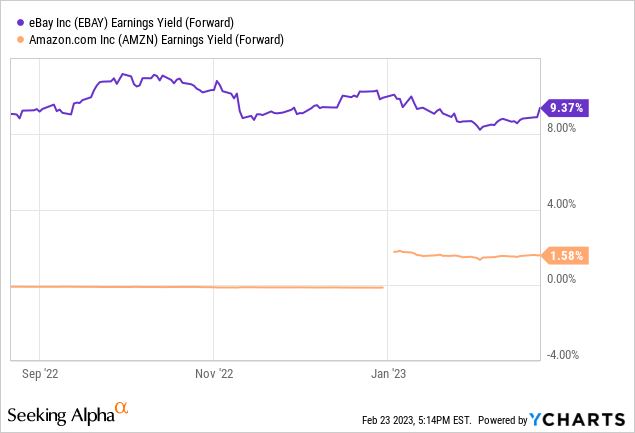
The 5.6% trailing free cash flow yield is also tilted in favor of eBay ownership. Shareholders are almost able to claim victory over general inflation for a current business return on investment at $45 per share. On the other hand, Amazon continues to burn cash at a rate of -1.7% on your initial investment at $96 per share, on CapEx decisions to spend on new buildings/vehicles for deliveries and expand its massive computer network (running the retail sales website and AWS cloud resale unit).
YCharts – eBay vs. Amazon, Free Cash Flow Yield, 6 Months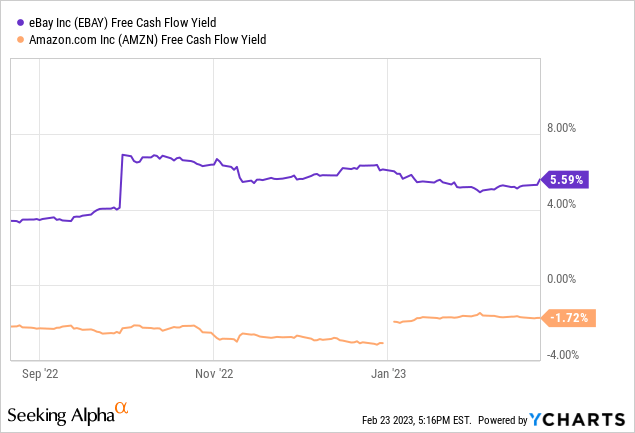
Return of Shareholder Capital
Another reason to contemplate owning eBay over Amazon is the former company has been very generous paying a cash dividend and returning capital throughs share buybacks (while leveraging your ownership interest in future operating results). eBay has been able to afford a massive reduction in the share count by liquidating a number of noncore assets in Europe and South Korea, on top of reinvesting sizable cash flow coming in the door each year. Amazon, conversely, does not pay a regular dividend, while share buybacks have been minimal (lacking the tens of billions in cash flow to both grow its shipping network and engage in share buybacks). eBay’s outstanding share count has shrunk by 32% since the beginning of 2020, vs. Amazon’s net INCREASE of 3% (including smaller acquisitions paid with stock and $42 billion in stock-based compensation for employees over three years).
The added physical demand for eBay shares has also been an important prop for a stronger stock quote since early 2020. The “net payout yield” for each enterprise including dividends paid and the sum of share buybacks minus new issuance is drawn below.
YCharts – eBay vs. Amazon, Net Payout Yield, 3 Years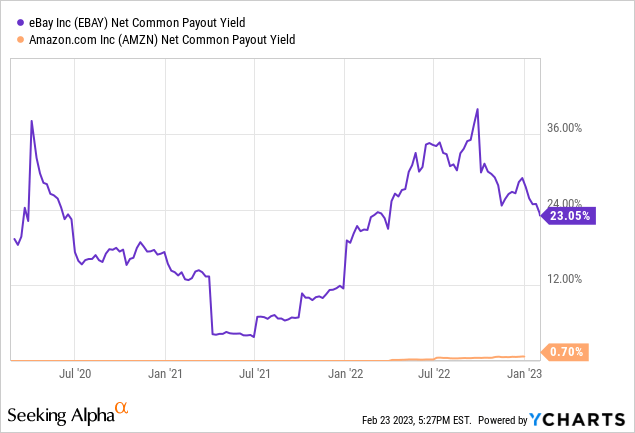
Final Thoughts
For an expanded explanation of my feelings and forecasts for both companies, you can review previous articles from November. My last bullish eBay write-up is linked here. My latest full-length bearish view on Amazon can be found here. Until the looming 2023 recession (or slowdown in retail spend at a minimum) has been fully felt by consumers and businesses, I remain of the view eBay is a better place to park your investment money.
What change could emerge to help Amazon outperform eBay? I don’t really envision a flip in the equation anytime soon, where I recommend Amazon as a Buy and eBay as a Sell/Short (the opposite of my current view). More than likely, a far lower Amazon price under $70 will appear this year, as recession spending by consumers hits cash flow and earnings.
Once the realization of slower Amazon growth is priced into shares, I plan on moving to a Hold or Buy rating. The “spread” trade idea ends at that point, where both companies have mathematical logic for long-term ownership. Eventually, if eBay and Amazon rise together in 2024, a better investment strategy would be to hold both names. But, I expect new downside in Amazon to play out first.
For another opinion, Seeking Alpha’s Quant Rankings are fairly equal, meaning this tool will not add much value in determining which will be the leading choice for 2023.
Seeking Alpha Quant Rank – eBay, February 23rd, 2023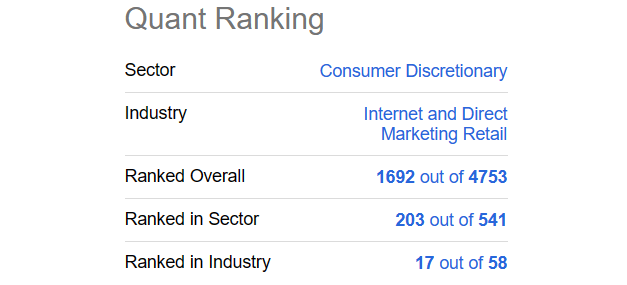
Seeking Alpha Quant Rank – Amazon, February 23rd, 2023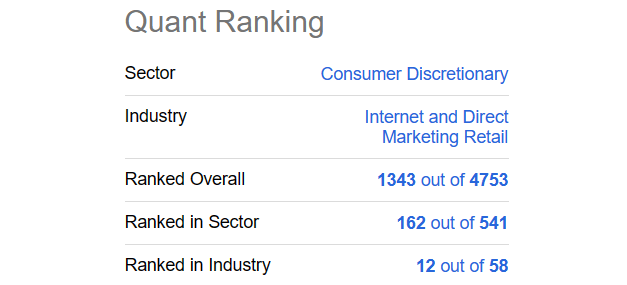
For target pricing, in 12-months I am projecting an eBay quote in the $50-$60 area, good for +12% to +34% as a total return, including the new dividend rate now above 2% annually. A forward P/E in the 11-13x zone makes sense for a floor valuation, with slow growth in the operating business and an inflation rate around 4%. In terms of Amazon, I am in the $70 to $90 range for a 1-year price estimate (-5% to -25% total return), depending on the severity of recession and the U.S. interest rate level. Putting a forward P/E multiple of 27-35x still seems rich to me, but a sliding inflation rate by the end of 2023 (encouraging higher P/Es for equities) and a “growth” premium may remain the Wall Street argument. However you slice it, some convergence in the valuation difference between the two should play out again this year as the economy cools.
Thanks for reading. Please consider this article a first step in your due diligence process. Consulting with a registered and experienced investment advisor is recommended before making any trade.
Disclosure: I/we have no stock, option or similar derivative position in any of the companies mentioned, but may initiate a beneficial Long position through a purchase of the stock, or the purchase of call options or similar derivatives in EBAY over the next 72 hours. I wrote this article myself, and it expresses my own opinions. I am not receiving compensation for it (other than from Seeking Alpha). I have no business relationship with any company whose stock is mentioned in this article.
Additional disclosure: I may Short AMZN over the next 72 hours.
This writing is for educational and informational purposes only. All opinions expressed herein are not investment recommendations, and are not meant to be relied upon in investment decisions. The author is not acting in an investment advisor capacity and is not a registered investment advisor. The author recommends investors consult a qualified investment advisor before making any trade. Any projections, market outlooks or estimates herein are forward looking statements and are based upon certain assumptions and should not be construed to be indicative of actual events that will occur. This article is not an investment research report, but an opinion written at a point in time. The author’s opinions expressed herein address only a small cross-section of data related to an investment in securities mentioned. Any analysis presented is based on incomplete information, and is limited in scope and accuracy. The information and data in this article are obtained from sources believed to be reliable, but their accuracy and completeness are not guaranteed. The author expressly disclaims all liability for errors and omissions in the service and for the use or interpretation by others of information contained herein. Any and all opinions, estimates, and conclusions are based on the author’s best judgment at the time of publication, and are subject to change without notice. The author undertakes no obligation to correct, update or revise the information in this document or to otherwise provide any additional materials. Past performance is no guarantee of future returns.
