Summary:
- Amazon’s first-quarter earnings and revenue exceeded market expectations, with per-share earnings of $0.98 and revenues of $143.31 billion.
- The company’s cloud computing segment, Amazon Web Services, generated revenues of $25 billion and accounted for over 60% of quarterly operating profits.
- Amazon’s operating income for the quarter was $15.3 billion, indicating significant growth and confirming the efficacy of CEO Andy Jassy’s cost-cutting efforts.
- Lack of selling pressure despite the presence of nearby historical resistance levels suggests a strong upside break in share price action might be imminent.
4kodiak
Amazon.com, Inc. (NASDAQ:AMZN) recorded first-quarter earnings this week, which broadly surpassed market expectations (both in terms of earnings and revenue). For the period, Amazon posted a per-share earnings figure of $0.98 (against consensus expectations of just $0.83 per share) and revenues of $143.31 billion (against expectations of $142.5 billion).
Highlights of particular importance were seen in the company’s cloud computing segment, where Amazon Web Services (AWS) generated revenues of $25 billion (against consensus expectations of $24.5 billion) and produced over 60% of the company’s operating profits. Other areas of strength could be found in Amazon’s advertising segment, which generated revenues of $11.8 billion (against expectations of $11.7 billion).
Incredibly, Amazon’s operating income for the first-quarter period posted at $15.3 billion (indicating growth rates of over 200%), and this performance largely confirms the efficacy of CEO Andy Jassy’s cost-cutting strategies conducted in an effort to further strengthen earnings performances. Overall, Amazon saw its net income figures rise from $3.17 billion (or $0.31 per share) during the first quarter last year to $10.4 billion during the most recent reporting period.
Looking forward, company guidance indicates further profitability gains during the second-quarter period, but growth rates are likely to slow from these dramatic rates. Specifically, operating income for the period is now expected to post within a $10 billion to $14 billion range (up from the $7.7 billion figure that was reported during the prior year) and revenues are expected to rise within a range of $144 billion to $149 billion (which would indicate growth rates of between 7-11%). Ultimately, even while maintaining strong rates of anticipated growth, these guidance figures did fall short of Wall Street’s prior consensus estimates calling for quarterly revenues of $150.1 billion (or an annualized revenue growth rate of 12% for the period).
AMZN: Monthly Chart (Income Generator via TradingView)
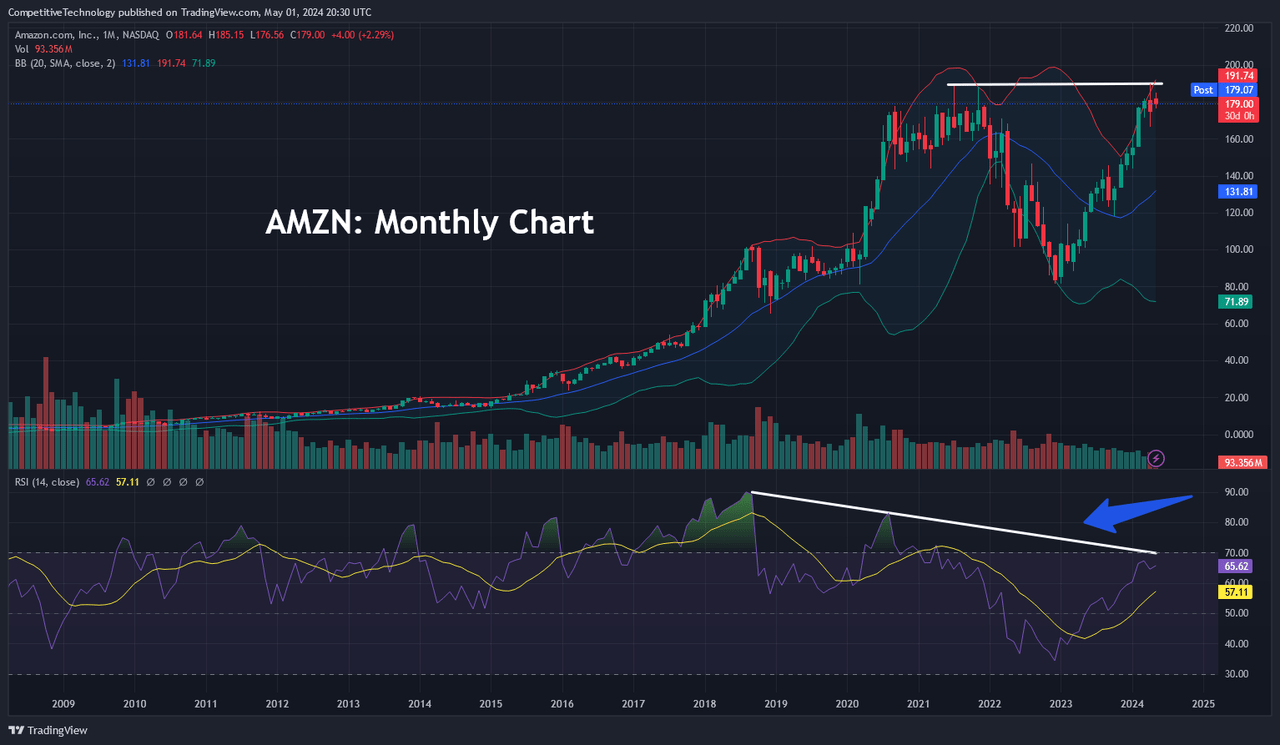
On the monthly charts, it is clear that we are currently moving into technical price zones that could establish cause for concern for some investors. Specifically, market valuations are currently contending with a resistance zone that marked the stock’s prior all-time highs at $188.65 (posted in January 2021). Of course, this area was re-tested again in November 2021, but the forceful rejection here sent stock prices much lower over the following 12-month period.
Since these initial tests above $188 were both spike highs, this structure can be referred to as a Tweezer Top formation – and this is the critical price zone that bull traders are currently contending with once again. We did see an actual break of this resistance level last month (April 2024) with new all-time highs of $189.77 generated in the process. Unfortunately, April did close with a red candle (indicating that the AMZN close was lower than its open), and monthly indicator readings in the Relative Strength Index (RSI) have been bearish for an extended period of time (shown in the chart above).
On balance, these events can be viewed as bearish influences occurring at a highly critical historical resistance zone – and many investors might use these signals as a reason to begin selling the stock in anticipation of a significant move lower (perhaps similar to the massive -56.6% declines that occurred from November 2021 to December 2022). However, given Amazon’s strong first-quarter earnings beat and the lack of substantial selling pressure that we are seeing into these bearish technical formations, it appears as though an important upside resistance break is much more likely than a failure near current levels.
AMZN: Weekly Chart (Income Generator via TradingView)
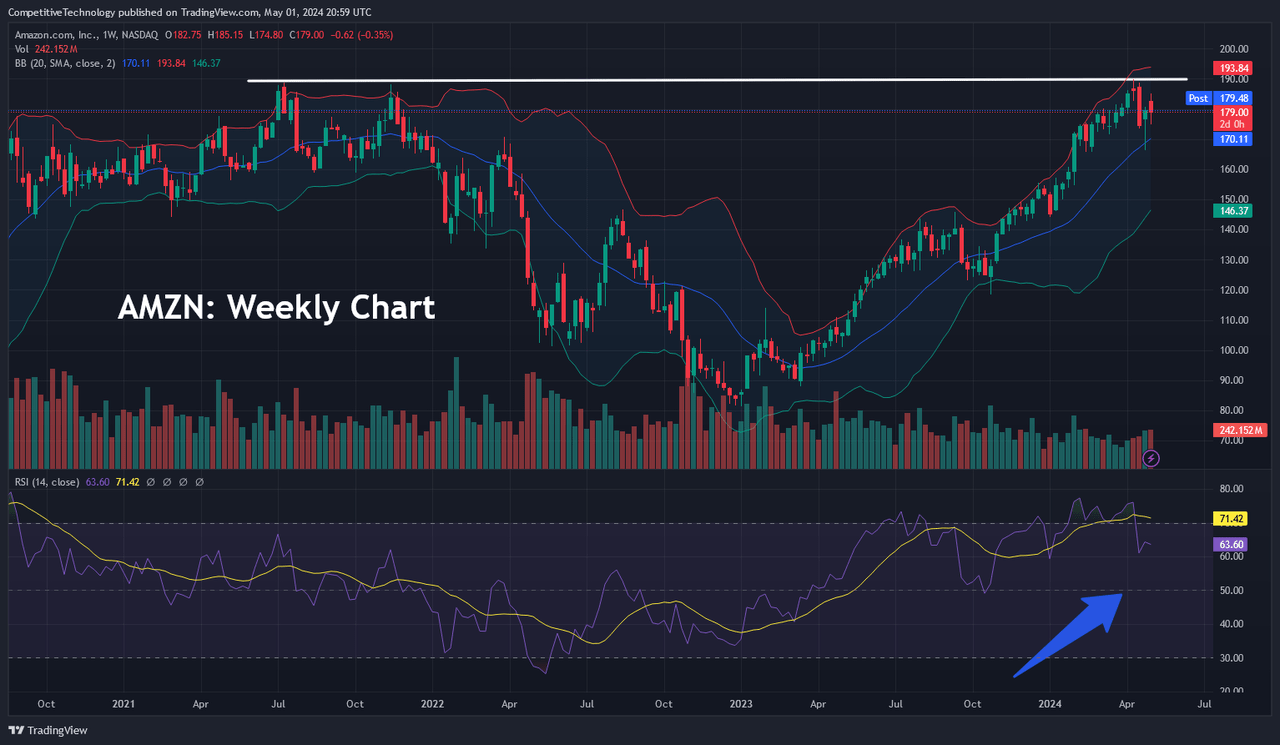
Moving down to the weekly charts, we can see this important resistance formation in a slightly different context. As of yet, we have not posted a weekly close above this critical resistance area, so there is still some possibility of an ultimate price rejection in this area. Of course, if this did occur, the strength of the market resistance beneath the $190 area would be viewed with a much higher level of importance and traders would likely be much more prepared to sell the stock upon future approaches of this level.
Weekly indicator readings in the RSI have just rolled out of the overbought territory, however, so we find this potential outcome to be relatively unlikely. An upside break here would force Amazon shares into “uncharted” territory (literally) – and there would be no historical resistance levels to monitor near-term. Of course, this makes technical analysis positioning much more difficult, but there are still charting tools available that can help us assess where price action might start to be contained going forward.
AMZN: Standard Deviation Channels (Income Generator via TradingView)
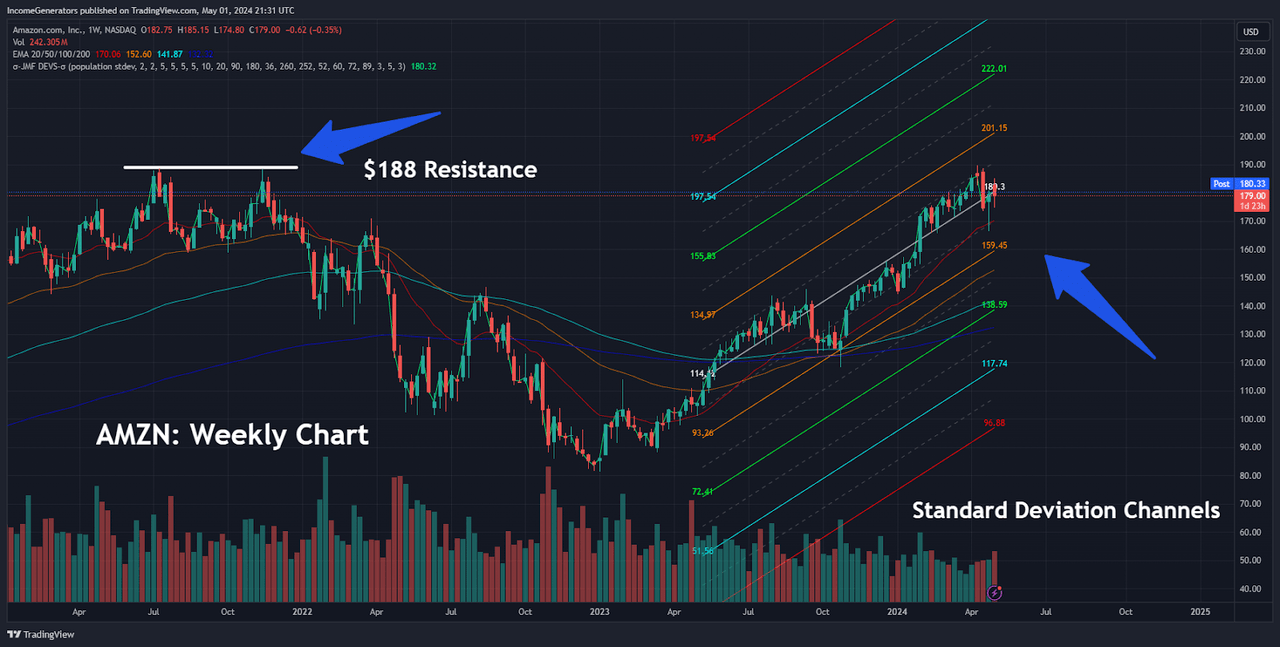
Specifically, we prefer to use standard deviation channels as a way of identifying potential resistance levels during these types of situations. Since we do not have historical price failures overhead, standard deviation studies are plotted around a linear regression line so that we can better identify extreme activity in the underlying price trend. In other words, these studies use established changes in prior trend activity in order to determine the extent to which market prices might rally before upward moves start to become excessive (and begin to fail).
Here, we can see that standard deviation studies do not project potential price failures until we are above the $200 handle (with initial projected resistance zones of $201.15 and $221.01, followed by $242.86 and $263.72). On the downside, we believe that it will be important to watch the potential support zone just below $170 as this area marks a confluence of technical influences (20-week exponential moving average and spike lows from April 22nd at $166.32) that could contain prices and prevent valuations from falling further. However, if we do see a bearish break in this area, we would revert our stance from bullish to sideways-neutral until clearer chart signals begin to develop.
On balance, we maintain our positive outlook and plan to hold our long position in anticipation of an upside break above nearby resistance levels. Amazon’s earnings results for the first-quarter period were highly impressive and suggest that Andy Jassy’s cost-cutting efforts have produced substantial improvements for the company.
Unfortunately, Amazon has chosen not to offer quarterly dividend payments to investors, despite reporting nearly $74 billion in cash and equivalents during the first quarter. Of course, similar decisions were recently implemented by Meta Platforms (META) and Alphabet (GOOG), so it stands to reason that Amazon might be considering a competitive incentive like this in the quarters ahead. However, until an announcement like this actually materializes, readers who are interested in these recent dividend developments in the mega-cap tech sector can read our META analysis here and our GOOG analysis here.
Analyst’s Disclosure: I/we have a beneficial long position in the shares of AMZN either through stock ownership, options, or other derivatives. I wrote this article myself, and it expresses my own opinions. I am not receiving compensation for it (other than from Seeking Alpha). I have no business relationship with any company whose stock is mentioned in this article.
Seeking Alpha’s Disclosure: Past performance is no guarantee of future results. No recommendation or advice is being given as to whether any investment is suitable for a particular investor. Any views or opinions expressed above may not reflect those of Seeking Alpha as a whole. Seeking Alpha is not a licensed securities dealer, broker or US investment adviser or investment bank. Our analysts are third party authors that include both professional investors and individual investors who may not be licensed or certified by any institute or regulatory body.
