Summary:
- Amazon’s fiscal year 2023 saw record sales and profitability, with operating profit almost tripling to $36.9 billion.
- The company’s investments in fulfillment capabilities are reducing costs and delivery times while it simultaneously benefits from a shift to higher margin businesses like AWS and Advertising.
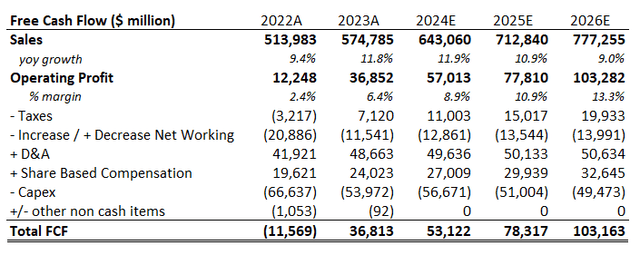
- Amazon is set up for multi-year period of profitable growth and should generate over $100 billion in free cash flow by 2026. Target share price: $251 – BUY.
tigerstrawberry/iStock Editorial via Getty Images
Investment Thesis
Amazon (NASDAQ:AMZN) posted record sales and profitability numbers for fiscal year 2023 almost tripling operating profit to $36.9 billion compared to the previous year. The company’s investments into its fulfilment network are paying off reducing overall costs and delivery times to customers. At the same time Amazon is benefitting from the ongoing shift of its sales mix into higher margin business like Amazon Web Services or Advertising.
The 2023 operating margin of 6.4% has exceeded the previous record level of 5.9% achieved in 2020. However, in 2020 Online and Physical Stores accounted for 55% of total sales. This contribution has fallen to 44% in 2023 and should fall further within the next few years. Hence, the improvement of the operating margin should have just begun setting up Amazon’s profitability on a multi-year growth path.
Estimating sales growth and operating margin for the coming three years we see Amazon generating free cash flow in excess of $100 billion by 2026. Valued at a 4% free cash flow yield this results in a target share price of $251. BUY
Financials – 2023 Review and 2024 Outlook
Amazon delivered strong Q4 2023 financials with net sales growing by 14% year on year to $170 billion (consensus $166.2 bn) and more importantly operating income surging to $13.2 billion smashing consensus estimates of $10.5 billion and the company’s own guidance of $7 to $11 billion. In Q4 2022 Amazon’s operating income stood at $2.7 billion.
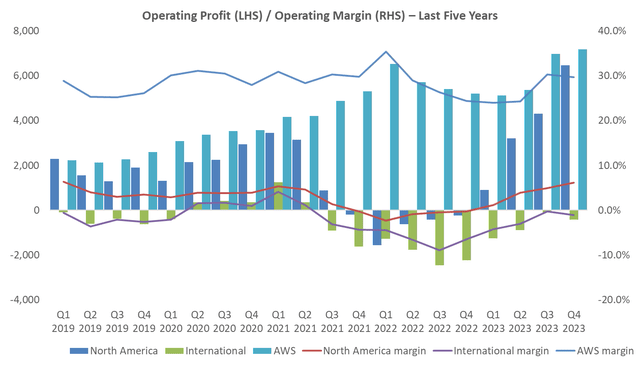
The operating margin came in at 7.8% and was driven by beats in all three segments. AWS sales growth accelerated by 100 bps to 13%, the first acceleration in 7 quarters while boosting the operating margin by more than 500 bps to 29.6% compared to Q4 2022. The North America segment’s margin increased to 6.1%, the highest level since Q1 2019. The operating loss in the International segment decreased to $419 million (-1% profit margin) compared to a loss of $2.2 billion in the last quarter of 2022.
While the company’s profitability was dependent on its AWS business in 2021 and 2022 the North America segment’s operating profit is closing the gap to AWS in absolute terms and the International business is nearing break even.
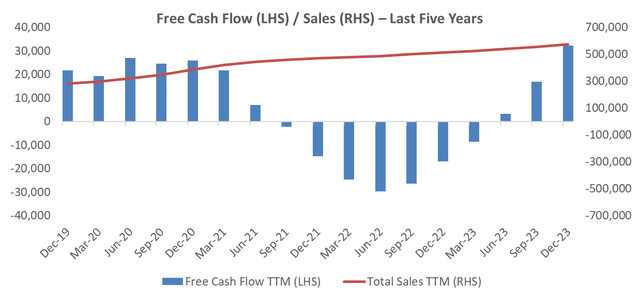
In conjunction with its improved operating performance the company’s cash conversion has also increased significantly. By Q4 2023 the trailing twelve months free cash flow surpassed the levels reached prior to the pandemic area and the company massive investment in upgrading its fulfillment infrastructure. However, given that the company’s sales have more than doubled within the last 5 years significant further upside remains.
Looking at the company’s guidance for Q1 2024 it expects revenues of $138 billion to $143 billion and operating income between $8 and 12 billion. While this implies a deceleration from Q4 2023 it still corresponds to sales growth of around 10% and a doubling of operating income compared to Q1 2023.
2024-2026 Outlook
While Amazon’s sales have more than doubled in the last five years the company’s profitability and cash conversion have lagged. The company expects capex to increase in 2024 again as they look to add capacity in AWS for regional expansion and investments in generative AI. However, mid-term the company’s cash generation is poised to accelerate. The investments into its fulfilment network are starting to pay off with lower unit costs and faster delivery speeds. More important though, Amazon displays a very different sales mix today compared to four or five years ago.
While the company does only provide operating profits along its main three segments: AWS, North America and International the shift in its sales mix offers a hint that there is substantial upside in the company’s profitability in the years to come. Ignoring “Other” the company’s Advertising business has shown the highest growth rate in the last 5 years increasing at an annually compounded growth rate of more than 37%. The second and third biggest contributing segments to sales growth have been the high margin AWS business and the Third Party Seller Services. Both segments grew by 27% per year between 2019 and 2023. On the other hand, sales in Online and Physical stores grew only by 13% and 4% over the same time period, respectively.
Revenues – Segment breakdown
Amazon 10K, Split into Advertising and Other pre 2021 based on own estimates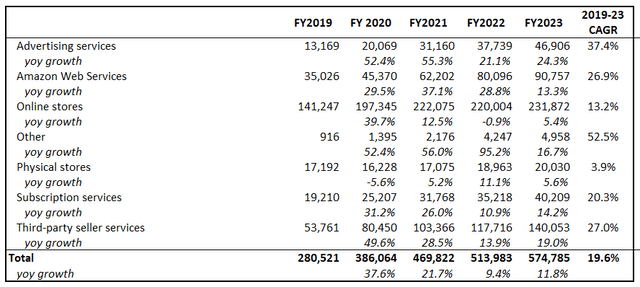
While the arguably lowest margin business of Amazon (Online / Physical Stores) represented more than 55% of sales in 2019 and 2020 this contribution fell to less than 44% by 2023. The combined sales contribution of AWS, Advertising and Third Party Seller Services increased from around 36% in 2019 to more than 48% by 2023. Given anticipated higher growth rates for these business going forward their relative contribution to Amazon’s total sales should subsequently increase in the years to come.
Amazon 10K, Split into Advertising and Other pre 2021 based on own estimates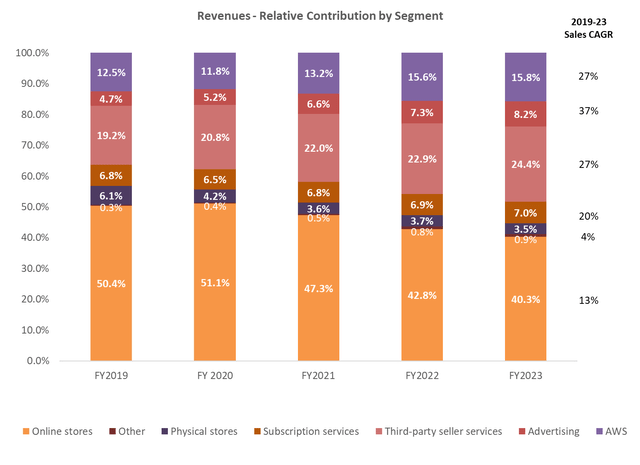
The evolution of Amazon’s sales mix will play a pivotal role in determining its future profitability. AWS’s growth is poised to accelerate again given the recent pick up caused by the needs of AI. Amazon’s Advertising business is still relatively small providing ample opportunity for further growth. It should receive a boost by its recent move to show advertisements on its Prime Video streaming service. The Third Party Seller Service business should also continue to grow comfortably in the double digit area. At the same time the relative sales contribution of the Online Store and Physical Store business will likely decline further with growth rates in the single digit area.
Amazon 10K for 2023, 2024-2026 NHM Capital estimates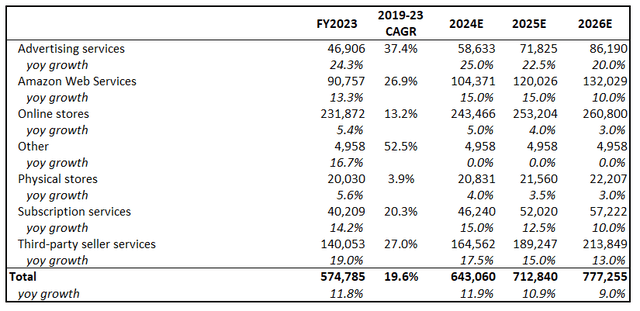
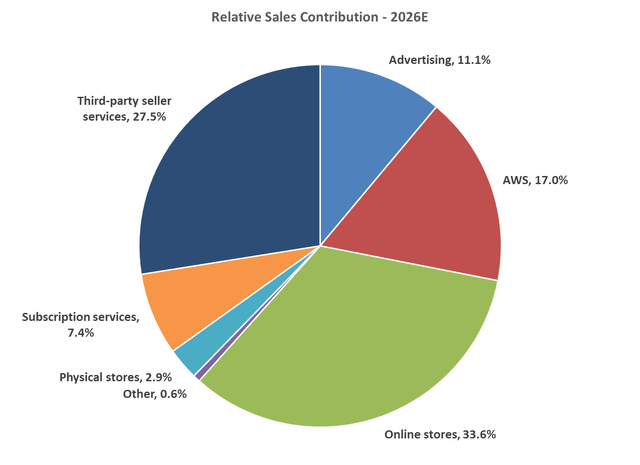
Based on these assumptions Amazon’s self-run retail operations (excluding Third Party Sellers Services) are expected to contribute less than 37% to its overall sales number by 2026.
Valuation Considerations
To derive a free cash flow model we look at the potential profitability of the individual segments. We assume AWS will be able to defend its recent margin of around 30%. The Advertising business should be able to achieve similar margins.
Google (GOOGL) services has generated an operating margin of 35% in 2023 , Meta’s advertising operating margin was in excess of 47% in 2023. Hence, for valuation purposes we assume that Amazon’s Advertising business generates an operating margin of 30% by 2026. The margin in the Third Party Sellers Services business is harder to estimate. On the one hand it should have a much higher margin than Amazon’s Online Stores as the sales numbers do not represent the gross merchandise value sold on Amazon’s marketplace but only the fees associated with it. Third party sellers need to sign up for a selling plan with monthly costs and need to pay a referral fee for any product sold via Amazon’s marketplace. In addition, sellers might use Amazon’s fulfilment infrastructure at further costs. Hence, the operating margin for the Third Party Sellers Services is most likely a blend of higher margin selling plan / referral fees and lower margin fulfilment services. For the former one might look at other marketplace operators like eBay (EBAY) that generated a GAAP operating margin of 19.2% in 2023. To estimate the margin for the fulfilment business one could look at peers like FedEx (FDX) or UPS that disclosed operating margins of 6.3% and 10% in their recent financial updates. In conclusion, a blended margin in excess of 10% should be a defendable assumption for Amazon’s Third Party Sellers Services.
For the remaining business we assume a long term low single digit margin for Online and Physical Stores and no margin for the subscription business rather looking at it as a cost of running the large retail operation. At this point we are not attributing any value to Amazon’s Prime Video business. The opportunity of selling advertising via its Prime Video to the user base of more than 200 million members is captured in the growth of the advertising segment though.
Consequently, Amazon should be capable of generating a free cash flow in excess of $100 billion by 2026. While the 2026 operating margin of 13.4% looks very optimistic compared to the most recent margin of 6.4% in 2023 it is worth noting that the 2026 margin excluding AWS and Advertising is 6.8% only. Stripping out the Third Party Seller Services as well results in an expected operating margin for the remaining business of only 2.9%.
Valuing Amazon at a 4% 2026E free cash flow yield results in a target enterprise value of around $2.579 trillion. To account for the share based compensation in the years to come we increase the number of diluted shares outstanding to 11 million by 2026. Due to the expected strong cash flow generation Amazon should switch from a net debt into a net cash position (ignoring any potential share buy backs) within the next few years yielding a target share price of $251 over the next 24 months.
NHM Capital estimates
Risk Considerations
Temu and Shein are making inroads into Amazon retail markets pursuing an aggressive expansion policy. Temu was the fifth-largest advertiser in the United States in the fourth quarter of 2023. While Temu is currently estimated to lose $7 with every order and changes in US tariffs could hinder its prospects it is still a threat to Amazon’s dominance in its biggest market.
Similarly, competition in the cloud business is also most likely to intensify. AWS is the leading cloud provider with a worldwide market share of 31% in Q4 2023, however it recently saw its market share dip compared to last year. Microsoft and Google (24% and 11% market share, respectively) saw both increases in their market shares. While AI is expected to lead to a general increase in demand for cloud computing Microsoft recently looked better suited to benefit from this trend which could lead to lower growth rates and margins at AWS than anticipated.
With greater financial flexibility, the risk of misallocation of capital increases accordingly. Amazon is looking to launch a satellite based internet service (Kuiper) challenging Elon Musk’s Starlink internet business. After receiving the FCC authorization Amazon announced it will invest more than $10 billion into the business over the next several years. Then, the jury is still out on Amazon’s push into the transportation business (Zoox, Rivian). Additionally, Amazon announced in 2023 that it will press forward with grocery delivery and open more Amazon Fresh locations after pausing the expansion and closing some Amazon Fresh and Go stores last year.
Hence, Amazon is facing considerable competition in its core markets and the success of its new ventures are unclear. The cash flow projections and the stock’s implied valuation are based on a significant improvement in the company’s underlying profitability that may not materialize as envisaged.
Final Thoughts
In conclusion, Amazon’s profitability should be at an inflection point as it harvests the investments following the pandemic and benefits simultaneously from a revenue mix that is shifting towards higher margin businesses over time. The company’s free cash flow has the potential to exceed $100 billion by 2026 providing further upside potential for the stock price. BUY
Analyst’s Disclosure: I/we have a beneficial long position in the shares of AMZN either through stock ownership, options, or other derivatives. I wrote this article myself, and it expresses my own opinions. I am not receiving compensation for it (other than from Seeking Alpha). I have no business relationship with any company whose stock is mentioned in this article.
Seeking Alpha’s Disclosure: Past performance is no guarantee of future results. No recommendation or advice is being given as to whether any investment is suitable for a particular investor. Any views or opinions expressed above may not reflect those of Seeking Alpha as a whole. Seeking Alpha is not a licensed securities dealer, broker or US investment adviser or investment bank. Our analysts are third party authors that include both professional investors and individual investors who may not be licensed or certified by any institute or regulatory body.
