Summary:
- Amazon Prime Day set records – the two-day event generated +$14B in online sales.
- Consumer Discretionary stocks surged in the past month on cooling inflation and are well-positioned to benefit from a Fed pivot on interest rates.
- Investors can gain exposure to this sector through a wide variety of stocks that stand to gain from a boost in non-essential spending.
- Amazon stock has increased ~40% over the last year, yet significantly lags Magnificent Seven peers and top consumer discretionary, Abercrombie & Fitch, over the last 5Y years.
Robert Way
Prime Day 2024
Amazon’s (NASDAQ:AMZN) Prime Day set records with the two-day event delivering over $14B in sales, offering exclusive deals to Amazon Prime members, with savings on popular and best-selling items including electronics, apparel, home goods, and more. One of the Magnificent Seven stocks, Amazon’s market capitalization is nearly $2T, and together with its Mag 7 peers comprises nearly one-third of the S&P 500, over 40% of the Nasdaq 100, and more than 20% of the MSCI World. Over the last year, Amazon stock is up ~40% and has consecutively surpassed earnings expectations for the last five quarters. However, Amazon has significantly lagged behind its Magnificent Seven peers in performance over the last five years, in addition to a top Quant-rated mid-cap consumer discretionary stock, Abercrombie & Fitch (ANF).
5-Year Magnificent 7 Performance vs. Abercrombie & Fitch Stock
Mag 7 vs. ANF 5Y Performance (SA Premium)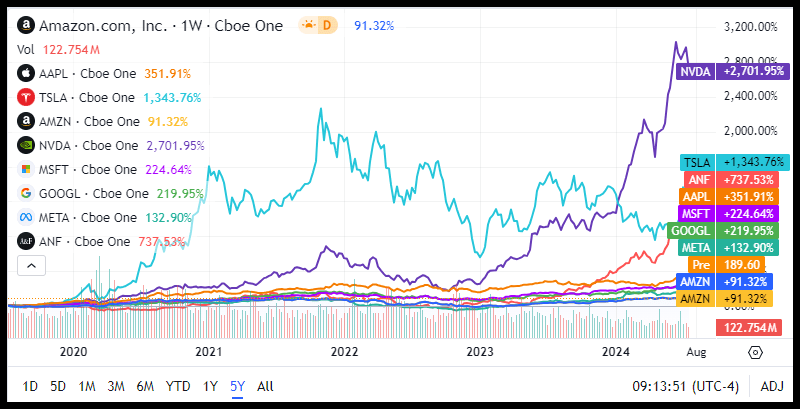
Cooling inflation is potentially paving the way for near-term interest rate cuts and could possibly be a positive trend for consumer discretionary stocks. Historically, consumer discretionary stocks outperform in low interest rate environments and increase in non-essential spending, as evidenced by record retail sales in this week’s Amazon Prime Day event. US core inflation eased to its slowest pace since 2021, boosting the odds of Fed cuts beginning in September. Increasing odds of imminent Fed cuts have also sparked a rotation out of the tech-heavy Magnificent Seven.
US Core Inflation Trend (Bloomberg)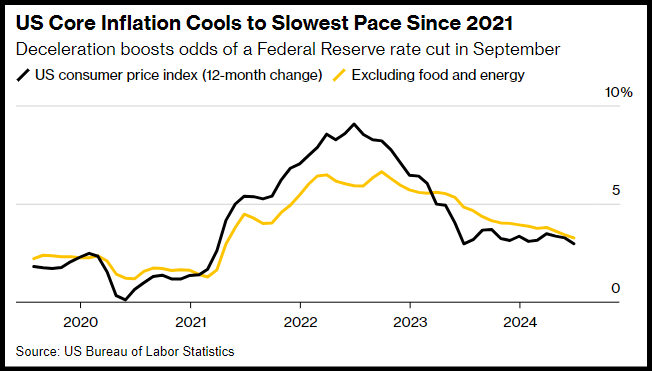
The consumer discretionary sector consists of goods and services typically deemed wants instead of needs and, hence, is more sensitive to the ups and downs of economic cycles. The sector has historically outperformed during recovery periods; when inflation cools, interest rates come down, consumer expectations improve, businesses stop cutbacks, and discretionary spending increases. Bank of America said headline inflation missing economic estimates by a huge margin confirmed its thesis that the economy is on the goldilocks path, with “macro and inflation back in sync.”
“The stars are aligning for the rotation into rate-sensitive cyclicals: rate pressure is easing, growth would ultimately be supported by the Fed, and most importantly, earnings are broadening out as the Other 493 comes out of an earnings recession,” BoA strategist Ohsung Kwon said.
The consumer discretionary sector (XLY) has outperformed the market in the past 30 days and leads in the percentage of companies reporting earnings above estimates in Q124. Investors looking to gain exposure to the consumer discretionary sector have a broad range of options that span retail, e-commerce, household appliances, services, and more.
SA Quant Ratings, Factor Grades, and underlying metrics are sector-relative, so a comparison of two major stocks in the same sector, even cutting across different industries, is a productive analysis, shining a light on what differentiates Strong Buys from the rest of the field. With this objective in mind, the Quant Team conducted a comparative quantitative analysis between one of the largest stocks, Amazon, and one of the highest Quant-rated stocks in the consumer discretionary sector.
Amazon & Abercrombie: Standing To Gain From Inflation Cool
AMZN and ANF have crushed the market and the consumer discretionary sector in the past year. Amazon is up ~40% in the last 12 months and ~+20% YTD. ANF has posted a mind-boggling 1Y price performance over 300% and ANF ~+70% YTD.
AMZN, ANF 1Y Performance vs. S&P 500 and Consumer Discretionary Sector
AMZN vs. ANF 1Y Performance (SA Premium)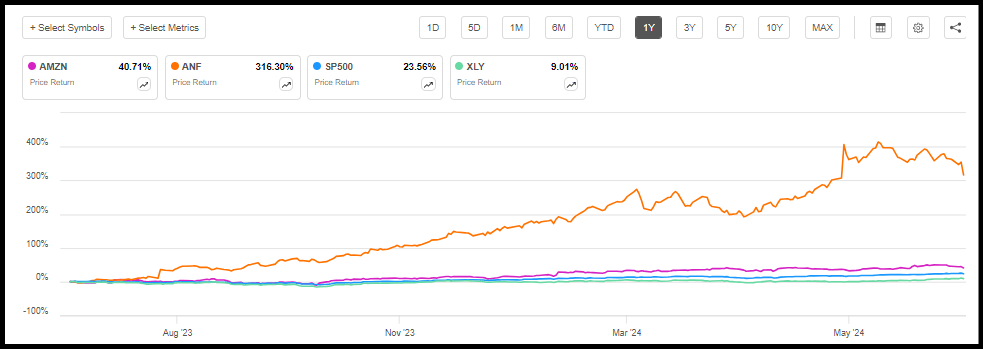
Amazon is the fifth-largest stock in the market, one of the world’s largest retailers, and the largest stock in the consumer discretionary sector. Amazon has a market cap of nearly $2T, $590.7B in revenue TTM, and 1.525M employees. ANF has a market cap of $7.96B, $4.47B in annual revenue and 19,200 personnel.
AMZN vs. ANF Stock Profile (SA Premium)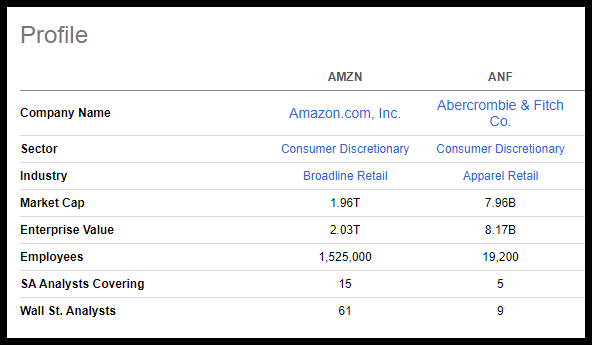
Amazon and ANF have strong investment fundamentals, showcasing track records of solid profitable growth and explosive earnings growth potential. Amazon is #89 among Quant-rated stocks in the consumer discretionary sector and #6 in the Broadline Retail industry. ANF is #2 in the sector and #1 among Quant-rated Apparel Retail stocks. Both stocks have A’s in Growth, Profitability, Momentum, and EPS Revisions and D’s in Valuation. Amazon’s D- valuation grade is the key differentiator separating the two stocks’ Quant ratings.
AMZN vs. ANF Valuation Grades (SA Premium)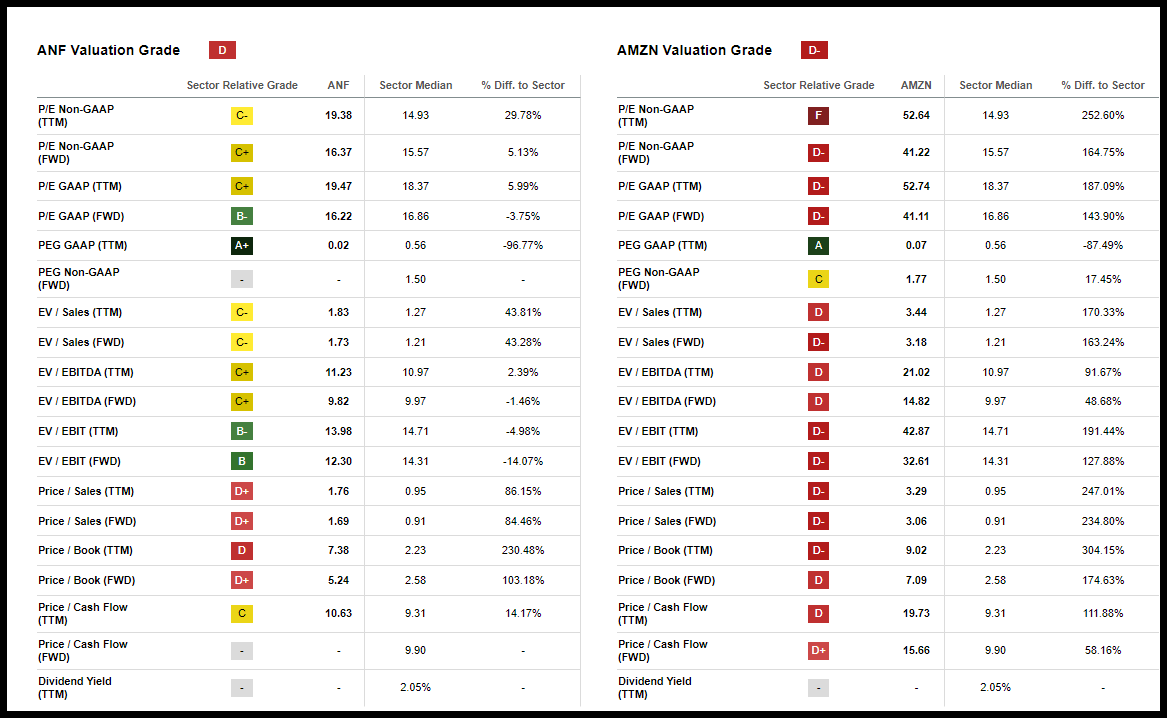
While both stocks’ overall valuation grades indicate they are overvalued compared to sector peers, ANF has a slight edge in growth, momentum, and EPS revisions. Additionally, Abercrombie’s growth, as demonstrated by 20% year-over-year Revenue Growth, 155% EBITDA Growth (YoY), and 35% Net Income 3-Y (CAGR) is more attractive than Amazon’s figures.
AMZN vs. ANF Growth (SA Premium)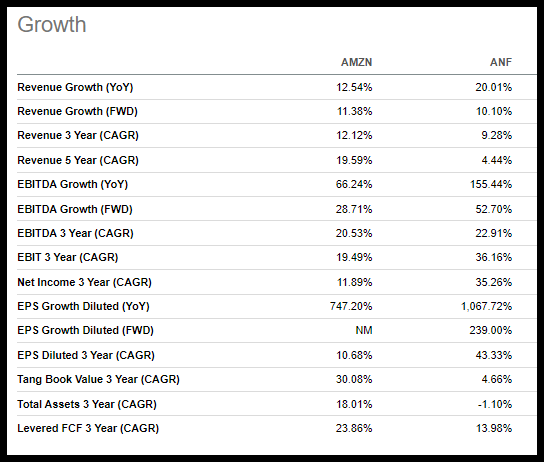
These metrics contribute to why Amazon is a Quant-rated Hold versus Abercrombie, a Quant Strong Buy-rated stock, and an Alpha Picks stock. But let’s first dive into the popular retail behemoth, Amazon.
Amazon Stock
The AI frenzy helped send Amazon’s valuation over the $2T mark last month, driven by positive investor sentiment on AI integration into the Amazon Web Services (AWS) cloud computing business. Amazon, a massive retailer and B2B tech giant, boosted its top line after setting records during Amazon Prime Day sales (July 16-17).
Amazon.com possesses a 3.49 Quant Hold rating despite sporting A’s in Growth, Profitability, Momentum, and Revisions. A very poor score in any one factor grade can trigger the SA Quant System to reassess a stock’s Quant Rating as a safeguard to prevent stocks from being marked as a Buy when there could be potential negative changes in their fundamentals, like valuation. The disqualifying grades are: a D+ or worse for Growth, Momentum, and EPS Revisions; and a D- or worse for Value and Profitability. Amazon’s Valuation grade has been a D- or worse for most of the past 12 months, aside from a few days in August and September last year when the Valuation factor grade rose to a ‘D.’
Amazon Quant Rating (SA Premium)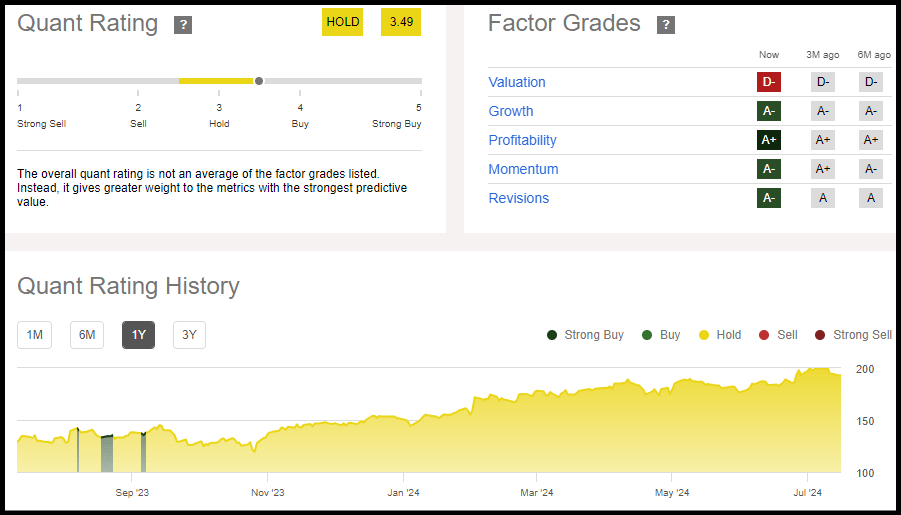
Amazon has millions of Prime subscribers worldwide and is the global market share leader among top cloud infrastructure service providers. Most of Amazon’s revenue is derived from retail sales, but web infrastructure is the company’s fastest-growing segment. Approximately 16% of Amazon’s net sales in the trailing twelve months is derived from the AWS business unit.
Amazon Sales Breakdown (Investor Presentation)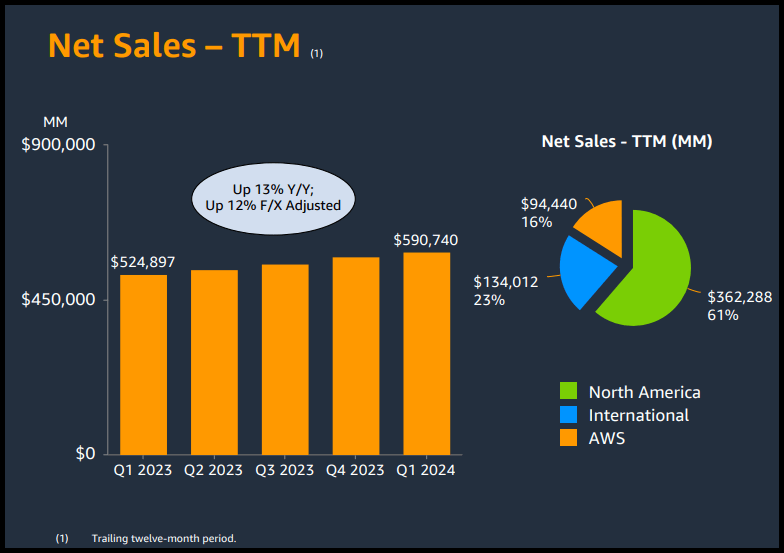
AMZN Q124 revenue of $143.31B (12.53% YoY) beat by $763.92M and EPS of $0.98 beat by $0.15, for a fifth straight positive quarterly earnings surprise. In the first quarter, 42% of Amazon’s revenue came from online and physical stores, 24% from third-party seller services, 17% from AWS, and 15% from ads and subscriptions. AWS, Amazon’s fastest-growing segment, saw revenue rise +17% YoY driven by firms renewing infrastructure modernization efforts and appeal of AWS AI capabilities, CEO Andy Jassy said. According to consensus estimates, Amazon has 45 up to 3 down revisions in the last 90 days, with FY24 EPS projected to grow 57% to $4.56 and revenue +11% to $638.95B.
However, Amazon’s Q2 sales guidance disappointed, by as much as $6B. Barclays lowered its price target for Amazon and Meta (META) and Alphabet (GOOGL), citing inflated P/E’s and analysts mis-modeling AI-related expenses by 5-10%. Amazon stock fell over 2% during the record-setting annual 2-day Prime Day sales event, just as a major rotation out of the Magnificent 7 is potentially underway.
Amazon has consistently exhibited solid fundamental investment characteristics and factor grades, including solid profitability, cash flows, revenue, growth, and earnings growth potential. However, this upside has come with a relatively high stock price.
AMZN Stock Profitability & Growth
Amazon’s A+ Profitability Grade is driven heavily by cash per share of $7.00 vs. the sector’s $2.49, raw cash from operations of $99.15B, and strong sector-relative capex/sales grade. Amazon also showcases an EBITDA margin of 16%, a levered FCF margin of 9%, and an ROE of 20%.
AMZN Profitability Grade (SA Premium)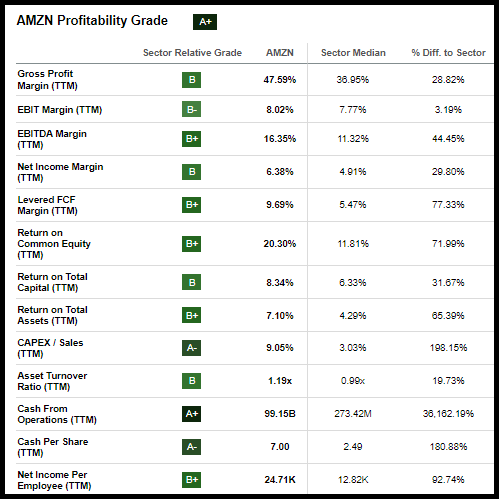
Underpinning Amazon’s A- Growth grade is EPS growth of +747% in the trailing twelve months, EBIT of +232%, and levered FCF of almost +500%. EBIT growth FWD is at +84% and EBITDA FWD is at +28%. EPS long-term growth rate FWD (3-5Y CAGR) is 23% vs. the sector’s 10%. However, Amazon’s high profit margins and incredible growth, do not come at a cheap price relative to the sector.
AMZN Stock Valuation
Amazon’s explosive profitable growth and potential are steeply-priced based on nearly every available valuation metric. P/E Growth (PEG) FWD is one of the most heavily weighted valuation metrics, but it is still just one of many that, collectively, drag on Amazon’s overall factor grade. The system still does not put too many eggs in one basket. Amazon’s Factor Grade is based on how the underlying metrics, taken collectively, stand against the sector. Amazon is trading at a whopping 42x earnings, a 173% premium to the sector. EV/EBIT FWD is 43x to the sector’s 14x and price/cash flow FWD of 16x vs. 9x for the sector.
AMZN Valuation Grade (SA Premium)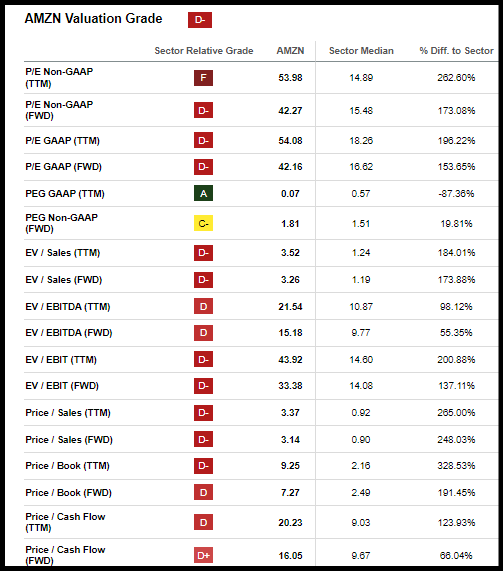
Amazon has a solid PEG TTM ratio of 0.07 vs. the sector’s 0.57, but this single metric falls short of boosting the valuation grade beyond the D-barrier.
Abercrombie & Fitch Stock
ANF is among the Quant Team’s Top Stocks for 2024 and Top Stocks for H2 2024 and has a Strong Buy Quant Rating of 4.97. ANF is the highest Quant-rated stock in the sector with over $500M in market cap, and meaningful earnings growth data available. ANF has maintained a Strong Buy for more than a year, even as its Valuation Factor Grade fluctuated from ‘D’ to C+. ANF’s Growth and Profitability Factor grades are up slightly from six months ago, and Momentum and Revisions have remained strong at A+ and A.
ANF Quant Rating (SA Premium)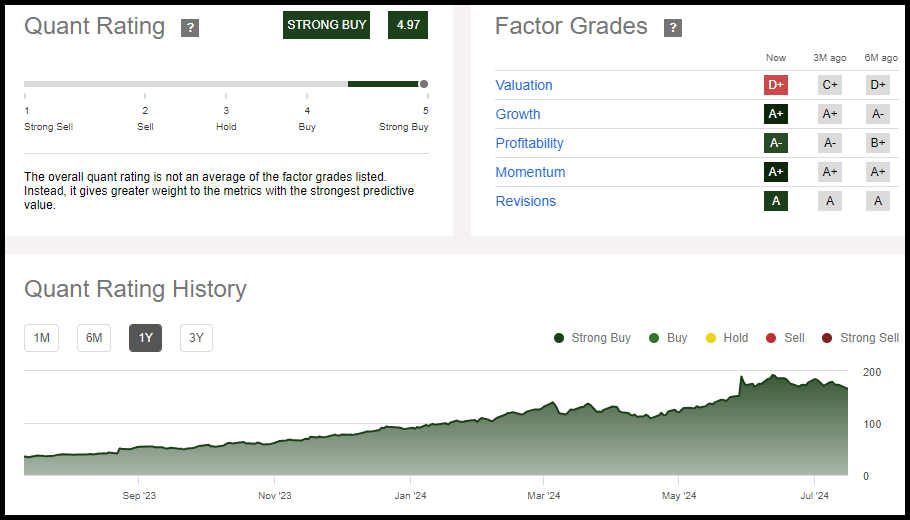
ANF, the iconic 1990s fashion brand, reinvented itself by rebranding and embracing e-commerce and has experienced an incredible rally and profitable growth in the last three years with operating income TTM rising at a 3Y CAGR of 36%. The brand turnaround and adaptation to changing fashion trends have helped boost growth and stock momentum. ANF operates approximately 750 stores under the Abercrombie and Hollister brands across North America, Europe, Asia, and the Middle East, with 45% of total sales made online last year. Due to its explosive rise in market cap, ANF will join the S&P MidCap 400 prior to trading on July 22, moving up from the SmallCap 600 Index. In June, clothing outpaced broad retail numbers for the second straight month, an improvement that could continue into the back-to-school season.
ANF Annual Growth Rates (SA Premium)
ANF Stock Profitability & Growth
ANF has an A- Profitability Grade, a tad lower than Amazon’s, but posts a number of stronger sector-relative metrics vs. the e-commerce titan. ANF cash per share is a mind-boggling $16.91 or 578% above the sector median and the levered FCF margin is 12%. EBITDA margin is at 16%, EBIT 13%, and ROE 47%. ANF’s A+ Growth Grade is driven by EPS growth of +1,067% YoY, EBIT +288%, and levered FCF growth of +814%. EBIT growth FWD is at +86% and EBITDA FWD +52%. EPS growth FWD is at +238%. EPS long-term 3-5Y growth rate is null because only two years of ANF projected consensus earnings estimates are available.
ANF Growth Grade (SA Premium)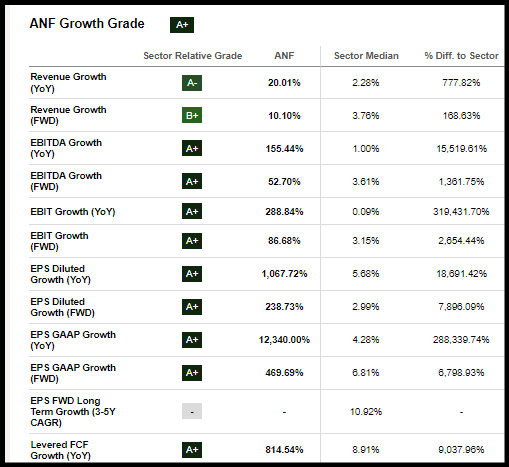
ANF shares soared more than 22% after beating Q124 targets, setting a quarterly record with $1.0B in revenue and raising full-year sales and operating margin guidance. ANF posted double-digit growth in stores and digital channels, saw gross margin increase 540 basis points YoY to a staggering 66.4% and operating margin +860 basis points to 12.7%. Abercrombie brand net sales (56% of total revenue) rose +31% YoY to $572M, the highest Q1 in brand history, with consistent growth across geographies, genders, and digital and physical channels, while Hollister was up 12% YoY, delivering growth across women’s and men’s lines and regions. ANF has eight up revisions in the past 90 days and fiscal year EPS is projected to grow +50% to $9.49 and revenue +10% to $4.72B, according to consensus estimates.
ANF Q124 Results (Investor Presentation)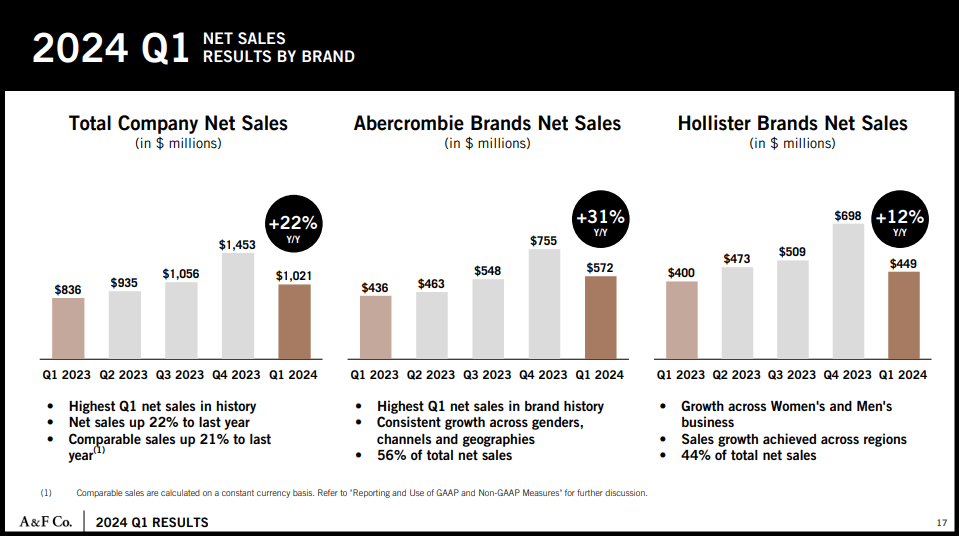
We successfully navigated seasonal transitions with relevant assortments and compelling marketing, leveraging agile chase capabilities and inventory discipline, driving sales above our expectations,” ANF CEO Fran Horowitz said. “Our brands are delivering high-quality, on-trend assortments for new and retained customers across regions and brands. Importantly, we continue to make strategic investments across stores, digital and technology to further strengthen the company in pursuit of our long-term ambition.”
ANF has continued to showcase solid improving performance but at a much more attractive price compared to Amazon relative to the stock’s investment fundamentals and earnings growth potential.
ANF Stock Valuation
ANF’s D+ grade is due to a high P/E TTM, price/sales, and price/book ratios. PEG TTM indicates ANF is trading at a 96% discount to the sector, and based on P/E FWD the stock is at a premium of only 13%.
ANF Valuation Grade (SA Premium)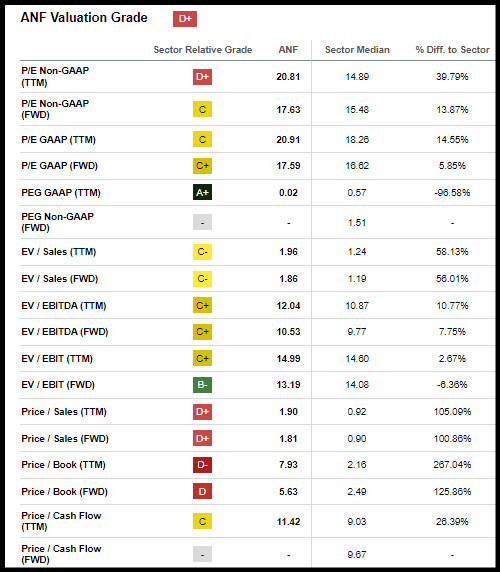
Both stocks have solid investment fundamentals, but ANF has a quantitative edge in momentum, growth, and valuation factor grades. Amazon’s edge in the profitability grade relies heavily on cash from and cash invested in operations, whereas ANF appears to outperform in most profit margin metrics.
Amazon Stock vs. Abercrombie & Fitch: Key Underlying Differentiators
Looking at the key differentiators in more detail, momentum, growth, and valuation gives ANF an edge. The Momentum factor has very high predictive power, and ANF has outperformed Amazon in the last year, three-, six-, and nine months, yet Amazon has outperformed in the last 30 days. Reiterating some of the metrics from earlier, ANF tops Amazon in many historical and forward growth metrics, highlighted by EPS growth YoY of +1,067% vs. +747%, EBITDA growth FWD of +53% vs. +28%. Amazon beats ANF in long-term historical revenue growth and just slightly in revenue growth FWD.
AMZN vs. ANF Growth Metrics (SA Premium)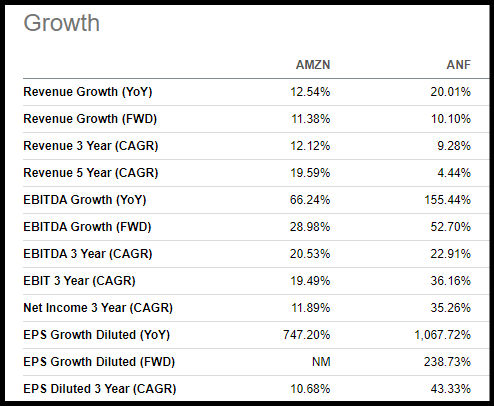
The difference between ANF’s D+ Valuation Grade and Amazon’s D- appears to be a much wider gulf when digging into the underlying details. Every valuation metric available indicates ANF is trading at a significant discount versus Amazon. Based on P/E non-GAAP FY1, Amazon (47x) is trading at a 58% premium to ANF (17x) and a 73% premium according to PEG TTM (0.07 vs. 0.02). Amazon’s EV/EBITDA FWD of 15x is at a 31% premium to ANF and price/cash flow is a 44% premium.
AMZN vs. ANF Valuation Metrics (SA Premium)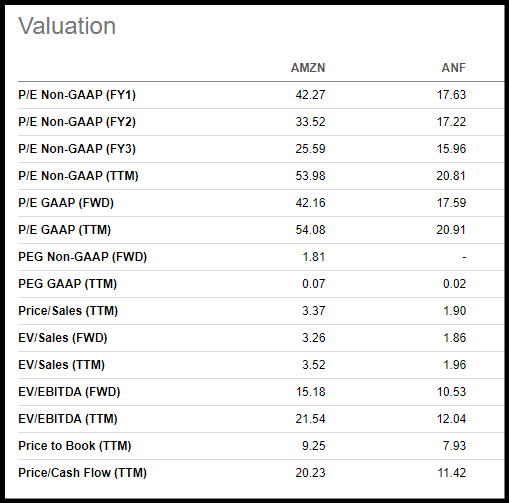
Amazon’s edge in Profitability has been driven by absolute cash flow from operations and the capex/sales ratio. ANF, however, is beating Amazon in nearly every other profit margin metric, most notably gross profit margin, ROE, and ROTC.
AMZN vs. ANF Profitability Metrics (SA Premium)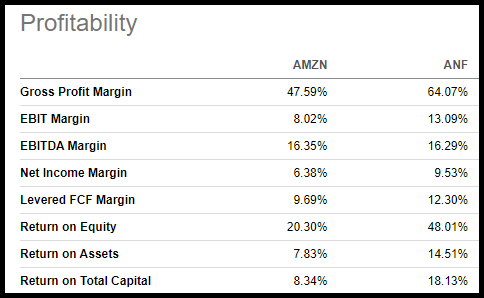
SA’s Quant Team reiterates its Strong Buy Quant Rating recommendation for ANF, driven by massive profitable growth and high Wall Street earnings expectations. Based on a P/E forward of 17x, ANF trades at a mere 13% premium to the sector and a 96% discount based on a PEG TTM of 0.02. While each stock showcases strong fundamentals, there are risks to consider.
Risks to ANF Strong Buy Rating
Apparel retail is a highly cyclical industry vulnerable to factors outside of company control, including changes in economic indicators like inflation, interest rates, consumer sentiment, and non-essential spending, which can have a major negative impact on Abercrombie earnings, stock performance, and as a result, its quant metrics. ANF is rated Strong Buy but faces risks associated with stock price volatility and industry-specific and macroeconomic trends. 60M beta of 1.55 indicates ANF’s stock has been more volatile than the market. ANF’s stock dropped double digits since the announcement of joining the MidCap 400, adding to the volatility. According to IBD, more money tracks the SmallCap 600 than the MidCap 400 through ETFs and mutual funds. Hence, stocks promoted from the former to the latter regularly see price declines.
Concluding Summary
Consumer discretionary stocks could benefit from cooling inflation and interest rate cuts and are the highest-performing sector in the past 30 days. Investors looking to gain exposure to the benefits of an increase in non-essential spending have a wide range of stock types to choose from. We conducted a comparative quantitative analysis between Amazon, the largest stock by market cap in the consumer discretionary, versus Abercrombie, one of the sector’s highest Quant-rated stocks. Amazon and ANF both showcase strong investment fundamentals and earnings growth potential. But Amazon, the e-commerce giant, comes with a stretched valuation that has relegated the stock to a Hold Rating. ANF, meanwhile, is trading at a more attractive price based on a range of valuation multiples for a Strong Buy Quant Rating and the stock has significantly outperformed Amazon over the last year and five years.
We have many stocks with strong buy recommendations, and you can filter them using stock screens to suit your specific investment objectives. Consider using Seeking Alpha’s ‘Ratings Screener’ tool to help find stocks that achieve diversification into desired sectors you like. Or, if you’re seeking a limited number of monthly ideas, consider exploring Alpha Picks.
Analyst’s Disclosure: I/we have no stock, option or similar derivative position in any of the companies mentioned, and no plans to initiate any such positions within the next 72 hours. I wrote this article myself, and it expresses my own opinions. I am not receiving compensation for it. I have no business relationship with any company whose stock is mentioned in this article.
Seeking Alpha’s Disclosure: Past performance is no guarantee of future results. No recommendation or advice is being given that any particular security, portfolio, transaction or investment strategy is suitable for any specific person. The author is not advising you personally concerning the nature, potential, value or suitability of any particular security or other matter. You alone are solely responsible for determining whether any investment, security or strategy, or any product or service, is appropriate or suitable for you based on your investment objectives and personal and financial situation. Steven Cress is the Head of Quantitative Strategy at Seeking Alpha. Any views or opinions expressed herein may not reflect those of Seeking Alpha as a whole. Seeking Alpha is not a licensed securities dealer, broker or US investment adviser or investment bank.
I am Steven Cress, VP of Quantitative Strategy at Seeking Alpha. I manage the Quant Ratings and Factor Grades on stocks and ETFs in Seeking Alpha Premium. I also lead Alpha Picks, which selects the two most attractive stocks to buy each month, and also determines when to sell them.
