Summary:
- Technically, Amazon shows potential upside with support at $175 and a bullish Volume Price Trend, indicating growing buying interest.
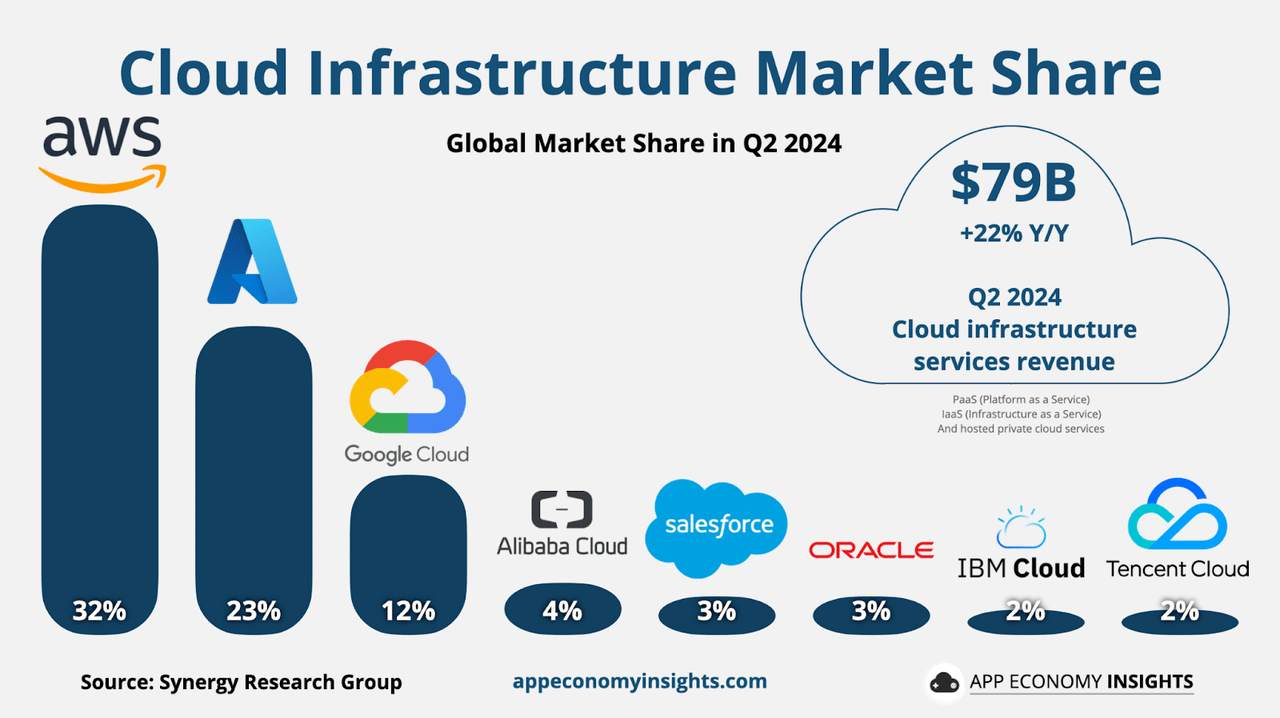
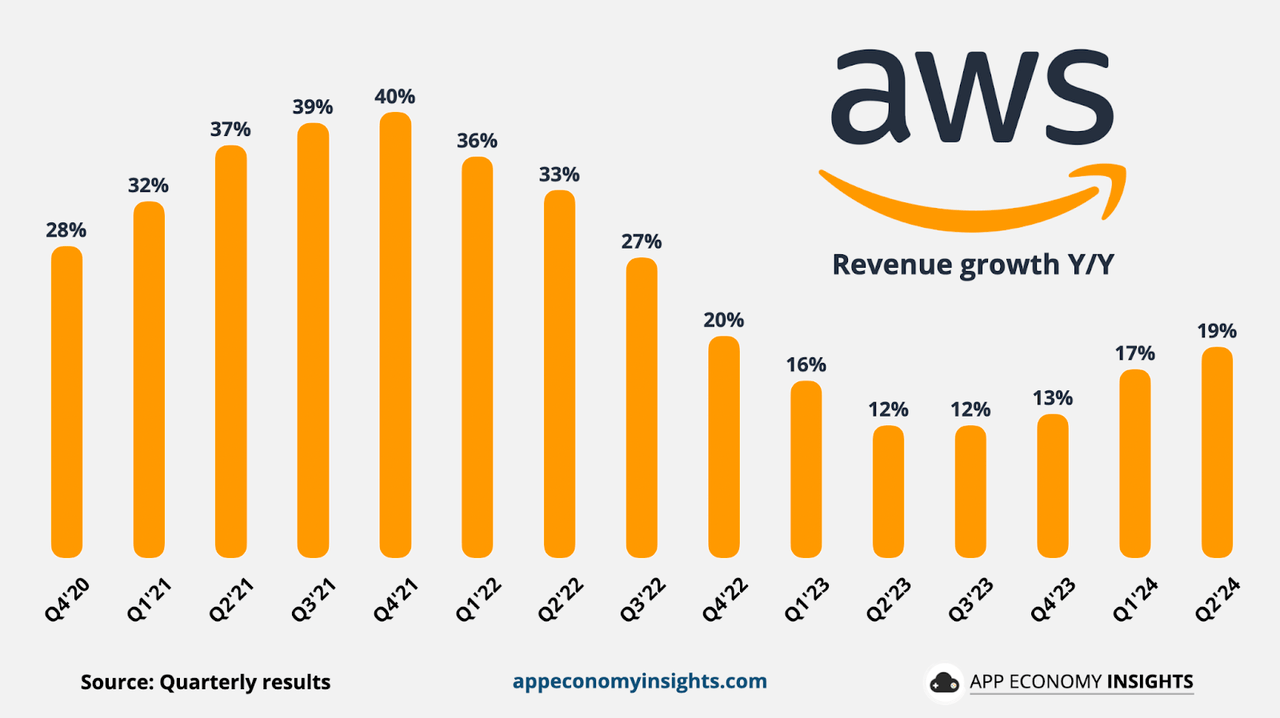
- AWS holds 32% of the global cloud market, driving Amazon’s growth with an 18.8% revenue increase in Q2 2024.
- A $6.2 billion investment in Malaysia expands AWS’s infrastructure, boosting its presence in the APAC region.
- AWS’s AI tools, like SageMaker and custom chips, enhance performance, fueling demand for AI-driven applications.
- AWS’s low-latency infrastructure supports key industries, providing Amazon with a competitive edge in cloud solutions.
FinkAvenue
Investment Thesis
Amazon (NASDAQ:AMZN) presents a balanced opportunity for growth driven by its robust fundamentals and technical indicators. AMZN’s diversified revenue streams, mainly through AWS and its growing advertising business, underpin its long-term growth prospects.
Technically, a neutral Relative Strength Index (RSI) and a bullish Volume Price Trend (VPT) signal the potential for upward movement, though near-term consolidation is possible. Historical seasonality also supports a favorable investment climate, especially in stronger months like March and November.
Overall, AMZN’s financial health, cloud dominance, and expanding ad revenue make it a decent candidate for both short and long-term investors.
Technical Indicators Point to Potential Upside Amidst Neutral RSI and Bullish VPT Trends
AMZN reveals potential for growth. The stock is currently priced at $175, and the price targets for 2024 vary from $173 (pessimistic) to $220 (optimistic). These targets align with key Fibonacci levels. The average target of $195 matches the 1.236 Fibonacci extension, suggesting moderate upside potential. The optimistic target at 2.118 implies a more bullish scenario. Conversely, the pessimistic target at 0.382 indicates a possible retracement.
The RSI is at 50. There are no divergences, either bullish or bearish. This neutral RSI indicates the stock is neither overbought nor oversold. It suggests potential for upward movement if the trend continues. A bottom touchdown at near 30 may signal a possible entry point. This could occur during consolidation or near previous support levels.
VPT analysis supports a bullish outlook, as the VPT line is trending upwards. It has surpassed its moving average of 952 million; the current VPT value is 969 million. This upward trend and a bottom touchdown on the moving average signal increased buying interest and reinforced a trend toward higher prices.
Yiazou (trendspider.com)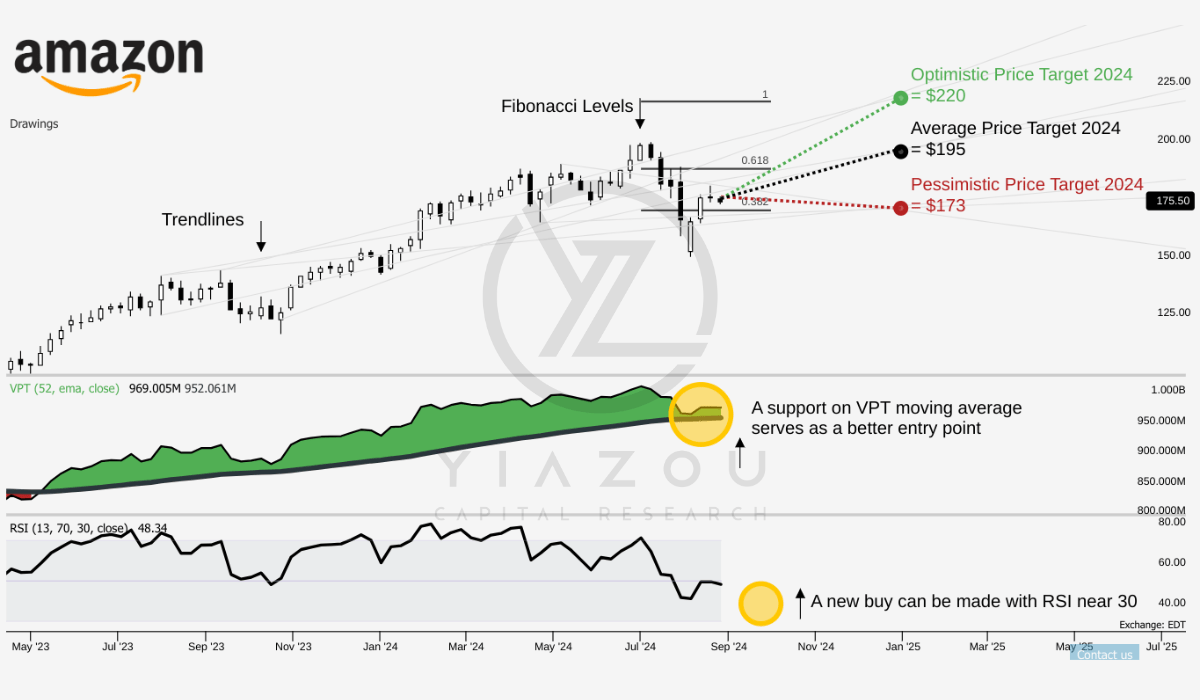
The seasonality analysis for AMZN based on 27 years of historical data shows mixed performance throughout the year. September reflects a 56% chance of positive returns, suggesting a moderately favorable investment climate for the month. Notably, stronger months include March (78%) and November (74%), showing significantly higher chances of positive returns. In contrast, February (48%) and December (41%) show weaker performance, making them less reliable for positive returns. Overall, AMZN’s seasonal trends indicate varying probabilities of success, with certain months providing more robust historical performance.
Yiazou (trendspider.com)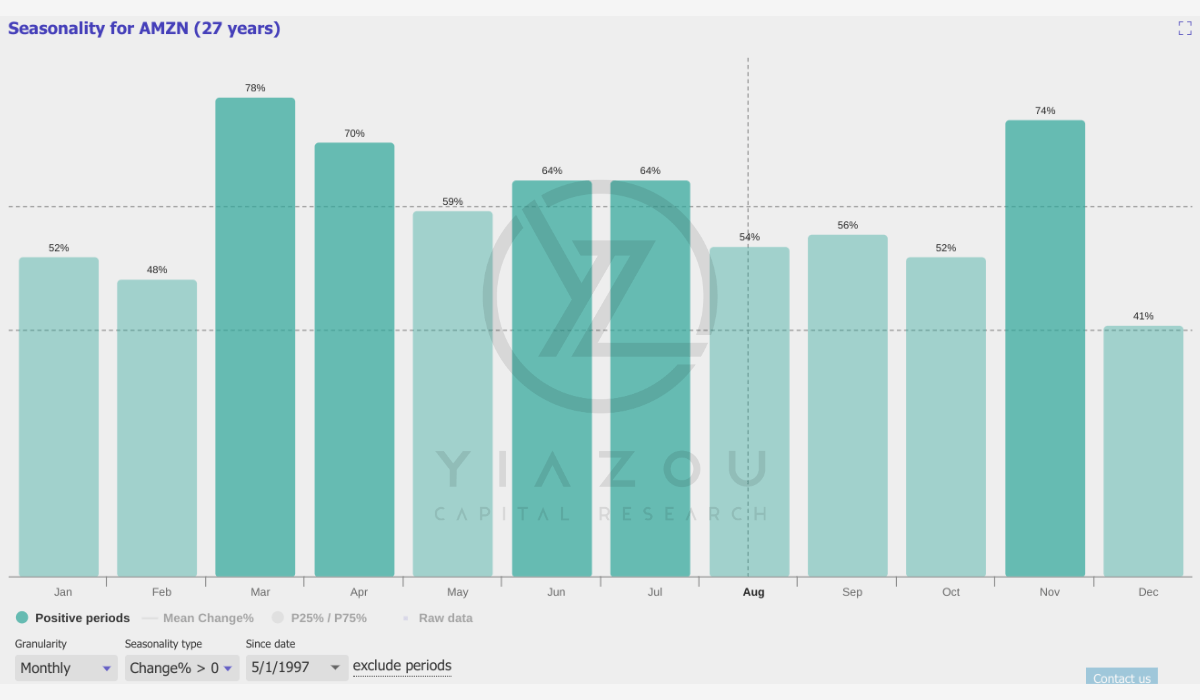
AWS Bets Big on Malaysia: $6.2 Billion Investment to Boost Cloud Infrastructure
AWS is investing $6.2 billion in Malaysia through 2038 to support AWS’s strategy of rapid expansion in the APAC region, one of the leading markets for cloud computing. This is one of the leading markets for cloud computing, and the investment reflects AWS’s revenue potential from the APAC market through an uplift in regional infrastructure and market reach.
The AWS Asia Pacific (Malaysia) Region will have three availability zones strategically placed to ensure business growth continuity and low latency for clients. Technically, each zone is equipped with independent power, cooling, and security and is connected through ultra-low-latency networks. AWS now has 108 Availability Zones, 41 Local Zones, and 29 Wavelength Zones for ultra-low-latency applications against Microsoft Azure’s 140 Availability Zones.
Moreover, AWS has an edge over Azure regarding market share (32% vs 23%) and strategic cloud platform services leadership (see Gartner Magic Quadrant). This moat boosts the market lead of AWS’s infrastructure and allows clients to build applications that can handle zone failures without affecting performance. Fundamentally, high availability is a competitive advantage for AWS as the regional Availability Zones provide low latency for high-performance applications. These are essential for industries like financial services, telecommunications, and e-commerce.
Financially, Amazon’s trailing 12-month free cash flow (adjusted for equipment finance leases) reached $51.4 billion. This is a 664% annual increase, adding $44.7 billion compared to Q2, 2023. This growth points to Amazon’s strong financial standing and operational cash generation, allowing it to invest in infrastructure expansion.
AWS Surge and Ad Revenue Soars, A $50 Billion Milestone
AWS continues to drive Amazon’s growth, accelerating revenue from 17.2% in Q1 2024 to 18.8% in Q2 2024. This acceleration underlines Amazon’s success regarding migrations from on-premises infrastructure to cloud solutions.
The transition from on-premises to cloud infrastructure offers AWS a massive growth opportunity. With this, AWS may capture a large share of global IT spending. The rising demand for AWS services, particularly AI and machine learning tools, strengthens Amazon’s cloud market lead. The AI business achieved a multi-billion dollar revenue run rate early on with custom silicon like Trainium and Inferentia, which enhances AI training and inference. These chips hold competitive pricing and performance for generative AI models, and the high demand for these chips showcases Amazon’s ability to support AI developers.
At the same time, other services like SageMaker and Bedrock can easily help manage AI models. Their broad adoption indicates AWS’s AI business units are doing great, and their success rate increases the company’s growth. Amazon’s ad business is on fire; in Q2 2024, ad revenue added more than $2 billion to reach $12.7 billion. Overall, the company generates more than $50 billion in ad revenue annually, with sponsored ads driving most of that growth. This success shows Amazon’s ability to monetize its platform, and the rise in video advertising offers new opportunities as brands can link ads directly to outcomes like sales or subscriptions. Amazon’s content, reach signals, and ad tech positions Amazon to capture a larger ad market share.
Moreover, advertising revenue growth diversifies Amazon’s income sources. According to Amazon’s general strategy, it provides a highly profitable virtual revenue stream within e-commerce and cloud businesses. The North American segment grew 9%, while the international segment grew 10% year over year.
Despite headwinds of lower selling prices and evolving consumer behavior, the e-commerce top-line continues its expansion. Amazon’s vast selection, competitive prices, and fast delivery drive this growth. The logistics network is the reason for its success, as investments in automation and robotics enhance delivery speeds. For instance, over 5 billion units were delivered the same day or the next day. Fundamentally, fast delivery encourages customers to rely more on Amazon, and this trend supports long-term top-line growth in e-commerce.
Q2 2024 earnings release
Amazon’s 91% Operating Income Surge: A Triumph or a Ticking Time Bomb?
Amazon’s operating income surged by 91% annually, reaching $14.7 billion in Q2 2024. This significant increase is partly due to cost-cutting measures and efficiencies. However, sustaining these gains may be challenging as the company’s top-line expands. The 91% growth raises concerns about the sustainability of such high rates as Amazon’s aggressive cost-cutting, including automation and regionalizing its inbound network, drove this increase.
These measures may have limited scalability, leading to potential diminishing returns in upcoming quarters. The reduction in average selling prices (ASPs) directly impacts operating margins. As consumers choose lower-priced items, profit margins on these sales may decrease. Amazon’s reliance on high-volume, low-margin operations makes margin changes more impactful. The disparity between the 91% income growth and 11% revenue growth suggests that cost efficiencies, not top-line growth, drive profits. This points to the challenge of maintaining margin improvements amid sluggish revenue growth.
Over the long-term, Amazon’s operating margins have been thin due to heavy investments in infrastructure and tech. Recent margin improvements are positive but may not be sustained as AWS remains a major growth driver. Yet, the cloud and AI sectors are increasingly competitive, and AWS faces significant competition from Microsoft, Google, and other emerging players. Rapid AI advancements and multi-cloud strategies among enterprises could erode AWS’s market share.
On a long-term basis, AWS’s 18.8% growth rate indicates a slowdown from previous years’ 30%+ rates, although they are improving in the short term. This deceleration suggests the cloud market is maturing, with increased competition and pricing pressures. As enterprises adopt multi-cloud strategies, AWS might struggle to maintain its lead, leading to slower growth and increased pricing pressure. The contribution of Amazon’s AI investments to overall revenue remains relatively tiny, and substantial investments (like those in Malaysia) may impact margins.
Takeaway
With AWS and advertising as key drivers, Amazon continues to expand its revenue streams. Its strong market presence and diversified business model position it for continued success. Seasonality trends also suggest favorable months ahead, particularly in March and November. Overall, Amazon’s consistent performance and growth potential make it attractive for investors seeking long-term gains.
Analyst’s Disclosure: I/we have no stock, option or similar derivative position in any of the companies mentioned, and no plans to initiate any such positions within the next 72 hours. I wrote this article myself, and it expresses my own opinions. I am not receiving compensation for it (other than from Seeking Alpha). I have no business relationship with any company whose stock is mentioned in this article.
Seeking Alpha’s Disclosure: Past performance is no guarantee of future results. No recommendation or advice is being given as to whether any investment is suitable for a particular investor. Any views or opinions expressed above may not reflect those of Seeking Alpha as a whole. Seeking Alpha is not a licensed securities dealer, broker or US investment adviser or investment bank. Our analysts are third party authors that include both professional investors and individual investors who may not be licensed or certified by any institute or regulatory body.
