Summary:
- The news may tell you that the US economy is in trouble, but looking at actual numbers from Amazon and others may change your worldview.
- Amazon’s revenue growth has accelerated, gross margins and EBITDA margins are at recent highs, and cash flow margins are trending up.
- Amazon’s stock looks inexpensive on revenue and EBITDA multiples, but pricey on a cashflow multiple. Technical analysis suggests a near-term price target of $154-165/share.
FinkAvenue
DISCLAIMER: This note is intended for US recipients only and, in particular, is not directed at, nor intended to be relied upon by any UK recipients. Any information or analysis in this note is not an offer to sell or the solicitation of an offer to buy any securities. Nothing in this note is intended to be investment advice and nor should it be relied upon to make investment decisions. Cestrian Capital Research, Inc., its employees, agents or affiliates, including the author of this note, or related persons, may have a position in any stocks, security, or financial instrument referenced in this note. Any opinions, analyses, or probabilities expressed in this note are those of the author as of the note’s date of publication and are subject to change without notice. Companies referenced in this note or their employees or affiliates may be customers of Cestrian Capital Research, Inc. Cestrian Capital Research, Inc. values both its independence and transparency and does not believe that this presents a material potential conflict of interest or impacts the content of its research or publications.
In The End, Numbers Do Matter
As everyone knows, we are headed for a hard landing because rates and inflation and money printing and such. Also Boomers. And Gen Z. For all these reasons, the US economy is in Big Trouble and one should gather one’s things in the form of cash or, better, gold bars, and head for the hills.
Such is the market narrative at present – at least, the market narrative as promulgated to anyone prone to take any notice of such narratives. If you live on Twitter or in front of any financial news channel on TV, good luck staying in a balanced state of mind, since the majority of material is of the extreme bull or extreme bear variety. That being the stuff that attracts viewers and clickers alike, and that being the stuff that sells the ads at the good rates.
Alternatively, you could turn off the TV, cancel yourself from Twitter, and look at some numbers.
Let’s pretend for a moment that you’ve been on vacation these last few days and you know nothing about Big Tech earnings. You come back home, switch on your computer, somehow manage to avoid the fear memes the thing starts beaming at you right away, and look at some actual numbers. You might find that Microsoft blew the doors off, as did Meta Platforms; that Intel put in a very strong quarter and a further step on its way to corporate redemption; and that Amazon printed a rock solid set of numbers that made you feel good about the stock and, indeed the economy.
Let’s look at the print.
Amazon Stock – Fundamental Analysis
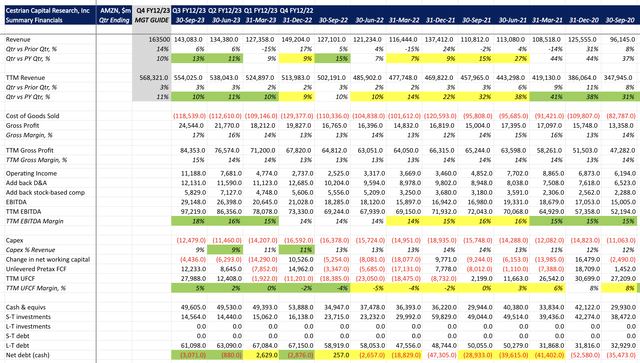
AMZN Fundamentals (Company SEC Filings, YCharts.com, Cestrian Analysis)
A few highlights:
- Revenue growth accelerated for the second quarter in succession. +13% this quarter vs. Q3 2022 (which was a tough lap, since Q3 ’22 grew at +15%, an anomaly at the time), bringing TTM revenue growth now to +10%.
- Gross margins at a recent high of 17% for the quarter, 15% on a TTM basis.
- TTM EBITDA margins now up to +18%, again a recent high.
- Cashflow margins continue to trend up; TTM unlevered pretax cashflow margins came in at 5% today, up from 2% last quarter, 0% the quarter before that, -2% the quarter before that, and so on and so forth.
- Balance sheet back to a net cash position; $3bn net cash in the bank (don’t worry, they won’t run out – they have $50bn gross cash on hand!).
How about valuation?
Amazon Stock – Valuation Analysis
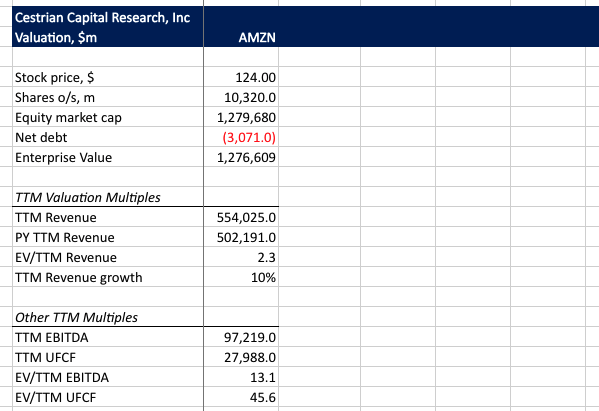
During the earnings call, the stock didn’t know whether it was coming or going. Flat then up then down then back up again. Having settled around $124/share for now, the stock looks inexpensive on the revenue and EBITDA multiples (2.3x TTM revenue, 13.1x TTM EBITDA) but pricey as a cashflow multiple at 45.6x. To get comfortable with that just remember that AMZN has never generated much in the way of cashflow, instead plowing it all back into the company for new capex in pursuit of long run growth opportunities.
AMZN Valuation Analysis (Company SEC Filings, YCharts.com, Cestrian Analysis)
And the stock chart?
Amazon Stock – Technical Analysis And Price Target
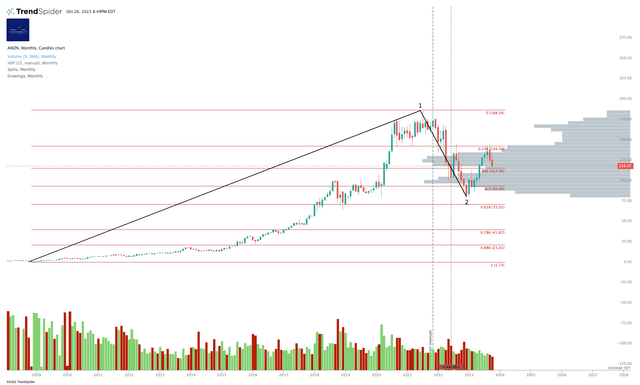
In the larger degree we can see that the drop experienced by AMZN stock last year was deep indeed. In around 15 months, from June 2021 to November 2022, the stock dropped more than 60% of all the value it had created since the 2008 financial crisis lows.
AMZN Stock Chart I (TrendSpider, Cestrian Analysis)
And since the November 2022 lows?
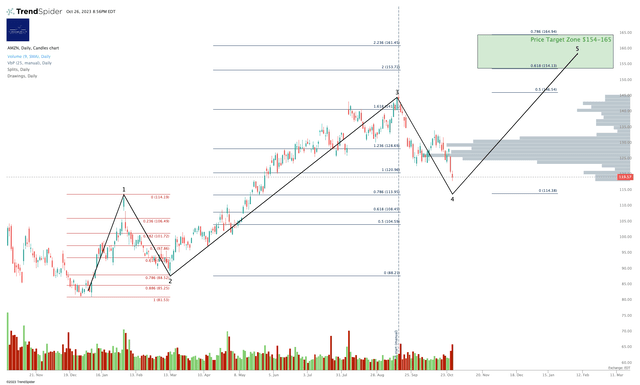
AMZN Stock Chart II (TrendSpider, Cestrian Analysis)
A very much picture-perfect story from the November 2022 lows. The 1-2 setup closes in mid-March with a dollar-perfect Wave 2 retrace of the move up from the 2022 lows. Wave 3 terminates right around the 1.618 Fibonacci extension of Wave 1, placed at the Wave 2 low; and we may yet see Wave 4 retest those Wave 1 highs around $114. On the assumption that we do, the final Wave 5 target is somewhere in the $154-165/share range.
We rate AMZN at Hold.
Cestrian Capital Research, Inc – 26 October 2023.
Analyst’s Disclosure: I/we have a beneficial long position in the shares of AMZN either through stock ownership, options, or other derivatives.
Business relationship disclosure: See disclaimer text at the top of this article.
Cestrian Capital Research, Inc staff personal accounts hold long positions in, inter alia, AMZN
Seeking Alpha’s Disclosure: Past performance is no guarantee of future results. No recommendation or advice is being given as to whether any investment is suitable for a particular investor. Any views or opinions expressed above may not reflect those of Seeking Alpha as a whole. Seeking Alpha is not a licensed securities dealer, broker or US investment adviser or investment bank. Our analysts are third party authors that include both professional investors and individual investors who may not be licensed or certified by any institute or regulatory body.
GET INSTITUTIONAL GRADE BUYSIDE RESEARCH FROM CESTRIAN CAPITAL RESEARCH
We provide investment research prepared to institutional investor quality, presented in a way anyone can understand. Our work allows you to make sense of company fundamentals and stock technicals without resort to jargon or esoterica. We offer Free, Basic and Full membership tiers in our “Growth Investor Pro”. Join us! Click HERE to learn more.

