Summary:
- Consumer financial health is problematic, with record-high credit card balances and rising delinquency rates potentially threatening future spending.
- Amazon recently corrected after reaching a new all-time high in July 2024. Technical indicators point to further declines, weakening relative strength and stalling momentum.
- Given these risks, AMZN is a cautious hold. Long-term investors should protect their gains, while short-term traders should wait for more evident signs of recovery before taking action.
- In this technical article, I discuss important price levels and metrics that investors could consider for gaining an edge on the stock’s likely price action.
Adam Gault
As the US economy faces mounting challenges, including record-high credit card balances and rising delinquency rates, the technology sector has been a standout performer, leading the market over the past year. Amid this backdrop, Amazon.com, Inc. (NASDAQ:AMZN) stock has experienced a recent correction, showing some cracks in the solid performance since the beginning of 2023. The stock’s outlook is increasingly uncertain, with technical indicators signaling potential further declines.
A Macro Perspective
The US technology sector has led by far the rally in the past year, with 42% performance, followed by the communication services sector with 31% and the financial sector with 30%. Although a closer look at the sector’s industries shows information technology service providers in the lower end of the group, overall, these companies have performed well in the past 12 months, while a slowdown could be observed in the past month compared to other sector peers. Zooming into the consumer cyclical sector shows that most of the performance came from residential construction companies, while internet retail companies have performed dramatically in the past 12 months, standing among the most prominent winners; this trend has more recently seen an inversion, with a negative performance over the past month.
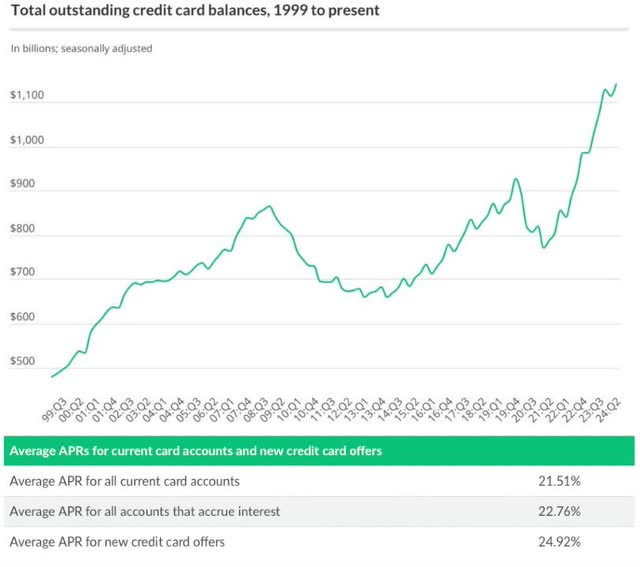
A closer look into the US consumer financial health hints at some dark cloud on the horizon. While total outstanding credit card balances have reached new record highs, the amount has increased by 240% over the past 25 years, surging by $372B since Q1 2021. The US consumer now owes $215B more in credit card debt than the previous record set in the fourth quarter of 2019 when balances reached $927B. The worrying part is that debt should be rapid during an economic expansion. Credit card balances will likely continue rising when the consumer could increase his saving rate due to record-high interest rates, persistent inflation, and various other economic factors. The Annual Percentage Rate [APR] explains the financial burden of new and current credit card accounts, with interest rates ranging from 21.50% to 25%.
lendingtree.com, with data from New York Fed Consumer Credit Panel/Equifax, Federal Reserve.
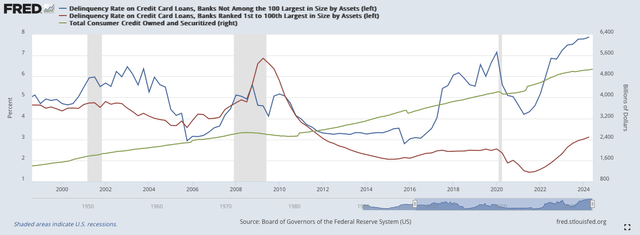
The former data raises questions about the consumer’s capacity to repay the incurred debt. The delinquency rate on credit card loans held by smaller banks has increased to record highs, even surpassing the levels observed during the past three recessions, especially the spike observed just before the last pandemic hit the world’s economy. While bigger banks suffer from a lower delinquency rate, the rate has remarkably increased among these institutions, more than doubling since Q1 2021. Overall, the total consumer credit in the US is at record highs, breaking above the $5T mark in the past 12 months. The observations raise doubts on how the consumer would continue spending at the actual rate if the US economy suffered from a downturn, and to what extent the financial system would absorb the fallout of a part of the massive consumer debt if the consumers’ financial health worsened.
The Consumer Discretionary Select Sector SPDR ETF (XLY) is hovering around the midpoint of an uptrend channel, supported by its short-term Exponential Moving Averages [EMAs]. The industry reference broke out from its downtrend during May 2023, has since confirmed this breakout in October 2023, and is heading towards the 78.60% retracement measured from the All-Time-High [ATH] recorded in November 2021. While steadily increasing, the On Balance Volume [OBV] lacks significant conviction, also confirmed by the relatively flat momentum observed in the Moving Average Convergence Divergence [MACD]. The industry benchmark reports relative weakness compared to the broader technology market, the Nasdaq Composite (IXIC), or, more narrowly, the Nasdaq-100 tracked by the Invesco QQQ ETF (QQQ).
Where are we now?
With the FED expected to start its rate-cutting cycle, many investors nurture high expectations in the equity market as the US economy is still in robust shape, at least partially. On the other hand, the tendentially increasing unemployment rate, the likelihood of a comeback in higher inflation readings, and the overall geopolitical tensions and tit-for-tat trade conflicts between major trade partners aren’t picturing a bright future. The observed financial health conditions of the US consumer are adding to the worries that consumer spending would significantly drop if a recession hit the economy in the foreseeable future, as the expansion has been significantly supported by consumption on credit.
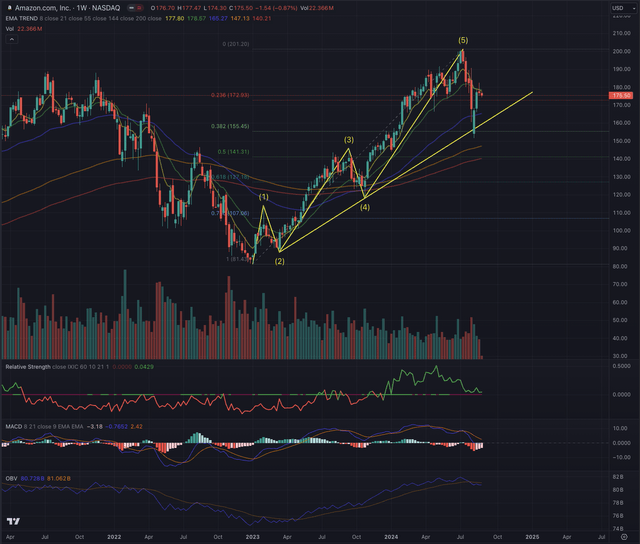
Amazon’s weekly chart shows the completion of a five-wave Elliot impulse sequence, which led the stock to a new ATH at $201.20 on July 8, 2024. From that point, the stock corrected sharply by 25%, testing the ascending trendline, which acted as strong support. Although AMZN recovered about 50% of this correction, the stock is now struggling to overcome its short-term EMA8 and EMA21 while also losing positive momentum, as shown in the reverting MACD.
While the stock has outperformed the border technology market in the past eight months, the falling relative strength is hinting at likely more weakness ahead, an assumption that is also supported by the stalling OBV, which recently crossed its 21-day moving average. This situation has yet to happen consistently since the beginning of the downtrend in November 2021. A retest of the ascending trendline is likely to gauge the stock’s direction in the foreseeable future.
While these observations are based on AMZN’s weekly chart, focusing on lower timeframes and validating the assumptions with the daily chart is crucial. This shorter time frame provides a clearer view of the recent price action structure, which may be less apparent on the weekly chart. By closely analyzing the daily chart, I can better understand the dynamics and assess whether the stock’s current trajectory is sustainable or if a corrective phase is likely approaching.
What is coming next?
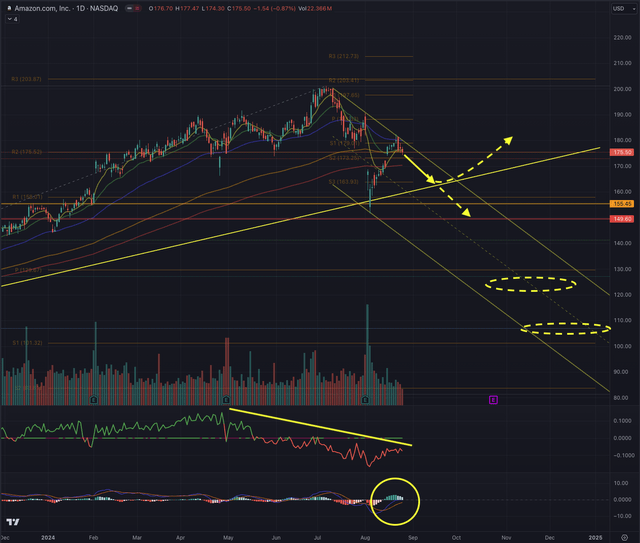
On AMZN’s daily chart, the evidence of a downtrend build-up becomes more visible. The stock just tested the ceiling of the downtrend channel for the second time from the recent highs. AMZN’s relative performance to the Nasdaq reference index has worsened, and the stock’s momentum, shown by the MACD, is stalling. While the stock is hovering close to its ATH, cautiousness is advised.
My assumption is that AMZN will correct from its actual level towards the ascending trendline around $162-$164, filling an open gap between $173.94 and $172.42 on its way down and the confluence with a liquidity pool between $167.50 and $159.50, an area that has some volume imbalance. Here, two likely scenarios are essential to consider.
In the first scenario, AMZN could fall further and reach the critical support area between $155.45 and $149.60, where the stock would need to find support, at risk of falling significantly further along the downtrending channel. Failure to hold this support would open the downside towards the annual pivot point around $129. While AMZ has left two significant gaps open between $125.52 and $121.80 and between $108.08 and $106.90, I don’t see these being filled anytime soon.
A second scenario would see AMZN confirm the uptrend support and continue its ascent towards the recent peak. Overcoming the ATH would open up the opportunity to reach $204 and a further $213.
Technically, the stock is in a short-term downtrend and is trying to break out from its EMA55, which has been an essential trailing support and resistance in the past, as observed in the daily chart. As a long-term investor, I would not add any significant position while focusing on protecting my gains. To avoid substantial losses, the support needs to be confirmed; therefore, I would set an appropriate stop-loss below the discussed support levels. AMZN could again be considered a buy if the stock confirms its uptrend by forming strong support and reverting by breaking out from the down-trending channel.
From a short-term perspective, the assumptions offer an exciting trading range. Still, I want to see the bottom confirmed and positive momentum building up before considering a swing-trade position.
All elements considered, AMZN is a hold position, with potential up- or downgrading based on the discussed contingency plan.
The bottom line
Technical analysis is not an exact science, but a technique to increase investors’ chances of success and a tool to navigate any security. Just as one wouldn’t drive to an unfamiliar destination without consulting a map or using GPS, the same approach should apply when making investment decisions. I utilize techniques based on the Elliott Wave Theory and assess probable outcomes using Fibonacci principles to confirm the likelihood of an outcome. My technical analysis aims to validate or dismiss an entry point in a stock by examining its sector, industry, and, most importantly, its price action.
The US technology sector led last year’s rally with a 42% gain, though some industries, like IT service providers, underperformed. Meanwhile, consumer financial health is problematic, with record-high credit card balances and rising delinquency rates potentially threatening future spending. AMZN recently corrected after reaching a new all-time high in July 2024. Technical indicators point to further declines, weakening relative strength and stalling momentum. Given these risks, AMZN is a cautious hold. Long-term investors should protect their gains, while short-term traders should wait for more evident signs of recovery before taking action.
Analyst’s Disclosure: I/we have no stock, option or similar derivative position in any of the companies mentioned, and no plans to initiate any such positions within the next 72 hours. I wrote this article myself, and it expresses my own opinions. I am not receiving compensation for it (other than from Seeking Alpha). I have no business relationship with any company whose stock is mentioned in this article.
All of my articles are a matter of opinion and must be treated as such. All opinions and estimates reflect my best judgment on selected aspects of a potential investment in securities of the mentioned company or underlying, as of the publication date. Any opinions or estimates are subject to change without notice, and I am under no circumstance obliged to update or correct any information presented in my analyses. I am not acting in an investment adviser capacity, and this article is not financial advice. This article contains independent commentary to be used for informational and educational purposes only. I invite every investor to do their research and due diligence before making an independent investment decision based on their particular investment objectives, financial situation, and risk tolerance. I take no responsibility for your investment decisions but wish you great success.
Seeking Alpha’s Disclosure: Past performance is no guarantee of future results. No recommendation or advice is being given as to whether any investment is suitable for a particular investor. Any views or opinions expressed above may not reflect those of Seeking Alpha as a whole. Seeking Alpha is not a licensed securities dealer, broker or US investment adviser or investment bank. Our analysts are third party authors that include both professional investors and individual investors who may not be licensed or certified by any institute or regulatory body.


![The Consumer Discretionary Select Sector SPDR ETF (<a href='https://seekingalpha.com/symbol/XLY' title='Consumer Discretionary Select Sector SPDR® Fund ETF'>XLY</a>) is hovering around the midpoint of an uptrend channel, supported by its short-term Exponential Moving Averages [EMAs]. The industry reference broke out from its downtrend during May 2023, has since confirmed this breakout in October 2023, and is heading towards the 78.60% retracement measured from the All-Time-High [ATH] recorded in November 2021. While steadily increasing, the On Balance Volume [OBV] lacks significant conviction, also confirmed by the relatively flat momentum observed in the Moving Average Convergence Divergence [MACD]. The industry benchmark reports relative weakness compared to the broader technology market, the Nasdaq Composite (IXIC), or, more narrowly, the Nasdaq-100 tracked by the Invesco QQQ ETF (<a href='https://seekingalpha.com/symbol/QQQ' title='Invesco QQQ ETF'>QQQ</a>).](https://static.seekingalpha.com/uploads/2024/8/27/53640650-17247413208537762.png)

