Summary:
- Amazon will report results on April 27 after the close of trading.
- An options trader is betting that shares will fall following the results.
- Free cash flow from operations is the key to where this stock goes next.
HJBC
The story was originally published for subscribers of Reading The Market, an SA Investing Group.
Amazon’s (NASDAQ:AMZN) stock has experienced a significant rise since mid-March, with shares increasing by more than 15%. However, an options trader is now betting that the stock has reached a short-term peak and will fall over the next month.
The company is scheduled to release its earnings report on April 27, and it is expected to be a challenging quarter. Analysts predict a 13.5% decline in earnings to $0.46 per share compared to last year, while revenue is forecasted to increase by 7.1% to $124.7 billion. Amazon’s guidance for the next quarter is equally important, with analysts expecting revenue growth of 7.3% to $130.1 billion.
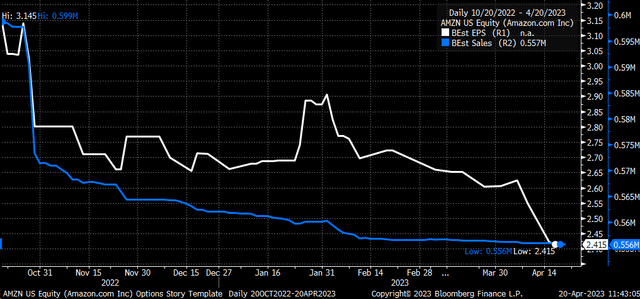
Earnings and sales estimates for the full-year 2023 have decreased over the past six months, with an expected 8.7% decline in earnings to $2.42 per share and an anticipated 8.1% increase in revenue to $555.76 billion. However, if Amazon can maintain its revenue growth, there may be room to reduce expenses, leading to better-than-expected earnings and an increase in full-year estimates. This outcome depends heavily on factors such as labor costs.
However, the overall performance of Amazon’s business may not be the only deciding factor, especially if Amazon Web Services (AWS) fails to meet expectations. As the most profitable segment of Amazon’s business, AWS generates most of the company’s operating income. Analysts project a 13.7% constant currency growth rate for AWS, reaching $21.0 billion and representing 16.9% of the total business revenue. The unit is also expected to deliver $5.2 billion in operating income, with a 24.5% operating margin. On the other hand, the operating income for the entire Amazon company is expected to be only $2.9 billion, indicating that the rest of the business is anticipated to operate at a loss.
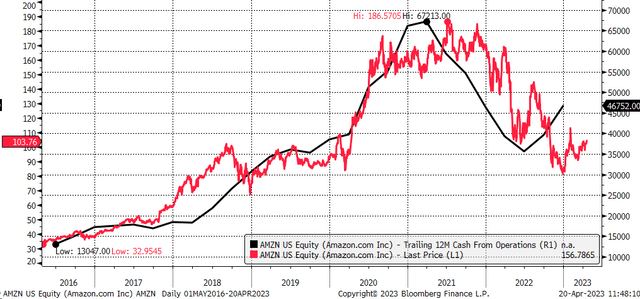
Trading at 42 times earnings, the stock could be considered expensive. However, it has never been evaluated solely based on its price-to-earnings ratio. Instead, its cash flow from operations over the past twelve months is a more relevant metric. Free cash flow from operations tends to be a leading indicator for the direction of the stock over time.
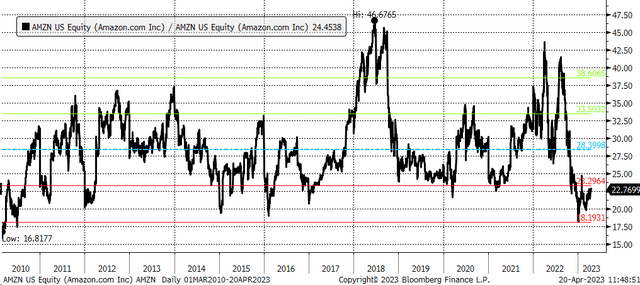
The stock trades at just 22.7 times free cash flow from operations on a twelve-month trailing basis. This is at the lower end of the historical range, implying that the stock may be undervalued over the longer term.
Despite the stock’s recent significant increase, it is possible that it could experience a pullback, mainly if Amazon reports disappointing results due to higher costs, a weakening consumer, or if AWS fails to meet expectations.
This may be driving an options trader to make a bearish wager, with the open interest for the May 19 $105 puts and calls increasing by around 20,000 each on April 20. The data shows that calls were sold for $4.30 to $4.50 per contract, while the puts were bought for approximately $5.40 to $5.55 per contract, resulting in a spread transaction cost of between $0.95 and $1.25 per contract to create the bearish trade. The trader requires the stock to trade below $103.75 by mid-May to earn a profit, and the trader paid over $2 million in premium to create the spread transaction.
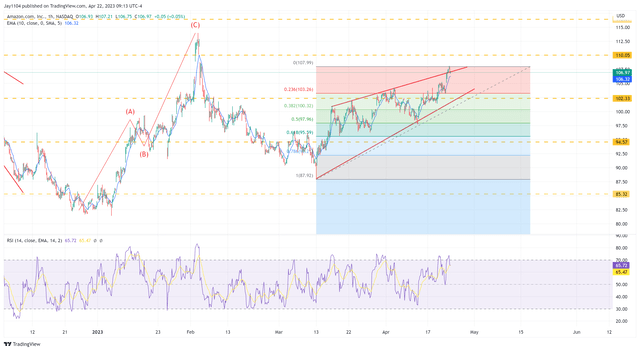
The trade may be profitable based on the technical setup, which suggests that the stock could be topping out. A rising wedge pattern is forming in the stock, which is a bearish reversal pattern, and may have completed the throw-over portion of that pattern on Friday. If the stock falls below support at around $102, it could lead to a decline in the stock to about $95, representing a 61.8% retracement of the upward move from the low of March 13. This would result in a decline of around 9%.
Assuming Amazon can maintain its progress in improving free cash flow from operations, any temporary decline in the stock price is unlikely to be sustained in the long term and may present a long-term entry point.
Analyst’s Disclosure: I/we have a beneficial long position in the shares of AMZN either through stock ownership, options, or other derivatives. I wrote this article myself, and it expresses my own opinions. I am not receiving compensation for it (other than from Seeking Alpha). I have no business relationship with any company whose stock is mentioned in this article.
Charts used with the permission of Bloomberg Finance L.P. This report contains independent commentary to be used for informational and educational purposes only. Michael Kramer is a member and investment adviser representative with Mott Capital Management. Mr. Kramer is not affiliated with this company and does not serve on the board of any related company that issued this stock. All opinions and analyses presented by Michael Kramer in this analysis or market report are solely Michael Kramer's views. Readers should not treat any opinion, viewpoint, or prediction expressed by Michael Kramer as a specific solicitation or recommendation to buy or sell a particular security or follow a particular strategy. Michael Kramer's analyses are based upon information and independent research that he considers reliable, but neither Michael Kramer nor Mott Capital Management guarantees its completeness or accuracy, and it should not be relied upon as such. Michael Kramer is not under any obligation to update or correct any information presented in his analyses. Mr. Kramer's statements, guidance, and opinions are subject to change without notice. Past performance is not indicative of future results. Neither Michael Kramer nor Mott Capital Management guarantees any specific outcome or profit. You should be aware of the real risk of loss in following any strategy or investment commentary presented in this analysis. Strategies or investments discussed may fluctuate in price or value. Investments or strategies mentioned in this analysis may not be suitable for you. This material does not consider your particular investment objectives, financial situation, or needs and is not intended as a recommendation appropriate for you. You must make an independent decision regarding investments or strategies in this analysis. Upon request, the advisor will provide a list of all recommendations made during the past twelve months. Before acting on information in this analysis, you should consider whether it is suitable for your circumstances and strongly consider seeking advice from your own financial or investment adviser to determine the suitability of any investment.
Seeking Alpha’s Disclosure: Past performance is no guarantee of future results. No recommendation or advice is being given as to whether any investment is suitable for a particular investor. Any views or opinions expressed above may not reflect those of Seeking Alpha as a whole. Seeking Alpha is not a licensed securities dealer, broker or US investment adviser or investment bank. Our analysts are third party authors that include both professional investors and individual investors who may not be licensed or certified by any institute or regulatory body.
Join Reading The Markets Risk-Free With A Two-Week Trial!
(*The Free Trial offer is not available in the App store)
Find out why Reading The Markets was one of the fastest-growing SA marketplace services in 2022. Try it for free.
The market is more complex than ever, and Reading The Markets is here to help you cut through all the noise and to help you better understand what is driving trading and where the market is likely heading, both short and long-term.
Check out my newsletter if you want to start with something less intensive.


