Summary:
- Amazon experienced a significant selloff on August 2nd, 2024, with worse-than-expected guidance, possibly indicating a general downturn in U.S. consumer/business spending trends is next.
- Technical indicators suggest a period of lower quotes and consolidation may be ahead, similar to previous instances of heavy selling.
- Amazon’s stretched valuation, a potential recession, and substandard retail profit margins point to sizable downside investment risks.
hotforphotog/iStock Editorial via Getty Images
I will say the obvious out loud, Friday’s selloff (August 2nd, 2024) on weaker management guidance for Amazon.com, Inc. (NASDAQ:AMZN) (NEOE:AMZN:CA) was something of a train wreck for bulls and shareholders. Much worse-than-expected immediate forecasts for both revenue and income generation could be telegraphing a downturn in U.S. consumer/business spending trends the rest of the year.
And, despite all the warm and fuzzy feelings by Wall Street analysts that the company remains a terrific investment performer, the share quote is now back to 2020 levels, with no dividend to support your portfolio. In all honesty, had you invested in cash-like investments at your local bank (CDs and money market accounts), you would have more money in your account today than owning Amazon over the last four years.
YCharts – Amazon, Weekly Price Changes, 4 Years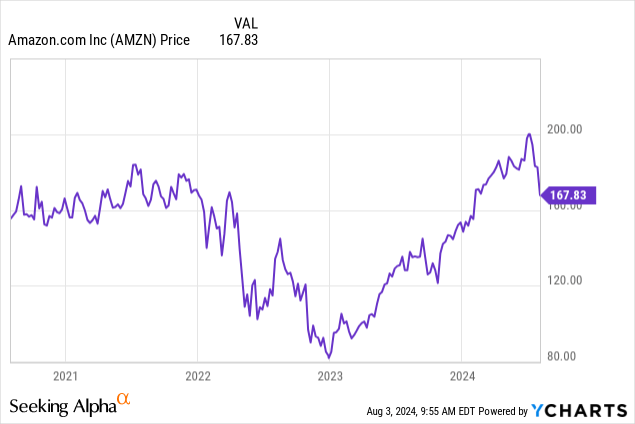
Where do we go from here is the question? I am afraid my answer is nowhere to down looks to be the path of least resistance, at least over the next 6-12 months. Technical damage on the Amazon chart is getting hard to ignore, with similar carnage witnessed in January and May 2022. If history repeats (or at least rhymes), a span of lower quotes and consolidation of 2023 and early 2024’s big rebound could be in order.
Regular readers know I am not the biggest fan of Amazon’s online retail business model, from an owner’s perspective. I have written mostly bearish articles on the stock over the last four years. The low-margin high-volume business design is a great idea and deal for consumers, shaking up the world with delivery to your home. However, the creation of other businesses like AWS cloud services and subscription inventions have outlined the majority of income for investors. Effectively, cash flow from these related and ancillary ecosystems has supported the growth in retail operations. Heightened pandemic demand for home delivery has also provided a major boost to business results since early 2020.
For reference, 2023 operating income was $12.2 billion from its retail operation in America and internationally on $484 billion in revenue (2.5% margin). In contrast, the AWS high-speed computing rental division delivered $24.6 billion in base earnings on $90.7 billion in sales (27.1% margin).
Amazon 2023 Annual Report – Segment Breakdown, Author Reference Point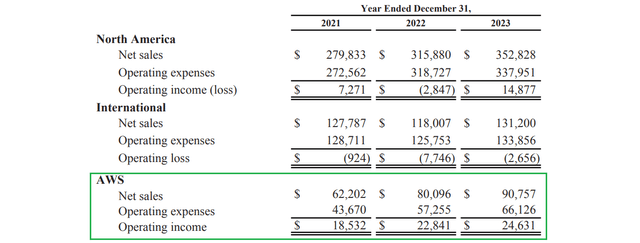
Technical Trading Damage
Below I have drawn some short-term momentum indicators highlighting the wicked amount of selling pressure in Amazon over the last month, capped by the negative company news announcement on Thursday evening. An avalanche of share selling and reworked forecasts to lower levels have put a real dent in the optimism of a month ago.
Specifically, when the 20-day Chaikin Money Flow, 14-day Ease of Movement, and 13-day Force Index crater at the same time, a sea change in investor sentiment and buying patterns is taking shape. I have circled in purple the CMF move into deeply negative territory, in gold the worst EMV reading ever, and in red the sky-high rate of selling as measured by the Force Index. No other instance of price decline since January 2023 looks remotely like today’s monster.
StockCharts.com – Amazon, Daily Price & Volume Changes, Since January 2023, Author Reference Points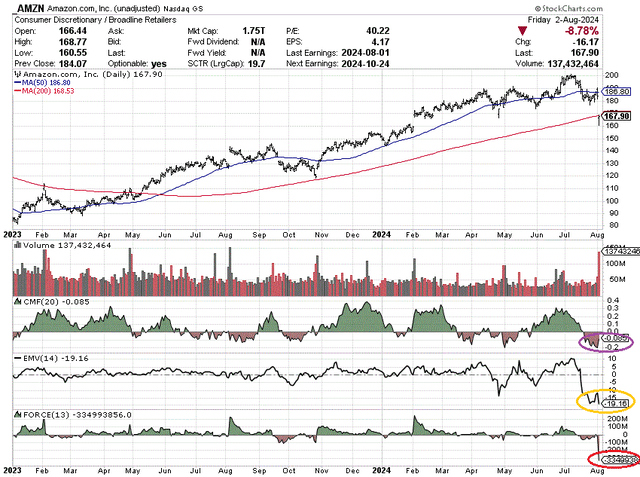
When we go back through history, we can find other examples of all three indicators cratering at the same time. The latest happened in January and May 2022, graphed below with gold boxes outlining the clear negative turn in momentum. As you can see, Amazon was hit by heavy selling several times that year, with price declining over -55% from its 2021 peak into the start of 2023.
StockCharts.com – Amazon, Daily Price & Volume Changes, Aug 2021 to Mar 2023, Author Reference Points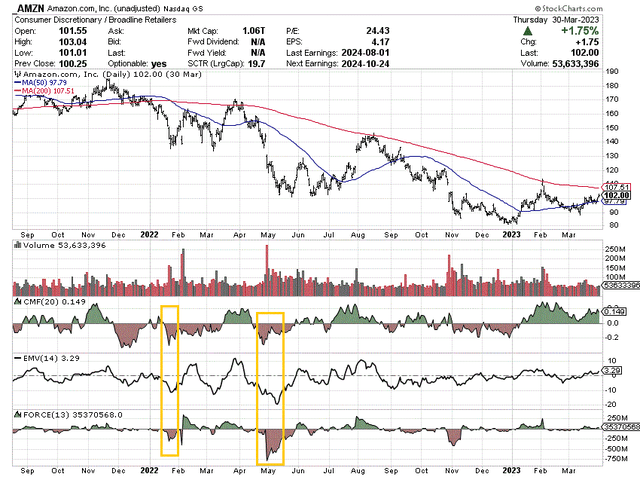
Perhaps a more apt parallel to today, if a recession is about to hit, comes from the original Dotcom peak in Amazon experienced during December 1999. Price and momentum collapsed between the final trading days of that year and the first few weeks of 2000 (boxed in gold again). Measured from the peak, Amazon would fall over -90% in price by late 2001. So, taking money off the table was absolutely the right move in January 2000, which may prove analogous to the current position of shares (marked with the green arrow).
StockCharts.com – Amazon, Daily Price & Volume Changes, Aug 1999 to Dec 2001, Author Reference Points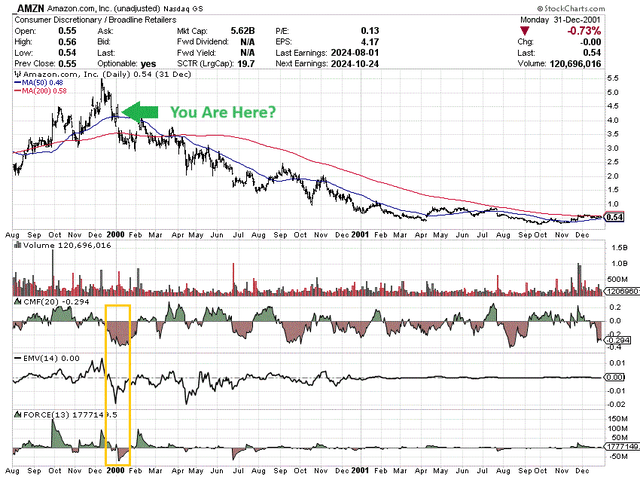
For the record, 2007’s peak in Amazon was followed by a sharp downturn in the EMV creation, with a serious Force Index selloff (boxed in gold below). While not quite as scary as today’s circumstances or the 1999-2000 situation, the Great Recession and Financial Crisis of 2008-09 did send Amazon’s share price down by -60%. The lesson of the story is Amazon has not performed well during recession, outside of the boon to business operations during the 2020-21 pandemic period.
StockCharts.com – Amazon, Daily Price & Volume Changes, June 2007 to Dec 2008, Author Reference Point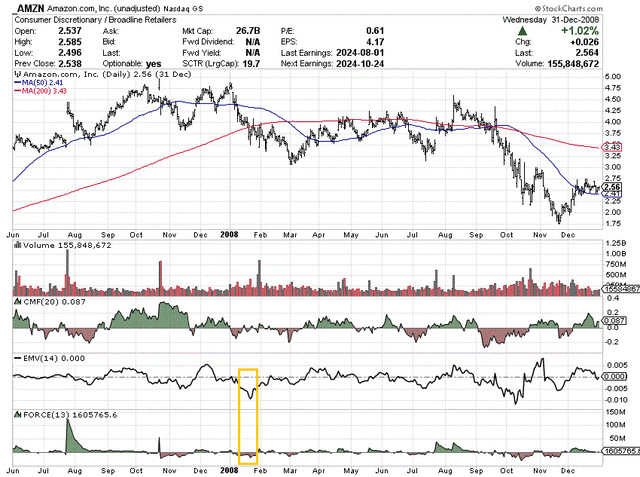
Downside Risk Is High On Stretched Valuation
If momentum signals were the only rotten news for Amazon, I might ignore the noise, if you will. However, with a still expensive valuation vs. peers, and a recession possibly halting all business growth, the reversal from buying to selling trends in the stock is very worrisome.
Below, I have drawn perhaps the primary valuation datapoint to consider in your Amazon research, with the company at a massive size today (and a mature business decades in the making). Gone are the days of 30% to 50% sales growth rates.
When we add net debt to the equity capitalization, a fair “enterprise value” for comparing apples to apples with other retailers is our end product. EV to Revenues tells you plenty over the decades, showing off both swings in the economy and investor sentiment during several cycles. Today’s 2.85x multiple is on the high side of the 24-year range back to the year 2000, while remaining far above competitors/peers. The major retailing peers of Walmart (WMT), Target (TGT), and Costco (COST) are drawn as a comp group.
YCharts – Amazon vs. Major U.S. Retail Peers, EV to Sales, Since 2000, Recessions Shaded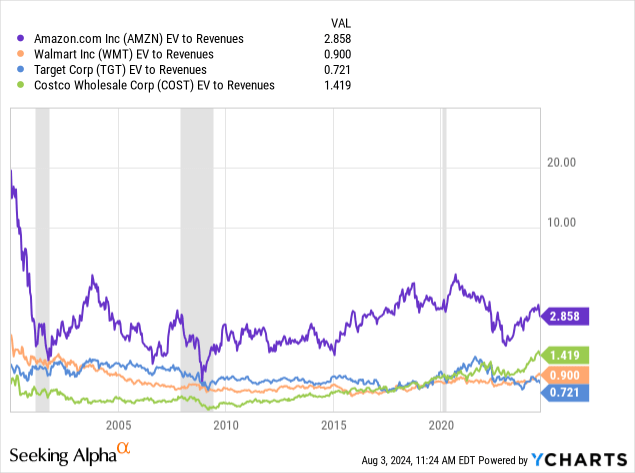
Further, you will notice Amazon did approach the same EV to Revenues valuation as major peers during the 2001-02 and 2009-09 recessions. Consequently, if a recession is beginning in late summer 2024, downside beyond -50% cannot be ruled out into 2025.
Why do I worry about the ultra-extended valuation on operating sales? It’s basically a profit margin issue. Even after including the grand AWS margins of today, 18.2% gross margins (before recession) are very ordinary, stacked up against Walmart, Target, and Costco.
YCharts – Amazon vs. Major U.S. Retail Peers, Gross Profit Margins, Since 2000, Recessions Shaded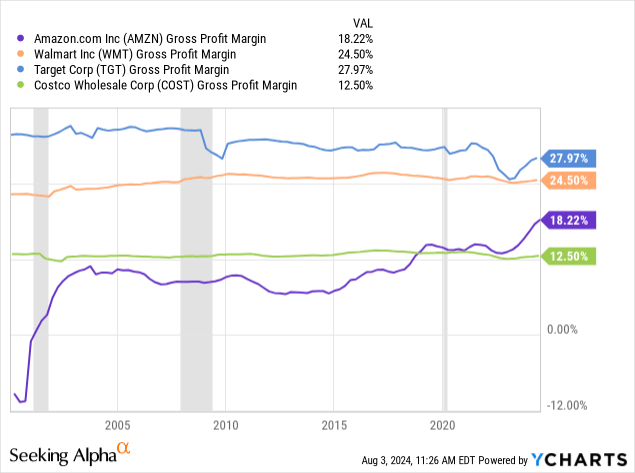
An important argument from bulls is AWS growth should pull total results at a faster clip than peer retailers. I do agree, but what premium valuation should we put on 10% annual revenue growth company-wide into 2027, when alternative investment choices in retail are growing at 4% to 5%? In my book, a small premium valuation is in order, not a large one.
YCharts – Amazon vs. Major U.S. Retail Peers, Analyst Revenue Growth Estimates into 2027, Made Aug 2, 2024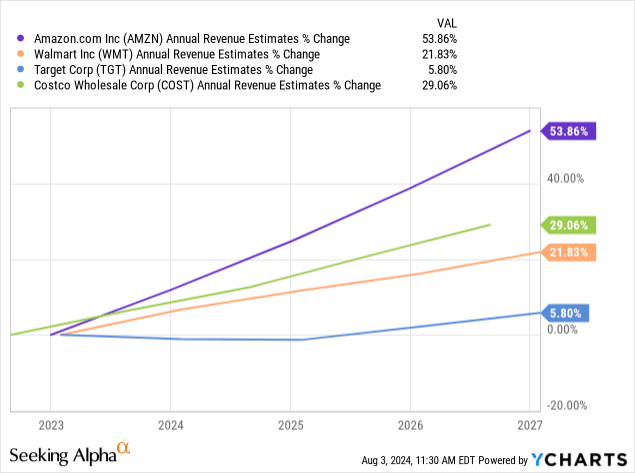
For some bad news aimed at Amazon shareholders, the earnings yield of 2.5% remains quite subpar vs. retail peers. I know earnings growth is expected to easily beat competitors, thereby deserving the valuation. But, if a recession is next, Amazon earnings generation could stall and move into reverse rather quickly.
YCharts – Amazon vs. Major U.S. Retail Peers, Trailing Earnings Yield, 10 Years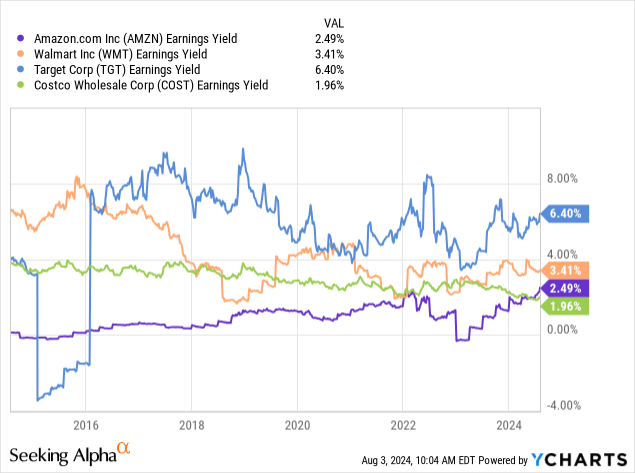
Of course, the worst investment news for Amazon owners is the earnings yield is a complete failure vs. “risk-free” cash yields closer to 5% this summer. I have been pounding the table all year on all Big Tech names failing to meet this simple mathematical investment goal. For AMZN, the 2024 earnings yield “relative” to 1-year Treasury rates has been the worst setup since 2007, just before a deep recession appeared (with the share quote slashed in half).
YCharts – Amazon vs. Major U.S. Retail Peers, Trailing Earnings Yield vs. 1-Year Treasury Rate, 20 Years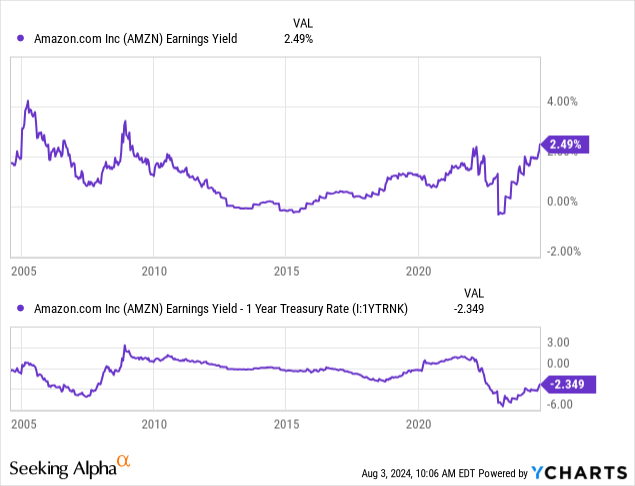
Seeking Alpha’s computer-ranking system puts a “D-” Quant Valuation Grade on Amazon. When you review a long list of factors, investors at $167 a share currently may not be getting enough in actual business fundamental worth to back up each share. My opinion is, you absolutely don’t want to overpay going into a possible recession.
Seeking Alpha Table – Amazon, Quant Valuation Grade, August 2nd, 2024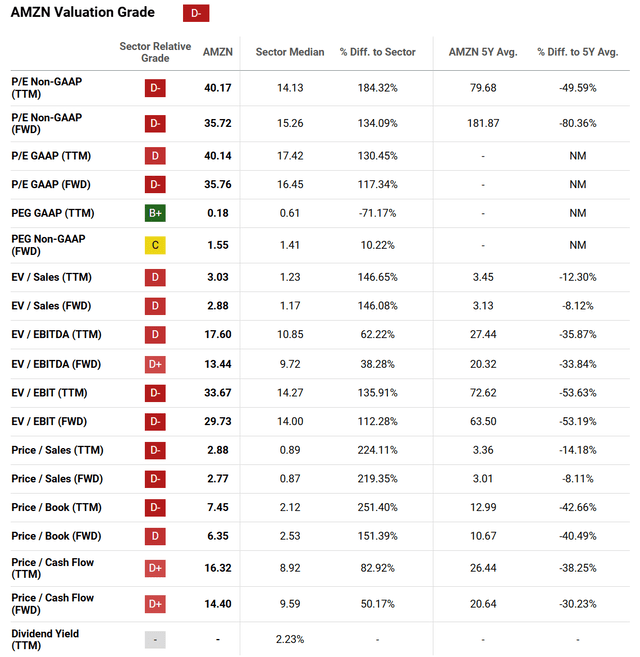
Final Thoughts
The primary reason to be bullish on Amazon is earnings growth remains at a leading rate in the major retail and Big Tech sectors of the market. Of course, a recession, even a mild one, could knock results down appreciably vs. current lofty forecasts by Wall Street analysts. If you believe a U.S. recession will be avoided, Amazon could turn in superior investment performance vs. the S&P 500 for another year or two. That’s the best-case scenario bulls are banking on.
Seeking Alpha Table – Amazon, Analyst Estimates for 2024-26, Made August 2nd, 2024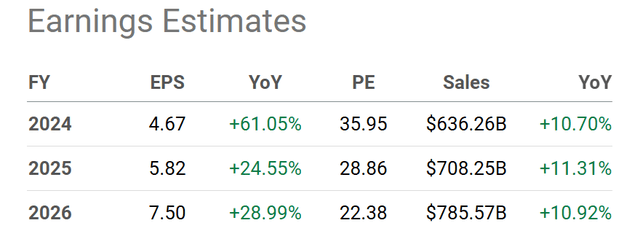
Yet, insider sales, mostly from founder Jeff Bezos, are something to ponder in your decision process. Over the last 12 months, not one important insider (board of directors or high-level business manager) has stepped up to the plate to buy Amazon stock with out-of-pocket money. In terms of lacking a vote of confidence, I am concerned those running the business are nowhere near as optimistic as Wall Street analysts on the future of the company.
Nasdaq.com – Amazon, Insider Transactions, 12 Months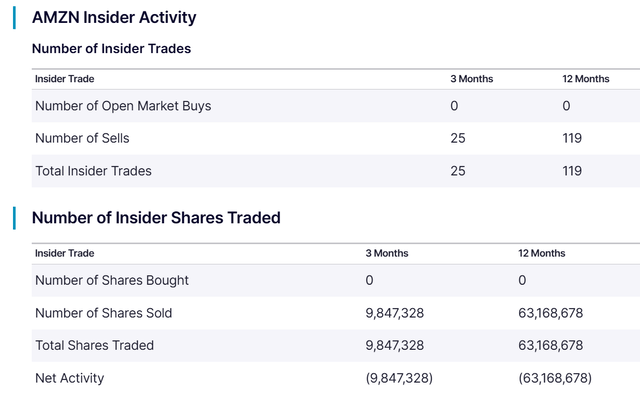
Similar technical reversal patterns are popping up everywhere on Wall Street in recent days, with buyers disappearing in most Big Tech names. I have written on a handful of bearish technical tripwires reached over the last several months, in particular on Advanced Micro Devices (AMD) here, Meta Platforms (META) here, NVIDIA (NVDA) here, and Microsoft (MSFT) here.
Could it be we are entering a recession and sustainable decline in the largest technology names, just like the original Dotcom-centered bust of 2000? Remember, every other dramatic overextension of Wall Street pricing has reversed into a bear market or bust in America’s history. Will 2024-25 be any different? (The correct answer is no.)
This time around, the saving grace for Amazon shareholders will be its high-income cloud and subscription services. I will admit I can see shares declining far less than the likes of Nvidia and AMD, coming off the AI-crazed valuations they now enjoy. If the company is lucky, maybe a -25% to -30% price decline is all AMZN experiences from $167, as improving operating results temper future bouts of panic selling.
After a decent correction in Amazon’s price, we could again find a smarter time to acquire shares, anticipating a rebound phase similar to 2023 and early 2024. I will try to write an article when Amazon becomes a better risk/reward proposition.
However, the immediate trend is likely lower over the next 6-12 months. So, I am staying at a Sell rating for Amazon, using a 1-year outlook. Reducing your position size, hedging your gains, and/or waiting for a better entry may prove the prudent courses of action for the average retail investor.
Thanks for reading. Please consider this article a first step in your due diligence process. Consulting with a registered and experienced investment advisor is recommended before making any trade.
Analyst’s Disclosure: I/we have a beneficial short position in the shares of NVDA either through stock ownership, options, or other derivatives. I wrote this article myself, and it expresses my own opinions. I am not receiving compensation for it (other than from Seeking Alpha). I have no business relationship with any company whose stock is mentioned in this article.
I am short Big Tech, including Amazon, through their heavy weightings in the NASDAQ 100 and S&P 500 indexes. I am bearishly positioned in both indexes through derivatives.
This writing is for educational and informational purposes only. All opinions expressed herein are not investment recommendations and are not meant to be relied upon in investment decisions. The author is not acting in an investment advisor capacity and is not a registered investment advisor. The author recommends investors consult a qualified investment advisor before making any trade. Any projections, market outlooks, or estimates herein are forward-looking statements based upon certain assumptions that should not be construed as indicative of actual events that will occur. This article is not an investment research report, but an opinion written at a point in time. The author's opinions expressed herein address only a small cross-section of data related to an investment in securities mentioned. Any analysis presented is based on incomplete information and is limited in scope and accuracy. The information and data in this article are obtained from sources believed to be reliable, but their accuracy and completeness are not guaranteed. The author expressly disclaims all liability for errors and omissions in the service and for the use or interpretation by others of information contained herein. Any and all opinions, estimates, and conclusions are based on the author's best judgment at the time of publication and are subject to change without notice. The author undertakes no obligation to correct, update or revise the information in this document or to otherwise provide any additional materials. Past performance is no guarantee of future returns.
Seeking Alpha’s Disclosure: Past performance is no guarantee of future results. No recommendation or advice is being given as to whether any investment is suitable for a particular investor. Any views or opinions expressed above may not reflect those of Seeking Alpha as a whole. Seeking Alpha is not a licensed securities dealer, broker or US investment adviser or investment bank. Our analysts are third party authors that include both professional investors and individual investors who may not be licensed or certified by any institute or regulatory body.
