Summary:
- In this article, I discuss the Amazon’s long-term prospects and also perform 2 types of company valuation analysis (DCF and relative).
- Amazon has focused on cost management while increasing its market share in e-commerce. The Cloud segment has ~55% of the market share in IaaS and PaaS (combined).
- Based on my quite conservative DCF models, AMZN is 25-32% undervalued today.
- Relative valuation analysis is even more generous to the stock, giving it an upside potential of 24-57%, depending on which ratio you choose.
- AMZN could begin to test its local lows if a massive sell-off begins. But already now, investors have some margin of safety.

4kodiak/iStock Unreleased via Getty Images
Intro & Thesis
Amazon (NASDAQ:AMZN) stock ended 2022 with a 50% correction (about the same percentage drop from its peak) – one of the worst years in the stock’s history if you do not count the drama of the 2000s:
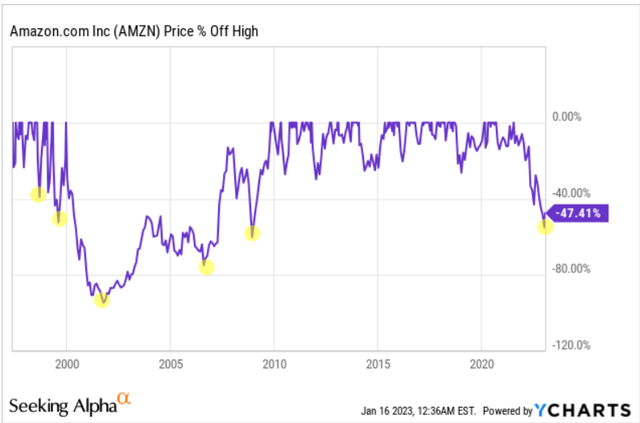
Seeking Alpha, YCharts, author’s notes
I last reviewed Amazon in late July 2022, when I concluded that the stock was still trading quite high and there were some red flags to consider. The article aged well since then:
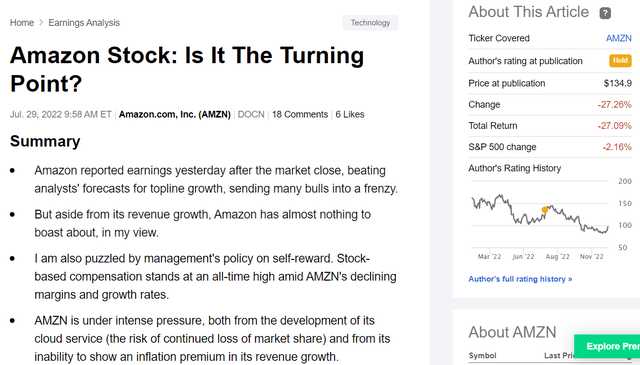
Seeking Alpha
Today, I update my thesis but change the previous rating from Neutral to Buy. Amazon has focused on cost management while increasing its market share in E-commerce. In addition, AWS continues to actively expand, and the company’s overall valuation is now at multi-year low levels. This is something that I could not find half a year ago and see today.
Cost optimization, E-commerce, and Cloud
The first point I would like to draw your attention to is that management has attempted to increase cost optimization efforts by expanding layoffs to 18,000 jobs (an estimated 5.5% of the company’s workforce) in several unprofitable divisions such as Alexa (which reportedly loses $5 billion annually), Amazon Stores, and the People, Experience, and Technology Group.
According to Reuters, this was one of the largest layoffs in the technology sector in terms of the absolute number of employees.
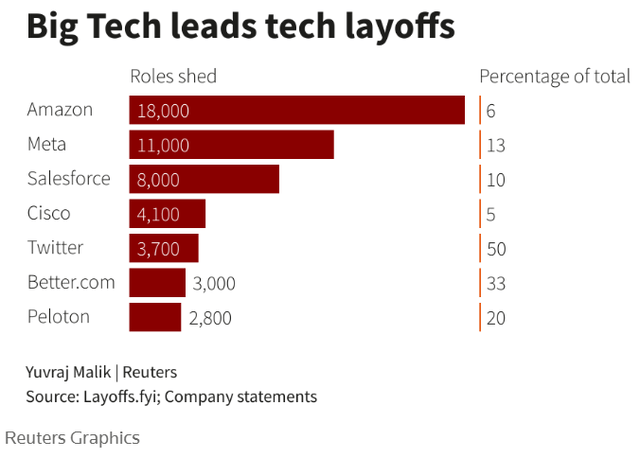
Reuters Analytics
Unlike Twitter, Peloton (PTON), or Better.com, however, Amazon has laid off relatively few employees. Apparently, management has decided to sacrifice prospects in unprofitable and very high-risk segments and focus on building market share in existing and very profitable segments.
Bank of America analysts noted in their Jan. 9 note that AMZN continues to gain share in the e-commerce industry as Amazon’s U.S. retail spending growth for the first 3 quarters of 2022 outpaced both U.S. Census data and the bank’s card spend data.
Wells Fargo’s Brian Fitzgerald has noted the same trend in Census data – for much of the last decade, e-commerce sales grew about 15% nationwide, and if it comes back to the long-term trend line, Amazon’s fourth-quarter guidance of 2%-8% sales growth seems too conservative.
As the absolute leader in the Western e-commerce market, Amazon has every chance of riding the projected 27% CAGR that ReportLinker analysts indicate in their forecasts for this market [2023 to 2027]. According to their calculations, this global market will amount to almost $13 trillion by 2027, which is a lot even for Amazon.
According to Statista, Amazon had about 13% of the global e-commerce market in 2021. And if it is indeed $13 trillion, AMZN’s market cap today is a measly 7.7%.
![Statista [data as of 2021]](https://static.seekingalpha.com/uploads/2023/1/16/49513514-1673852956880067.png)
Statista [data as of 2021]
In terms of upside potential, I think there is much to consider because even if Amazon’s market share does not grow from here. The company already has the necessary moat and margin of safety for future margin expansion.
Amazon definitely has a moat and a technology advantage in its Cloud segment. According to Statista, Amazon’s share of the global cloud infrastructure market was 34% in the 3d quarter of 2022, still above the combined market share of its two largest competitors, Microsoft Azure and Google Cloud.
Amazon Web Services (AWS) remains strong in growth and margins, but both revenue growth and margin levels have disappointed investors last quarter. In 3Q22, AWS revenue of $20.5 billion (16% of total revenue) grew 27% year-over-year and 4% quarter-over-quarter. AWS’ EBIT was $5.40 billion, down from $5.72 billion in 2Q22 and up 11% from $4.88 billion a year earlier. AWS’ EBIT margin was 26.3% in 3Q22, down from 29.0% in 2Q22 and 30.3% a year ago. AWS has now reached an annual revenue run rate of more than $80 billion, but will likely face tough comparisons in the coming quarters that could challenge revenue growth, analysts from Argus Research note.
I agree with these conclusions – the higher the basis of comparison, the more difficult it is for a company to continue to achieve growth of 20%+, especially against the backdrop of a narrowing market in anticipation of difficult times (customers will spend less on expanding to the cloud in 2023 or have already started doing so). However, long-term growth is by no means out of the question – the need to implement Infrastructure as a Service (IaaS) and Platform as a Service (PaaS) technologies, where Amazon has a combined share of about 55% of the total market, according to BofA, will only grow over the next 5 to 10 years.
Grandview Research valued the global PaaS market size at $60.12 billion in 2021, seeing a CAGR of 19.3% from 2022 to 2028. The Business Research Company calculated that the global IaaS market size will grow from $81.16 billion in 2022 to $96.93 billion in 2023 at a compound annual growth rate CAGR of 19.4% despite all the difficulties in the world. Research and Markets sees a long-term CAGR of 27.2% for IaaS.
So I think 2023 is likely to be difficult compared to the high base of 2021-22, but still, it is unlikely that the growth will stop – the technological edge AMZN has may give the company better cost/price control over other players in the market.
Amazon’s DCF And Relative Valuation
Thinking about the future is always relaxing and gives a warm feeling of hope for the best that all investors need. However, in such moments it is best to wake up and try to approach the valuation as soberly as possible because a lot depends on it.
Let’s assume that AMZN’s revenue declines 8% year-over-year in E2023 and then increases at a CAGR of 14.65% through E2026. Let us assume that the EBITDA margin drops to a positive 9% in E2023 (with an EBIT margin of only 2%), but then gradually increases to 14% by E2026, with an EBIT margin of 6.8%. This does not look too optimistic – in FY2020, for example, we have already seen an EBITDA margin of 12.5%, and in FY2020 the EBIT margin reached 5.93%.
The D&A ratio as a percentage of total sales is expected to fluctuate between 6.5% and 6.9% from year to year. Receivables as a percentage of sales will amount to 7.3% in E2023 and then decrease to 6.5% in E2024, reflecting the company’s improved operations. In the remaining forecast years, they will remain constant at 7%. The ratio of inventories to sales will increase to 8% in E2023, reflecting difficult times (inventory growth is almost always a problem in retail), but from E2024 onwards this ratio will gradually decrease to reach 6.9%, reflecting the greater weight of the Cloud segment in Amazon’s business. Accounts payable will increase slightly to 8% of sales, continuing the trend from FY2020 – I assume that the management team will try to improve their cash conversion cycle. However, starting in FY2024, I expect this ratio to gently decline from 8% to 6.9% – similar to the FY2017 – FY2019 dynamic.
CAPEX as % of revenue will decline by ~140 bn p. in E2023 and will amount to just 7%, based on my calculations. Looking at prior historical periods, we see that as Amazon grew, it went through various investment cycles where it increased and decreased its capital expenditures. Since 2020, this cycle has been at its peak due to the fairly low cost of capital – almost free project financing allowed AMZN to invest up to 13% [as of its revenues] – just like back in the 2000s:
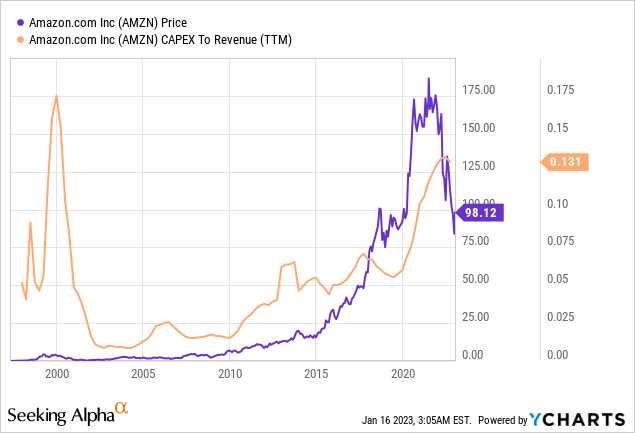
My assumption of 7% will also apply to E2024, after which it will gradually rise to 7.8% by E2026 because the company’s business structure – which is different in many respects from what it was 20 years ago – will not allow innovation costs to be radically reduced.
The discount rate – [WACC] – I use for the DCF model I’m describing has the following inputs:
- the risk-free rate of 3.5%;
- cost of debt of 4%;
- tax rate of 13%;
- the beta of 1.2;
- the market risk premium of 4.7%.
At the output I get the following free cash flow data:
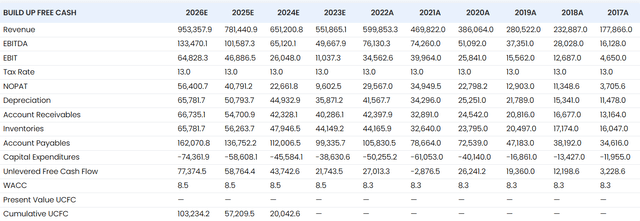
Stratosphere.io, author’s calculations
If we assume that Amazon continues to grow at a 4% rate in the post-forecast period, the fair value per share today is $129.1 – that’s an upside of about 31.5% from the closing price on the last trading day.
If we assume that the stock will trade at 12 times its EBITDA by the end of 2026 – which is very conservative in itself – its fair value is $123.2 per share (upside potential of ~25.6% at the current share price).
Last year’s share price performance made Amazon stock an excellent example of undervaluation that not everyone understands or recognizes.
After reading some insanely exciting and undeniably excellent investment books by Peter Lynch and his followers, some investors make investment decisions based solely on price-to-earnings ratios (or similar well-known multiples) without considering the specifics of any one industry.
Amazon’s P/E ratio [FWD] is 60x according to YCharts data – that’s a lot and scares many retail investors. However, one must remember that it does not matter how a retailer makes money – offline or online – it is first and foremost a retail business. This industry is characterized by a fairly low-profit margin, and when the crisis starts, the variability of that margin increases sharply – not in the best direction for the business, of course. Just as quickly, it will stabilize again once the economic cycle moves in the other direction. Therefore, the P/E ratio is no longer representative in this situation. More important for companies in this sector are revenue-related multiples, because it is the dynamics of revenue that tell us about the stability of the business model. If we look at the multiples associated with this indicator and even add other equally important EV/EBITDA and price-to-book ratios, we see that AMZN stock is trading near the local lows of its relative valuation ranges.
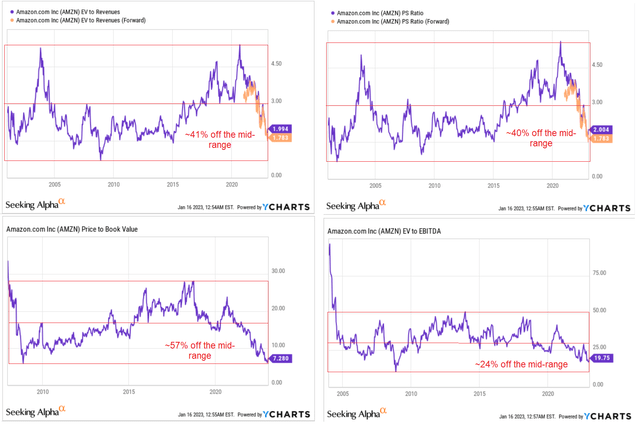
YCharts, Seeking Alpha, author’s notes
Compared to long-term historical multiples, AMZN stock appears undervalued by 24-57%, depending on which ratio you choose. These results broadly confirm what my DCF model has shown.
Bottom Line
I admit that my conclusions and the Buy rating itself carry several fairly significant risks. First, as I noted in my article “How To Position Your Portfolio For 2023“, we are going through a period of turmoil that is likely to continue throughout 2023, culminating in a recession sometime in the middle of the year.
To this article, I can only add that betting on high-quality bonds in 2023 looks much more attractive, as it seems that the bottom of this asset class has already been reached and the bottom of the stock market is still ahead:
![All Star Charts on Twitter [shared by @Callum_Thomas]](https://static.seekingalpha.com/uploads/2023/1/16/49513514-167384650852626.jpg)
All Star Charts on Twitter [shared by @Callum_Thomas]
The second risk associated with my thesis is the sensitivity of my DCF outputs to several underlying assumptions. For example, if I increase the WACC to 10% [by increasing the MRP to 6.1%], I get a fair value per share of $92.6 – in which case we must speak of overvaluation, not undervaluation.
Or, for example, what happens to the valuation of the stock if the company cannot quickly return to positive revenue growth in E2024? Let us assume the CAGR is not 14.65%, but 8.6% – then AMZN’s fair value drops to $107 per share – severely limiting upside potential.
In the event of a massive sell-off or sustained earnings downgrades, which I believe are very likely for the entire technology sector, AMZN could begin to test its local lows – a risk of which all prospective and existing investors should be aware.
However, despite this, I believe Amazon stock has already entered the oversold and overvalued territory. Literally last week, the stock managed to utilize the accumulated divergence and break through the downtrend channel – a classic triangle pattern:
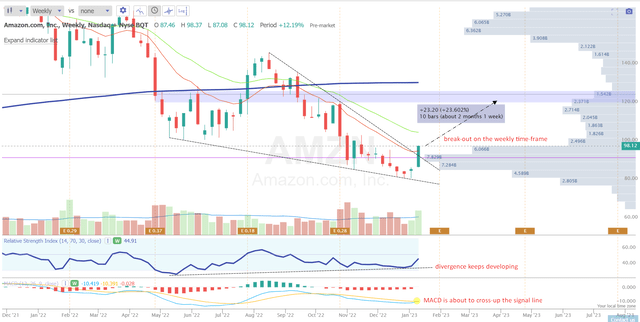
TrendSpider, AMZN, author’s notes
The volumes during this move were quite good – it seems to me that if the risk-on rally continues and (SPY) does not bounce off its next resistance, AMZN has every chance to “pull up” to its previous levels with increased vertical volumes.
The nearest target is 20-25% of the current price. This should be my medium-term price target, I guess.
Thank you for reading!
Disclosure: I/we have no stock, option or similar derivative position in any of the companies mentioned, but may initiate a beneficial Long position through a purchase of the stock, or the purchase of call options or similar derivatives in AMZN over the next 72 hours. I wrote this article myself, and it expresses my own opinions. I am not receiving compensation for it (other than from Seeking Alpha). I have no business relationship with any company whose stock is mentioned in this article.
Struggle to navigate the stock market environment?
Beyond the Wall Investing is about active portfolio positioning and finding investment ideas that are hidden from a broad market of investors. We don’t bury our heads in the sand when the market is down – we try to anticipate this in advance and protect ourselves from unnecessary risks accordingly.
Keep your finger on the pulse and have access to the latest and highest-quality analysis of what Wall Street is buying/selling with just one subscription to Beyond the Wall Investing! Now there is a free trial and a special discount of 10% – hurry up!
